on any vertically uniform strongly stratified flow. This instability limits the vertical coherence of the flow and therefore may explain and predict the vertical size of.
J. Fluid Mech. (2000), vol. 419, pp. 65–91. c 2000 Cambridge University Press
Printed in the United Kingdom
65
Three-dimensional stability of a vertical columnar vortex pair in a stratified fluid By P A U L B I L L A N T1,2 †
AND
J E A N-M A R C C H O M A Z1
´ LadHyX, CNRS, Ecole Polytechnique, F–91128 Palaiseau Cedex, France M´et´eo–France CNRM Toulouse, 42 avenue Coriolis, F–31057 Toulouse, France 1
2
(Received 1 November 1999)
This paper investigates the three-dimensional stability of a Lamb–Chaplygin columnar vertical vortex pair as a function of the vertical wavenumber kz , horizontal Froude number Fh , Reynolds number Re and Schmidt number Sc. The horizontal Froude number Fh (Fh = U/NR, where U is the dipole travelling velocity, R the dipole radius and N the Brunt–V¨ ais¨ al¨ a frequency) is varied in the range [0.033, ∞[ and three set of Reynolds-Schmidt numbers are investigated: {Re = 10 000, Sc = 1}, {Re = 1000, Sc = 1}, {Re = 200, Sc = 637}. In the whole range of Fh and Re, the dominant mode is always antisymmetric with respect to the middle plane between the vortices but its physical nature and properties change when Fh is varied. An elliptic instability prevails for Fh > 0.25, independently of the Reynolds number. It manifests itself by the bending of each vortex core in the opposite direction to the vortex periphery. The growth rate of the elliptic instability is reduced by stratification effects but its spatial structure is almost unaffected. In the range 0.2 < Fh < 0.25, a continuous transition occurs from the elliptic instability to a different instability called zigzag instability. The transitional range Fhc = 0.2–0.25 is in good agreement with the value Fh = 0.22 at which the elliptic instability of an infinite uniform vortex is suppressed by the stratification. The zigzag instability dominates for Fh 6 0.2 and corresponds to a vertically modulated bending and twisting of the whole vortex pair. The experimental evidence for this zigzag instability in a strongly stratified fluid reported in the first part of this study (Billant & Chomaz 2000a) are therefore confirmed and extended. The numerically calculated wavelength and growth rate for low Reynolds number compare well with experimental measurements. The present numerical stability analysis fully agrees with the inviscid asymptotic analysis carried out in the second part of this investigation (Billant & Chomaz 2000b) for small Froude number Fh and long wavelength. This confirms that the zigzag instability is related to the breaking of translational and rotational invariances. As predicted, the growth rate of the zigzag instability is observed to be self-similar with respect to the variable Fh kz , implying that the maximum growth rate is independent of Fh while the most amplified dimensional wavenumber varies with N/U. The numerically computed eigenmode and dispersion relation are in striking agreement with the analytical results.
† Present address: M´et´eo–France CNRM Toulouse, 42 avenue Coriolis, F–31057 Toulouse, France.
66
P. Billant and J.-M. Chomaz
1. Introduction In the present paper, we analyse numerically the three-dimensional linear stability of a vertical columnar vortex pair in a stably stratified fluid mainly as a function of the vertical wavenumber and the horizontal Froude number. This investigation is motivated by recent experimental observations of a zigzag instability operating on a vertical columnar vortex pair in a strongly stratified fluid (Billant & Chomaz 2000a, referred to hereinafter as part 1). From an initial vertically coherent state, the zigzag instability bends and twists the vortex pair as a whole, leading ultimately to the formation of decoupled horizontal layers in which the flow is still a dipole. The layered structure exhibits a well-defined vertical scale which is dynamically determined and not initially imposed. Since this instability is distinct from the Crow and elliptic instabilities observed to destabilize vortex pairs in homogeneous fluids, the zigzag mode represents a new class of instability which has no counterpart in the homogeneous problem. Such a type of instability is of major interest since it could be generic and operate on any vertically uniform strongly stratified flow. This instability limits the vertical coherence of the flow and therefore may explain and predict the vertical size of pancake structures widely observed in strongly stratified flows (Lin & Pao 1979; Riley, Metcalfe & Weissman 1981; Hopfinger 1987; Herring & M´etais 1989; M´etais & Herring 1989; Browand, Guyomar & Yoon 1987; Lin et al . 1992; Chomaz et al . ´ & van Heijst 1996; Fincham, Maxworthy & Spedding 1996; Spedding, 1993; Flor Browand & Fincham 1996; Kimura & Herring 1996; Spedding 1997; Bonnier, Eiff & Bonneton 2000). In the light of the experimental observations of the zigzag instability, we have developed a general theoretical approach to account for this instability (Billant & Chomaz 2000b, hereinafter referred to as part 2). By means of an asymptotic inviscid analysis for small horizontal Froude number, Fh = U/(NR), where U is the dipole propagating velocity, N the Brunt–V¨ ais¨ al¨ a frequency and R the dipole radius, we have demonstrated the existence of a long-wavelength instability that originates from the breaking of translational and rotational invariances. The unstable perturbations, which are sinusoidally modulated along the vertical, involve both a lateral slide and a rotation of the whole vortex pair. This instability thus bends and twists the columnar vortex pair as a whole as indeed is observed in the experiments. An important theoretical prediction is that maximum growth will be achieved for a dimensional vertical wavelength proportional to U/N in the inviscid limit. Unfortunately, it has not been possible to confirm this vertical scaling in the laboratory experiment (part 1) because the low Froude numbers where the zigzag instability is observed are dominated by viscous effects. Indeed, in laboratory experiments, low Froude numbers may be achieved only by lowering the characteristic velocity U since, in practice, the Brunt–V¨ ais¨ al¨ a frequency and the dipole size are bounded. The low Froude number regime is therefore always associated with low Reynolds numbers. In contrast, such a limitation is not encountered in a numerical stability analysis since the Froude and Reynolds numbers can easily be varied independently over a wide range. The goal of the present study is three-fold: (i) General study of the influence of a stable stratification on the three-dimensional stability of columnar vertical vortices for arbitrary horizontal Froude numbers. A similar stability analysis of columnar vertical vortex arrays has been recently carried out by Potylitsin & Peltier (1998). Stratification effects were found to be stabilizing but only weak stratifications were considered.
Three-dimensional stability of a vertical vortex pair in a stratified fluid
67
(ii) Validation and extension of the asymptotic analysis (part 2) to finite Froude numbers and wavenumbers. (iii) Comparison with the experimental results (part 1). The paper is organized as follows. In § 2, we outline the Lamb–Chaplygin basic state and the linearized perturbation equations. The numerical method used to solve the stability equations is described in § 3. In § 4, the most unstable normal mode of the Lamb–Chaplygin vortex pair is determined as a function of the vertical wavenumber kz for Froude numbers in the range [0.033, ∞[ and for three Reynolds–Schmidt number sets: {Re = 10 000, Sc = 1}, {Re = 1000, Sc = 1} and {Re = 200, Sc = 637}. The symmetry of the eigenmodes is first discussed in § 4.1. Growth rates are presented in § 4.2 as a function of the vertical wavenumber kz , Froude number Fh and Reynolds number Re. Eigenmodes of the elliptic and zigzag instabilities are described in §§ 4.3 and 4.4. The transition from the elliptic to the zigzag instability when the Froude number is varied is characterized in § 4.5. Section 5 is devoted to a full comparison with the theoretical results, growth rates (§ 5.1) and spatial eigenmodes (§ 5.2), obtained in part 2. Finally, a comparison between numerical and experimental results is provided in § 6.
2. Problem formulation In the following, we use either Cartesian coordinates (x, y, z) or cylindrical coordinates (r, θ, z) with x = r cos θ and y = r sin θ and z pointing in the vertical direction. The governing equations are the Navier–Stokes equation within the Boussinesq approximation 1 ρ0 Du = − ∇P − g ez + ν∆u, (2.1a) Dt ρ0 ρ0 together with the incompressibility condition ∇ · u = 0,
(2.1b)
and the density equation ∂¯ ρ Dρ0 + uz = D∆ρ0 , (2.1c) Dt ∂z where u = (ux , uy , uz ) is the velocity vector in Cartesian coordinates, P the pressure, g the gravity, ez the unit vector in the positive z-direction, ν the kinematic viscosity, and D the molecular diffusivity of the stratifying agent. The total density ρ is expressed ¯(z) and as the sum of a constant reference density ρ0 , a linear mean density profile ρ a perturbation density ρ0 (x, t) ¯(z) + ρ0 (x, t). ρ(x, t) = ρ0 + ρ
(2.2)
As in part 2, the Lamb–Chaplygin dipole (Lamb 1932; Batchelor 1967; Meleshko & van Heijst 1994) is used as a basic state. This exact solution of the two-dimensional Euler equations describes a pair of counter-rotating vortices. The streamfunction ψ0 and vertical vorticity ωz0 = ∆ψ0 of this solution expressed in a co-moving frame of reference are � r� 2UR µ2 J1 µ1 sin θ, ωz0 = − 12 ψ0 (r 6 R), (2.3a) ψ0 (r, θ) = − µ1 J0 (µ1 ) R R
68
P. Billant and J.-M. Chomaz � R2 ωz0 = 0 ψ0 (r, θ) = −Ur 1 − 2 sin θ, r �
(r > R).
(2.3b)
where U and R are the propagating velocity and the radius of the dipole, J0 and J1 are the zero and first-order Bessel functions and µ1 = 3.8317 is the first zero of J1 . The associated horizontal velocity is given by uh0 = −∇ × (ψ0 ez ). The vertical velocity uz0 and density perturbation ρ00 of the basic state are identically zero. In what follows, R is taken as the length unit and the advective timescale R/U is taken as the time unit. The pressure is rescaled by ρ0 U 2 and the density by ρ0 U 2 /(gR). For simplicity, the same notation is kept for the dimensionless variables. The two-dimensional basic state (2.3) is subjected to infinitesimal three-dimensional perturbations governed by the non-dimensional linearized equations for the pertur˜0 ˜ = ∇ × u˜ , pressure ˜ bation velocity u˜ , vorticity ω p and density ρ 1 ∂u˜ ˜0 ez + ˜ × uh0 = −∇(˜ + ωz0 ez × u˜ + ω ∆˜u, (2.4) p + uh0 · u˜ ) − ρ ∂t Re ∇ · u˜ = 0,
(2.5)
1 1 ∂˜ ρ0 ˜0 − 2 u ˜z = + uh0 · ∇h ρ ∆˜ ρ0 , ∂t ScRe Fh
(2.6)
where ∇h ispthe horizontal component of ∇, Re = UR/ν, Sc = ν/D, Fh = U/RN ρ/∂z. The viscous diffusion of the basic state is omitted as and N = −(g/ρ0 )∂¯ classically done in stability analysis (Drazin & Reid 1981). This reasonably describes the dynamics of a real flow if the growth rate of three-dimensional instabilities is large compared to viscous damping of the basic flow. Since the basic state is uniform along the z-axis, the perturbation may be expressed by a normal mode ˜0 ](x, y, z, t) = [u; ω; p; ρ0 ](x, y, t) eikz z + c.c., ˜ ˜ [˜u; ω; p; ρ
(2.7)
where kz is the vertical wavenumber and c.c. denotes the complex conjugate. In this case, (2.4)–(2.6) become 1 ∂u + ωz0 ez × u + ω × uh0 = − ∇h (p + uh0 · u) − [ikz (p + uh0 · u) + ρ0 ]ez + (∆h u − kz2 u), ∂t Re (2.8) ∇h · uh + ikz uz = 0,
(2.9)
1 1 ∂ρ0 (∆h ρ0 − kz2 ρ0 ), + uh0 · ∇h ρ0 − 2 uz = ∂t ScRe Fh
(2.10)
where uh is the horizontal component of u and ∆h the horizontal Laplacian.
3. Numerical method In order to study the three-dimensional stability of the vortex pair, we shall not explicitly determine the matrix operator deriving from (2.8)–(2.10) and compute all its eigenmodes as, for instance, in the pioneering work of Pierrehumbert & Widnall (1982) on three-dimensional instabilities of a mixing layer. Instead, we shall determine only the eigenmode with the largest growth rate by integrating numerically (2.8)–(2.10) for each kz value. The perturbation velocity u(x, y, t = 0) is first initialized with a divergence-free white noise while the perturbation density field ρ0 (x, y, t = 0) is left to
Three-dimensional stability of a vertical vortex pair in a stratified fluid
69
zero. Then, by integrating the linear equations (2.8)–(2.10) for a sufficiently long time, the leading eigenmode emerges after a transient (Goldhirsch, Orszag & Maulik 1987; Edwards et al . 1994; Mamun & Tuckerman 1995). Therefore, for a given vertical wavenumber kz , the velocity and density perturbation evolve asymptotically for large times as (3.1) lim [u; ρ0 ](x, y, t) = [U ; D](x, y) eσt , t→∞
where σ is the eigenvalue of the leading eigenmode, U (x, y) the velocity eigenfunction with kinetic energy normalized to unity and D(x, y) the associated density eigenfunction. Implementation of a more sophisticated method involving the use of a higher-dimensional Krylov space (Edwards et al . 1994) is not necessary here since we are only interested in the leading eigenmode. To integrate numerically the system (2.8)–(2.10) for a given kz , a pseudo-spectral scheme has been implemented in Cartesian coordinates with periodic boundary conditions. A three-dimensional code has been adapted to linear stability analyses by Brancher (1996) and successfully validated in the case of instabilities in jets (Brancher, Chomaz & Huerre 1996; Delbende, Chomaz & Huerre 1998) and Stuart’s vortices (Brancher 1996). In the present investigation, the code has been modified to take into account a density field and the associated buoyancy force. The main steps of the numerical method are outlined below. Variables in (2.8)–(2.10) are expressed in Fourier space by application of the twodimensional Fourier transform, for example, ZZ u(x, y, t) e−i(kx x+ky y) dxdy, (3.2) uˆ (kx , ky , t) = where kx and ky are the horizontal components of the total wavenumber k = (kx , ky , kz ). In spectral space, the governing equations (2.8)–(2.10) are replaced by
k2 0 ∂ρˆ 0 1 0 ˆ = −iku\ ρˆ . w − ρ + h0 ∂t ScRe Fh2
(3.4)
The tensor P(k) with Cartesian components Pij ≡ δij −ki kj /k2 designates the projection operator on the space of solenoidal fields so as to enforce the divergence equation uˆ · k = 0. The terms (u × ωz0 ez + uh0 × ω) in (3) and uh0 ρ0 in (3.4) are evaluated in the physical space. The classical 2/3 truncation rule is used for de-aliasing in Fourier space. The time integration is performed with the second-order finitedifference Adams–Bashforth numerical scheme. The dissipative terms are integrated exactly. In most simulations, the periodic square box of size L = 9 is made up of 256×256 collocation points equally spaced on a Cartesian mesh with δx = δy = 0.035. For large Froude number values Fh > 0.1, the time increment is δt = 0.0019. For Fh = 0.05 and Fh = 0.033, δt is lowered to δt = 0.001 and δt = 0.00075, respectively. In some cases, the number of collocation points has been increased to 512 × 512 to check the convergence. Purely real growth rate is retrieved by the formula 1 d ln E , t→∞ 2 dt
σ = lim
(3.5)
where E = ¯ u2x + ¯ u2y + ¯ u2z is the kinetic energy perturbation, the overbar denoting spatial
70
P. Billant and J.-M. Chomaz L=6
L=9 L
δx 0.023 0.012
6
L 12
1
0.625 0.6252
L = 12
0.600
δx 2
0.035 0.018
9
L 18
1
0.603 0.6072
0.593
δx 2
0.047 0.023
12
24 1
0.572 0.6002
0.5672
Table 1. Growth rates for a typical case: Fh = 0.1, kz = 4 and {Re = 10 000, Sc = 1} as a function of the box size L and mesh size δx. The superscript indicates the number of collocation points: 1 : 256 × 256, 2 : 512 × 512.
integration over the square computational domain. To reach an asymptote in this formula and achieve an accuracy for σ of at least three significant figures, a typical integration time of 15 time units (turn over time) is necessary. This integration time is increased when the leading eigenvalue is not well separated from the others. The spatial structure of the corresponding eigenmode is obtained after normalizing the velocity and density fields of the last time-step by its kinetic energy. In practice, once an eigenmode has been determined for a particular set of values {Fh , Re, Sc, kz }, the parameter space can be explored by continuation to speed up the convergence toward the most unstable normal mode. Specifically, instead of using white noise, a simulation can be initialized by the eigenmode obtained from a previous simulation for slightly different parameters {Fh , Re, Sc, kz }. Before turning to the results, it is necessary to give the reasons for the choice of the numerical parameters and the accuracy of the present method. The box and mesh sizes chosen are, in fact, a compromise leading to an optimal convergence and accuracy of the growth rate values for the reasonable 256×256 spectral discretization. The first constraint is that the box size should be large so as to minimize the effect of the periodic boundary conditions. However, for a fixed number of collocation points, increasing the box size decreases the resolution. Thus, there exists a compromise between the two opposing requirements: large box size and fine resolution. Three computational domain sizes have been tested L = 6, L = 9 and L = 12 for a typical case. The computed growth rates for each domain size are given in table 1. The respective influences of the periodic boundary conditions and of the resolution have been checked by doubling the box size, the resolution being fixed and, conversely, by doubling the resolution and keeping the box size constant (in each case, the number of collocation points is increased four times). As seen in table 1, the box size L = 9 is the best compromise since both tests lead to a relative variation of the growth rate value of less than 1.7%. In contrast, the box size L = 6 is too small because doubling the box size leads to a relative variation of the growth rate value of 4%. Similarly, the large box L = 12 together with 256 × 256 collocation points does not provide a sufficient resolution because halving the mesh size leads to a 5% variation of the growth rate. The convergence of the growth rates with the numerical parameters is, in fact, especially slow at low Froude numbers (Fh < 0.25). In this regime, the vorticity of the numerically computed eigenmode exhibits a sharp variation at the dipole boundary r = 1 as predicted from the asymptotic theory (part 2). Accordingly, a high resolution is needed to sample these regions satisfactorily. In addition, the velocity fields of the neutral modes from which the instability derives for small Froude numbers and small
Three-dimensional stability of a vertical vortex pair in a stratified fluid
71
L=9 L δx 0.035 0.018
9
18 1
1.220663 1.2214772
1.2206662
Table 2. Same as table 1 for the case: Fh = ∞, Re = 10 000 and kz = 4. Only the box size L = 9 has been tested in this case.
wavenumbers decrease only algebraically fast as r → ∞: the translational mode in the y-direction decreases as 1/r3 , while the rotational mode decreases as 1/r2 (part 2). Therefore, a large box is required for the confinement to have a negligible influence on the instability. These are the reasons why a high discretization (256 × 256) and large box (L = 9) leads to only a 1.7% accuracy at low Froude numbers. In contrast, for higher Froude numbers (Fh > 0.25), the vorticity of the leading eigenmode is spatially smooth and its velocity is localized so that a far better accuracy is achieved. As seen in table 2, for Fh = ∞, there is a relative variation of 0.07% of the growth rate when the mesh size is halved and 0.0002% when the box size L = 9 is doubled. In this case, a smaller box and a coarser grid could have been used but the same sizes have been kept throughout the study for coherence. Finally, we should remark that more difficulties have been encountered during the computations at small Froude numbers (Fh 6 0.25) than at large Froude numbers (Fh > 0.33). At low Froude numbers, weak small-scale distortions are sometimes apparent in the computed eigenmodes, especially in the vorticity and vertical velocity fields. When this happens, we have systematically checked that these distortions are smoothed out when a higher resolution (512 × 512) is employed. However, since the growth rate varies typically only by 2% between the 256 × 256 and 512 × 512 resolutions, the convergence of the 256 × 256 computations has been judged to be sufficient and all the results presented in this paper have been obtained with this resolution.
4. Three-dimensional instabilities of the columnar vortex pair 4.1. Symmetry of the eigenmodes The normal modes separate into two classes with distinct symmetries in the ydirection: symmetric modes whose velocity and density fields verify the following symmetries (4.1) [ux , uy , uz , ρ0 ](x, y) = [ux , −uy , uz , ρ0 ](x, −y), and antisymmetric modes with the inverse symmetries [ux , uy , uz , ρ0 ](x, y) = [−ux , uy , −uz , −ρ0 ](x, −y).
(4.2)
This decoupling between normal modes arises because the basic state (2.3) has the symmetries (4.1). More physically, antisymmetric and symmetric modes correspond to antisymmetric and symmetric distortions of the two vortex axes with respect to the middle plane y = 0. In the homogeneous case (Fh = ∞), a detailed characterization of the threedimensional instabilities of the Lamb–Chaplygin vortex pair has been given by
72
P. Billant and J.-M. Chomaz
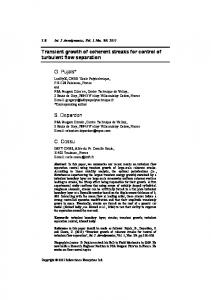
Billant, Brancher & Chomaz (1999). In this study, both the symmetric and antisymmetric modes have been systematically determined by enforcing the symmetry on the perturbation in two separate sets of numerical simulations. This study recovered the well-known long wavelength Crow instability, which is symmetric, and the antisymmetric elliptic instability recently observed experimentally by Leweke & Williamson (1998). In addition, a symmetric elliptic instability as well as oscillatory bulging instabilities with symmetric and antisymmetric configurations have been found. Among all these instability branches, the antisymmetric elliptic instability possesses the largest growth rate. In the present study, no attempt has been made to systematically describe all the instability branches as done for Fh = ∞. More specifically, only the dominant branch will be presented, i.e. no symmetry will be imposed on the perturbation and, furthermore, for each group of dimensionless numbers {Fh , Re, Sc}, only the branch possessing the largest growth rate over all vertical wavenumbers kz will be studied. The latter mode is of major interest since it is expected to dominate the evolution in a real experiment. For Fh = ∞, this dominant mode is the antisymmetric elliptic mode, but, even if no symmetry has been enforced to the perturbations, all the simulations carried out exhibit a dominant antisymmetric mode independently of {Fh , Re, Sc}. However, its structure and its physical mechanism changes with Fh . The symmetric Crow instability, bulging oscillatory instabilities and symmetric elliptic instability, which exist for Fh = ∞, turn out to be subdominants for all the {Fh , Re, Sc} investigated. Stratification effects on these instabilities will therefore not be discussed in the present paper. 4.2. Growth rate In figures 1(a) and 1(b), we plot the growth rates of the leading eigenmode as a function of the vertical wavenumber kz for {Re = 10 000, Sc = 1} and for Froude numbers in the range 0.033 < Fh < 0.2 (figure 1a) and 0.2 < Fh < ∞ (figure 1b). At this high Reynolds number, the flow may be considered as inviscid in the range of vertical wavenumber investigated. These results will thus allow us to test the inviscid and non-diffusive theory of part 2. Note that the coordinate scales are not the same for the two plots. For ease of comparison, the curve for Fh = 0.2 has been included in both figures. In the homogeneous case, Fh = ∞ (figure 1a), the growth rate does not decrease at large wavenumber but asymptotes to an approximately constant value. Two maximums, with almost the same growth rate value, are noticeable on this curve (figure 1a). At low wavenumber, Billant et al . (1999) have shown the existence of an antisymmetric oscillatory bulging instability for Fh = ∞. As discussed in the previous section, its maximum growth rate is always lower than the antisymmetric elliptic instability, even when the Froude number is decreased. Thus, this oscillatory instability branch is not represented in figure 1(a) and will not be considered further. Decreasing the Froude number to Fh = 1 barely alters the growth rate curve (figure 1a). However, as the Froude number is further decreased to Fh = 0.33 and then to Fh = 0.25, the maximum growth rate and the associated wavenumber markedly decrease by a factor of two. Stratification effects are thus stabilizing, i.e. the growth rate of three-dimensional instabilities observed in homogeneous fluid is reduced. Such a stabilizing effect has been also reported by Potylitsin & Peltier (1998) in their study of weak stratification effects on columnar vortex arrays. This is in agreement with the intuitive idea that stratification effects stabilize two-dimensional flows against three-dimensional disturbances by inhibiting vertical motions. Yet, when the Froude number is further decreased below 0.2 (figure 1b), the stabilizing trend is halted and
Three-dimensional stability of a vertical vortex pair in a stratified fluid 1.2
73
Fh = ∞ 1
(a)
1.0 0.8
r
0.33 0.6 0.25 0.2
0.4 0.2 0
2
0.8 0.7
4 Fh = 0.1
(b)
6
8
0.05
10
12
25
30
0.033
0.6 0.5
r
0.4
0.15 0.2
0.3 0.2 0.1 0
5
10
15
20
kz Figure 1. Growth rates as a function of vertical wavenumber kz for {Re = 10 000, Sc = 1}. (a) 0.2 6 Fh 6 ∞. (b) 0.033 6 Fh 6 0.2.
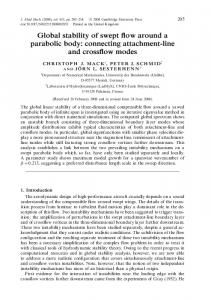
even reversed. Indeed, it can be seen that the growth rate curves for Fh = 0.2 and Fh = 0.25 are almost superposed, except at low and high wavenumbers. When the Froude number is decreased from Fh = 0.2 to Fh = 0.033 passing by 0.15, 0.1 and 0.05, the maximum growth rate first slightly re-increases and then remains constant. It is also particularly noteworthy that the stability curves are shifted to higher and higher wavenumbers as Fh is decreased. Physically, this means that the timescale of the instability remains constant while the preferred vertical scale becomes smaller and smaller when Fh is decreased. For small wavenumbers, these instability branches could not be followed because of the presence of a subdominant oscillatory instability. Therefore, the small wavenumber region is masked, but for comparison with the theory (§ 5), the growth rate for Fh 6 0.2 has been extrapolated linearly to zero as kz → 0 as shown by dashed lines in figure 1(b). In contrast, for Fh > 0.25 (figure 1a), a low-wavenumber instability cutoff seems to occur for a non-zero wavenumber if the instability branches are extrapolated down to zero growth rate. The existence of two distinct regimes is clearly demonstrated in figures 2(a) and 2(b). In these figures, the maximum growth rate σmax and the associated wavenumber kz max determined from figure 1 are presented as a function of the inverse Froude number for this set of Reynolds–Schmidt numbers together with the two other sets, {Re = 1000, Sc = 1}, and {Re = 200, Sc = 637}, which will be discussed below. Focusing our attention on the open circle data points that correspond to {Re = 10 000, Sc = 1}, the initial decrease of σmax and kz max clearly identifies a first
74
P. Billant and J.-M. Chomaz Elliptic 20
Zigzag
(a)
15
kz max
10 5 0 1.2
(b)
1.0 0.8
rmax
0.6 0.4 0.2 0
5
10
15
20
25
30
1/Fh Figure 2. (a) Wavenumber kz max and (b) growth rate σmax of the fastest growing perturbation as a function of the inverse Froude number. , {Re = 10 000, Sc = 1}; �, {Re = 1000, Sc = 1}; , {Re = 200, Sc = 637}. In (a), the error bars indicate the indeterminacy on the estimation of kz max resulting from the discretization of kz . The regimes labelled Elliptic and Zigzag indicate the regions where the instability is of elliptic type and of zigzag type, respectively.
�
◦
regime associated by continuity to the elliptic instability for Fh = ∞, and a second regime where the instability is of zigzag type as will be shown in § 5. In this second regime, kz max is growing with 1/Fh and σmax is almost constant. Weak dissipation effects have been treated by performing a similar set of computations for Re = 1000, the Schmidt number being the same as before, Sc = 1 (figure 3). As in figure 1, only the dominant instability branches are shown in figure 3. The growth rate curves exhibit essentially the same trend and profile as in figure 1. However, because viscosity has a higher stabilizing effect on large wavenumbers than on small wavenumbers, these growth rate curves are unevenly lowered when compared to the Re = 10 000 case. For Froude numbers Fh > 0.1, for which the wavenumber of maximum amplification is lower than 6, the growth rate is only slightly lowered by viscous effect. In contrast, for lower Froude numbers (Fh 6 0.05), the growth rate attenuation is more and more pronounced as Fh decreases, owing to the shift of the growth rate curves towards large wavenumbers. These trends are better seen in figures 2(a) and 2(b). σmax and kz max follow the same evolution as in the nearly inviscid case discussed previously, the only differences being the viscous damping of the growth rate together with a decrease of kz max at small Fh (large kz max ). A third set of parameters {Re = 200, Sc = 637}, which are typical of the laboratory conditions (part 1), have been investigated to compare the numerical results with experimental measurements. In constrast with the two other cases, the Schmidt number has been set to the value Sc = 637, characteristic of salt-stratified water. The growth rate curves are not shown for the latter set of Reynolds–Schmidt numbers but their main characteristics, i.e. the maximum growth rate σmax and the associated wavenumber kz max as a function of the inverse Froude number, are also summarized
Three-dimensional stability of a vertical vortex pair in a stratified fluid 1.2
75
(a) Fh = ∞
1
1.0 0.8
r
0.33 0.6 0.25 0.2
0.4 0.2 0
2
4
6
8
10
12
25
30
0.8 0.7 0.6
(b) Fh = 0.15
0.1 0.05
0.5
r
0.4
0.2 0.033
0.3 0.2 0.1 0
5
10
15
20
kz Figure 3. As in figure 1, except Re = 1000.
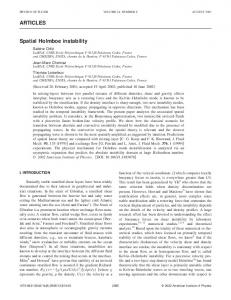
in figures 2(a) and 2(b). Once again, two distinct regimes, Fh 6 0.2 and Fh > 0.25, can be identified on the low Re curve. The viscous damping is now clearly noticeable on the curve of maximal growth rate for every Froude number (figure 2b). This effect increases dramatically as Fh decreases, since kz max increases with 1/Fh . σz max even drops to negative value for Fh smaller than approximately 0.06–0.07. However, the most amplified wavenumber is almost unaffected by diffusion. In summary, it is obvious from figures 1, 2 and 3 that stratification has different effects above and below Fhc = 0.2–0.25. This transitional regime is independent of the Reynolds and Schmidt numbers investigated. For Reynolds and Schmidt numbers approaching the inviscid limit {Re = 10 000, Sc = 1} and when Fh 6 0.2, the maximum growth rate remains constant as Fh is decreased and the wavenumber of maximum amplification increases in inverse proportion to the Froude number. This striking behaviour is not observed for Fh > 0.25, for which stratification tends to stabilize the dominant three-dimensional instability observed in the homogeneous problem. We shall see now that this transition corresponds to a change of the destabilizing mechanism associated with a modification of the spatial structure of the unstable mode from elliptic to zigzag type. 4.3. Eigenmode in the elliptic instability region The structure of the mode in the elliptic region for Fh = ∞ > Fhc and Re = 1000 is shown in figure 4 in terms of its spatial distribution of vertical vorticity and velocity components in the horizontal plane. Only the central region of the computational domain has been represented since the perturbation is localized. The wavenumber
76
P. Billant and J.-M. Chomaz (a) ωz
(b) ux
(c) uy
(d) uz
Figure 4. Elliptic instability: (a) contours of real vertical vorticity ωz , (b) real velocities ux and (c) uy and (d) imaginary vertical velocity uz in the horizontal plane for Fh = ∞, kz = 4.75 and Re = 1000. Only a domain of size 3 × 3 is shown while the original computational domain is 9 × 9. The same contour interval has been used for each velocity component. The contour interval for ωz is 10 times larger than the one for velocity components. Shaded areas are regions of negative values. The dashed circle indicates the boundary r = 1 of the dipole and the dashed line represents the middle plane between the two vortices of the pair. At infinity, the basic flow is from left to right.
kz = 4.75 corresponds to the first growth rate maximum for Fh = ∞ in figure 3(a). Without loss of generality and since the instability is not oscillatory, the horizontal components of velocity (ux , uy ) and the vertical vorticity ωz of the eigenmode have been made purely real by multiplication with an appropriate phase factor. With this choice for the phase, the vertical velocity uz is purely imaginary. Since this instability in the homogeneous case has been studied in detail by Billant et al . (1999), we shall keep our remarks as brief as possible and only recall its main characteristics. The perturbation velocity field (figure 4b, d) verifies the symmetry (4.2), meaning that this mode is antisymmetric. The vertical vorticity contour map consists of a dipole perturbation nested in each vortex core of the pair (figure 4a). Note that the vertical vorticity ωz is zero outside the circle r = 1 because the basic state (2.3) is potential for r > and perturbations should remain potential there in the inviscid limit. Such a structure corresponds to azimuthal wavenumber m = ±1 with one radial node within each vortex core. If this perturbation were superposed with a finite amplitude to the basic state, it would be seen that this instability distorts the inner part of each vortex of the pair: the inner core of the upper vortex being shifted up and to the left while the lower one is shifted up and to the right. The outer vortex parts are moving in the opposite directions. This instability manifests itself, therefore, by an antisymmetric bending of the vortex cores of the pair. As first shown experimentally by Thomas & Auerbach (1994) and Leweke & Williamson (1998), this instability is characteristic of an elliptic instability (Widnall, Bliss & Tsai 1974; Moore & Saffman 1975; Tsai & Widnall 1976; Pierrehumbert 1986; Baily 1986; Waleffe 1989) of each vortex of the pair. In the present case of the Lamb–Chaplygin vortex pair, Billant et al . (1999) have given further evidence demonstrating its relation to the elliptic instability. Moreover, a similar mode but with the opposite symmetry is also unstable (Billant et al . 1999). However, its growth rate is always lower than the antisymmetric one explaining why it does not appear in the present computations where no symmetry has been imposed on the perturbation. In Billant et al . (1999), it has been shown also that the second
Three-dimensional stability of a vertical vortex pair in a stratified fluid (a) ωz
(b) ux
(c) uy
(d) uz
77
Figure 5. As in figure 4 except Fh = 0.05, kz = 12 and {Re = 1000, Sc = 1}. As in figure 4, the same contour interval has been used for each velocity component. The contour interval for ωz is 10 times larger than the one for the velocity components.
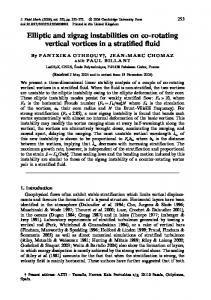
maximum in the growth rate curve for Fh = ∞ (figures 1a and 3a) is related to the apparition of a second elliptic eigenmode still made of azimuthal wavenumbers m = ±1 but with two radial node lines inside each vortex of the pair instead of one. This increase in the complexity of the radial structure as kz increases is typical of the elliptic instability of confined vortex (Moore & Saffman 1975; Tsai & Widnall 1976; Robinson & Saffman 1984). 4.4. Eigenmode in the zigzag instability region The spatial structure of the mode in the zigzag region for Fh = 0.05 and {Re = 1000, Sc = 1} at the most amplified wavenumber kz = kz max = 12 (figure 3b), is displayed in figure 5. This mode is again antisymmetric since its velocity field verifies the symmetry (4.2). However, its spatial structure differs from the elliptic mode (figure 4). The vertical vorticity ωz (figure 5a) consists of an oblong central negative perturbation slightly shifted towards the front of the dipole and accompanied with two regions of positive vertical vorticity on each side. If this perturbation were added to the basic flow, it would be seen that this instability translates the whole vortex pair in the negative y-direction and slightly rotates it anticlockwise. Conversely, if the sign of the perturbation is reversed (i.e. half a wavelength away in the vertical direction), the vortex pair is translated in the positive y-direction and rotated clockwise. Unlike the elliptic mode, this instability mode hardly distorts the internal structure of the two-dimensional dipole. Therefore, in contrast with the elliptic instability which bends each inner vortex core in the opposite direction to its outer part, the zigzag instability bends and twists the vortex pair as a whole. This behaviour agrees qualitatively with the experimental observations of the zigzag instability (part 1). A further striking difference with figure 4 is that the magnitude of the vertical velocity (figure 5d) is very small compared to those of the horizontal velocity components (figures 5b and 5c). In order to highlight this feature, the same contour interval has been used for each velocity component in both figures 4 and 5. In § 5, it will be shown that the characteristics of the zigzag mode correspond precisely to the analytical predictions of part 2.
78
P. Billant and J.-M. Chomaz (a) Fh = 0.033
(b) 0.1
(c) 0.15
(d) 0.2
(e) 0.25
( f ) 0.33
Figure 6. Transition from zigzag to elliptic instability at the vertical wavenumber of maximum growth kz max for increasing Froude numbers for {Re = 1000, Sc = 1}: contours of vertical vorticity in the horizontal plane. (a) Fh = 0.033, kz max = 15; (b) Fh = 0.1, kz max = 6.5; (c) Fh = 0.15, kz max = 4; (d) Fh = 0.2, kz max = 3; (e) Fh = 0.25, kz max = 3; (f) Fh = 0.33, kz max = 3.75. For other details see the legend of figure 4.
4.5. Transition from the elliptic to the zigzag instability as Fh is varied We next turn our attention to the evolution of the most unstable mode when the Froude number is varied in order to characterize the transition between the two different eigenmodes described previously. For brevity, only the spatial distribution of the vertical vorticity component will be presented and discussed. Figure 6 shows the vertical vorticity at the wavenumber of maximum amplification for increasing Froude numbers in the range [0.033, 0.33]. At low Froude numbers, Fh 6 0.2 (figure 6a, c), these contour maps are all very similar to figure 5(a) where the zigzag mode for Fh = 0.05 was presented. However, as Fh is increased, a dipole perturbation gradually forms on each side of the oblong central perturbation. Between Fh = 0.2 and Fh = 0.25 (figure 6d, e), these dipoles abruptly strengthen. Then, for Fh = 0.33 (figure 6f), the oblong central perturbation is considerably weakened. At this Froude number the eigenmode has almost attained the spatial distribution observed for Fh = ∞ (figure 4a). Besides these topological modifications, the main change when the Froude number is varied concerns the magnitude of the perturbation vertical velocity uz and density u2z /(¯ u2x + ¯ u2y ))1/2 and (¯ ρ02 /(¯ u2x + ¯ u2y ))1/2 ρ0 . This is illustrated in figure 7 where the ratios (¯ of the fastest growing disturbance have been plotted as a function of the inverse of the Froude number for all the sets of Reynolds–Schmidt numbers investigated. For Fh 6 0.2, the main feature is that the vertical velocity vanishes linearly as Fh → 0 (a fit by the function 2(1/Fh )−1 is shown by a solid line in figure 7a) whereas the density perturbation is approximately proportional to the inverse of the Froude number (a fit by 0.44/Fh is indicated by a solid line in figure 7b). Differences between the three sets of Reynolds–Schmidt numbers are hardly distinguishable even for the lowest Reynolds number. Only the rightmost point for {Re = 1000, Sc = 1} differs significantly in figure 7(b). This difference in the density perturbation amplitude for Fh = 0.033 is entirely attributable to the fact that the most amplified wavenumber kz max = 15 for Re = 1000 is lower than in the nearly inviscid case Re = 10 000 where
Three-dimensional stability of a vertical vortex pair in a stratified fluid Elliptic Zigzag (a)
79
0.8 0.6
0u + u 1 2 x
u2z
1/2
2 y
0.4 0.2 0
(b)
14 12 10
0 1 qh2
ux2 + uy2
1/2
8 6 4 2 0
5
10
15
20
25
30
1/Fh Figure 7. (a) Ratios of root-mean-square perturbation vertical velocity to root-mean-square u2x + ¯ u2y ))1/2 and (b) root-mean-square density perturbation perturbation horizontal velocity (¯ u2z /(¯ to root-mean-square perturbation horizontal velocity (¯ ρ02 /(¯ u2x + ¯ u2y ))1/2 as a function of the inverse Froude number for the wavenumber corresponding to the fastest growing disturbance. , {Re = 10 000, Sc = 1}; �, {Re = 1000, Sc = 1}; , {Re = 200, Sc = 637}. The solid lines fit the points for {Re = 10 000, Sc = 1} and Fh 6 0.25. The fitting functions √ are 2Fh in (a) and 0.44/Fh in (b). The horizontal dashed line in (a) marks the isotropy value 1/ 2. The dashed curve in (b) fits the points for {Re = 10 000, Sc = 1} and Fh > 0.33. The fitting function is 0.19Fh−2 .
�
◦
kz max = 21 (figure 2a). Indeed, if the density perturbation for Re = 1000 is taken at the wavenumber kz max = 21, the difference between the Re = 1000 and Re = 10 000 curves for Fh = 0.033 is suppressed. In § 5.2, we shall show that the scalings u2x + ¯ u2y ))1/2 ∝ Fh and (¯ ρ02 /(¯ u2x + ¯ u2y ))1/2 ∝ 1/Fh for Fh 6 0.2 are fully consistent (¯ u2z /(¯ with the asymptotic analysis of part 2. For Fh > 0.2, the two preceding scaling laws break down. An abrupt transition occurs near Fh = 0.25 when approximate isotropy between the vertical component of velocity and the horizontal ones is achieved, √ u2x + ¯ u2y ))1/2 ≈ 0.7 ≈ 1/ 2 (this value is indicated by a dashed dotted line in (¯ u2z /(¯ figure 7a). When Fh is increased above 0.25, the latter ratio remains close to the isotropy value whereas the density perturbation goes to zero like Fh−2 as shown by the dashed curve in figure 7(b). A striking feature is that the transition between the two instability modes occurs continuously as seen by the gradual change of the eigenmode (figure 6). In addition, the wavenumber of maximum amplification varies continuously, without any jump (figure 2a). There is therefore a short range of Froude numbers Fh ≈ 0.2–0.25 where the instability is of mixed type. In this transition scenario, it is worth pointing out that there is no coexistence and competition between two types of instability, one being most unstable for low Froude numbers and the other one for high Froude numbers. It is rather a complete metamorphosis of the nature of a single instability when the Froude number is varied. A feature confirming this view is that two extrema are not seen in the growth rate curves near the transition for Fhc = 0.2–0.25 (figure 1a, b), as one would expect if two instabilities with distinct preferred vertical wavenumbers
80
P. Billant and J.-M. Chomaz (a) Fh = 0.15
(b) 0.2
(c) 0.25
(d) 0.33
Figure 8. Transition from zigzag to elliptic instability at low vertical wavenumbers having the same growth rate σ = 0.417 ± 0.021 for {Re = 1000, Sc = 1}: contours of real vertical vorticity in the horizontal plane: (a) Fh = 0.15, kz = 2.33; (b) Fh = 0.2, kz = 1.75; (c) Fh = 0.25, kz = 1.5; (d) Fh = 0.33, kz = 2. Like in figure 6, a transition from the zigzag mode at Fh = 0.15 (a) to the elliptic mode at Fh = 0.33 (d) can be seen. For other details, refer to the legend of figure 4.
were competing. This idea is also strongly reinforced by the fact that all wavenumbers seem to be affected by the change in spatial topology of the eigenmode around the same Froude number values Fhc = 0.2–0.25, as demonstrated by figure 8. Like figure 6, this figure shows the vertical vorticity contour maps as a function of Fh around the critical value but now at wavenumbers lower than kz max and corresponding to the same growth rate (σ ≈ 0.42). We see that the vertical vorticity for Fh = 0.33 (figure 8d) and higher (not shown) are of the elliptic type whereas for Fh = 0.15 (figure 8a) and lower (not shown), the instability mode is of the zigzag type. The modes for Fh = 0.2 (figure 8b) and Fh = 0.25 (figure 8c) are mixed modes corresponding to the continuous transition between the zigzag and elliptic instabilities. A transition around Fhc = 0.2–0.25 could be identified also by looking at the eigenmodes at high wavenumbers (not shown). As shown in part 1, this transitional range Fhc = 0.2–0.25 for the disappearance of the elliptic instability can be accounted for by the study of Miyazaki & Fukumoto (1992) on the influence of stratification on the elliptic instability. For an infinite vortex with uniform vorticity, these authors have shown that the elliptic instability is suppressed by the stratification when N > (γ 2 − �2 )1/2 , where 2γ is the vorticity and � the strain rate. The physical explanation of Miyazaki & Fukumoto (1992) for this criterion is summarized in part 1. Although the vortices of the Lamb–Chaplygin dipole are of finite size and have non-uniform vorticity, this criterion can be crudely applied by estimating the local vorticity and strain rate at the vortex centres. An expansion of the basic streamfunction (2.3) near one vortex centre yields γ = 5.06U/R and � = 2.28U/R (part 1). Thus, the threshold N = (γ 2 − �2 )1/2 becomes, in terms of the horizontal Froude number, Fh = 0.22. This value is within the Froude number range at which the transition from elliptic to zigzag instabilities occurs herein, 0.2 < Fh < 0.25. Furthermore, the critical value Fh = 0.22 is a non-diffusive threshold and therefore independent of the Reynolds and Schmidt numbers. This explains why the transition occurs at the same Froude numbers for the three sets of Reynolds–Schmidt numbers since they are all relatively large. At this stage, we have drawn a global picture of the instability characteristics
Three-dimensional stability of a vertical vortex pair in a stratified fluid
81
of the vortex pair as the Froude number is varied. Two distinct instability modes, both antisymmetric, prevail above and below the transitional Froude number range Fhc = 0.2–0.25. For Fh > 0.25, the instability is related to the elliptic instability and consists of an antisymmetric bending of the inner vortex cores which distort the horizontal structure of the basic state. For Fh 6 0.2, on the other hand, the instability produces almost no deformation of the horizontal structure of the dipole. Rather, the vortex pair as a whole is bent and twisted periodically along the vertical direction. The perturbation vertical velocity is small and scales approximately as Fh , while the density perturbation scales as 1/Fh . A prominent feature of this instability is that the most amplified wavenumber is inversely proportional to the Froude number whereas the maximal growth rate remains constant for large Reynolds number. In the next section, we shall show that this instability corresponds to the zigzag instability uncovered in parts 1 and 2.
5. Comparison with theoretical results The goal of this section is to compare the present numerical computations to the asymptotic calculations of part 2. In part 2, we have demonstrated for small Froude numbers and in the inviscid limit the existence of a long-wavelength phase instability related to the breaking of translational and rotational invariances. A key assumption of this analysis is that the horizontal dipole structure is only weakly perturbed so that one can describe the vortex pair by ‘macroscopic’ or phase variables such as location and orientation of the dipole in the horizontal plane. In the case of the zigzag instability, it turns out that the relevant phase variables are η, the y-coordinate of the dipole along the axis perpendicular to the initial travelling direction and φ, the angle of propagation. Considering further that η and φ vary slowly with the vertical coordinate and with time, and that η, φ � 1, we found by a multiple-scale perturbation analysis for small Froude number and small wavenumber that η and φ are related by ∂η = φ, (5.1) ∂t ∂2 η ∂4 η ∂φ = (D + Fh2 g1 )Fh2 2 + g2 Fh4 4 , (5.2) ∂t ∂z ∂z up to the fourth order in Fh and ∂/∂z. The coefficients D = −3.67, g1 = −56.4, g2 = −16.1 have been exactly calculated from solvability conditions using the Lamb– Chaplygin dipole as the basic state. When η and φ are independent of the vertical coordinate z, the structure of the equations (5.1)–(5.2) is an immediate consequence of the invariance group. If the dipole propagation direction is turned by an angle φ from the x-axis, then, to first order in φ, the dipole moves along the y-axis at the speed φ (the propagating velocity of the dipole is normalized to one). The phase η thus increases linearly with time. In contrast, the phase φ remains constant by virtue of momentum conservation. The vertical derivative terms in (5.2) describe weak three-dimensional effects. Inserting three-dimensional disturbances of the form (η, φ) ∝ exp(σt + ikz z) yields the dispersion relation σ 2 = −DFh2 kz2 + g2 Fh4 kz4 − g1 Fh4 kz2 ,
(5.3)
which is an expansion for small Froude number and small wavenumber of the exact dispersion relation. This dispersion relation indicates that small wavenumbers are
82
P. Billant and J.-M. Chomaz 0.8 0.7 0.6 0.5
r
0.4 0.3 Fh = 0.2 Fh = 0.15 Fh = 0.1 Fh = 0.05 Fh = 0.033
0.2 0.1 0
0.5
1.0
1.5
Fhkz Figure 9. Growth rate σ as a function of Fh kz for {Re = 10 000, Sc = 1}: ∗, Fh = 0.033; +, Fh = 0.05; , Fh = 0.1; �, Fh = 0.15; , Fh = 0.2.
�
◦
always unstable since D and g1 are negative. At large wavenumbers, the second term in the right-hand side of (5.3) is stabilizing because g2 is negative. The first two terms in the right-hand side of (5.3) are of the form (Fh kz )m indicating that the most amplified wavenumber scales approximately as kz max ∝ 1/Fh since the third term is negligible for Fh � 1. Although this wavenumber is out of the validity range of the long-wavelength assumption, kz � 1/Fh , this observation led us to realize that if we had carried out the expansion for an infinite number of terms, it would still be possible to express the growth rate in the form σ 2 = f0 (Fh kz ) + Fh2 f2 (Fh kz ) + Fh4 f4 (Fh kz ) + . . . ,
(5.4)
where the fi terms are functions expressed as series of Fh kz . The first two terms on the right-hand side of (5.3) correspond to the first two terms of the expansion for small Fh kz of the function f0 in (5.4). The third term on the right-hand side of (5.3) comes from the first term of the expansion of f2 in (5.4). 5.1. Dispersion relation The generalized dispersion relation (5.4) indicates that the√growth rate should be a function of the single variable Fh kz when Fh → 0, i.e. σ ≈ f0 (Fh kz ). This feature of the inviscid theoretical analysis is already consistent with figures 2(a) and 2(b) where it was clearly seen that, for the high-Reynolds-number case {Re = 10 000, Sc = 1}, the wavenumber kz max of the fastest growing perturbation is inversely proportional to the Froude number (figure 2a) whereas its growth rate σmax is independent of the Froude number (figure 2b). To test the self-similarity in a general way, the growth rate curves of figure 1(b) for Fh 6 0.2 and the highest Reynolds number investigated {Re = 10 000, Sc = 1} have been redrawn as a function of Fh kz in figure 9. It can be seen that the collapse of the curves is satisfactory. The slight variations seen in figure 9 for Fh = 0.15 and Fh = 0.2 are thought to be mainly due to the O(Fh2 ) term in (5.4). The slight departure of the Fh = 0.033 curve is mainly attributable to viscous diffusion since the maximum growth rate occurs at large wavenumber kz max = 21 for such small Froude numbers. Indeed, at the most amplified wavenumber, viscous damping due to vertical shearing is about kz2 max /Re = 0.044 while it is 0.017 for Fh = 0.05. Therefore, this difference in viscous damping accounts for the approximate difference of 0.03 in growth rate between the Fh = 0.033 and Fh = 0.05 curves in figure 9. The theory predicts more than the qualitative scaling law since it provides the
Three-dimensional stability of a vertical vortex pair in a stratified fluid 0.8 0.7
0.05
0.1
Fh = 0.15
83
0.033
0.6 0.5
r
0.4 0.3 0.2 0.1 0.1 0
5
0.05 10
0.033 15
20
25
30
kz Figure 10. Comparison between the analytical growth rate given by the long-wavelength dispersion relation (5.3) (solid lines) and numerical growth rates for {Re = 100 000, Sc = 1}. ∗, Fh = 0.033; +, Fh = 0.05; , Fh = 0.1; �, Fh = 0.15. The growth rate for Fh = 0.05 and higher Reynolds number {Re = 100 000, Sc = 1} is also shown by a bold line with +. Note that the theoretical prediction was expected to be valid only for infinitely small wavenumbers. Yet, the analytical growth rate is, in practice, correct for kz 6 0.3/Fh .
�
quantitative long-wavelength approximation (5.3) of the dispersion relation. Figure 10 shows a comparison between the analytical growth rates given by (5.3) and the numerically calculated growth rates of the zigzag instability for Fh 6 0.15. It is seen that the asymptotic growth rates (5.3) (for which all the coefficients have been computed exactly in part 2) match the numerical growth rates for small values of kz . As expected, the approximation of the growth rate (5.3) is no longer valid for large Froude numbers and wavenumbers (in practice when kz > 0.3/Fh as seen in figure 10) because our asymptotic formulation is restricted to long-wavelength disturbances and small Froude numbers and because only the first terms of the expansion have been computed. The variations of the slopes at the origin with the Froude number is well predicted even for finite Froude number. A slight difference between the slopes at the origin apparently exists but we believe that this is due to the finite Reynolds number Re = 10 000 investigated. To check this, the Reynolds number has been further increased to Re = 100 000 for Fh = 0.05 (bold line with + in figure 10) and it is seen that the numerically calculated growth rates tend toward the theoretical ones. The viscosity continues to have an effect even at high Reynolds number presumably because of the presence of a strong gradient at r = 1 in the eigenmode vorticity (even discontinuity as kz → 0 and Re → ∞ as shown in part 2). 5.2. Zigzag eigenfunction We now compare quantitatively the spatial distribution of the numerically computed eigenmodes with those obtained asymptotically in part 2 for small Froude numbers and small vertical wavenumbers. Figure 11 shows a full comparison between the asymptotic and numerical eigenmodes for Fh = 0.033, kz = 8.25 and {Re = 10 000, Sc = 1}. The analytical velocity, density and vertical vorticity perturbation fields are given at second order in Fh kz by � � √ ∂uh0 ∂ (5.5) + Fh kz −D∇ × (ψ0 + y)ez , uh = ∂y ∂θ
84
P. Billant and J.-M. Chomaz (a) ux
(b) ux
(c) uy
(d) uy
(e) uz
( f ) uz
(g) ρ′
(h) ρ′
(i) ωz
( j) ωz
Figure 11. Comparison between the numerical (left-hand panels) and theoretical (right-hand panels) eigenmodes given by (5.5)–(5.7) for Fh = 0.033, kz = 8.25 and {Re = 10 000, Sc = 1}. (a, b) ux ; (c, d) uy ; (e, f) uz ; (g, h) ρ0 ; (i, j) ωz . The contour interval is not the same for each variable but is identical for the theoretical and numerical contour maps: 0.725 for ux , 0.34 for uy , 0.0238 for uz , 4.47 for ρ0 and 3.32 for ωz . Only a domain of size 5 × 5 is represented while the original computational domain is 9 × 9. For other details refer to the legend of figure 4.
uz =
−ikz Fh2
�� � � � � � � √ ∂P0 ∂P0 ∂P0 , uh0 − Fh kz −D ∇h · uh0 − ∇h · ∂y ∂θ ∂y � � √ ∂P0 ∂P0 0 − kz Fh −D , ρ = −ikz ∂y ∂θ
(5.6) (5.7)
Three-dimensional stability of a vertical vortex pair in a stratified fluid 85 √ ∂∆ψ0 ∂∆ψ0 − Fh kz −D , (5.8) ωz = ∂y ∂θ where uh0 is the horizontal velocity of the basic state and P0 the associated pressure. The first terms in the expressions of the horizontal velocity (5.5) and vertical vorticity perturbations (5.8) correspond to the phase mode related to the translational invariance in the y-direction. The second term in (5.5) and in (5.8) is the phase mode deriving from the rotational invariance. The expressions (5.6) and (5.7) for the vertical velocity uz and density ρ0 have been calculated in part 2 from the vertical momentum and density equations. The agreement between the analytical eigenmode and the numerically computed one is near perfect (figure 11). We stress that strictly the same contour interval has been taken for the numerical and theoretical contour maps. Thus, not only the spatial structure of the eigenmodes but also the relative amplitude of each variable are in excellent agreement. Note that the theoretical prediction is derived without any adjustable parameter. The leading-order terms in the expansions (5.5)–(5.8) provide the main characteristics of the eigenmode shape. These terms are all either symmetric or antisymmetric in x. The second terms in the expansions (5.5)–(5.8) are responsible for the slight breaking of the symmetry in x noticeable in figure 11. Of course, all terms in (5.5)–(5.8) are either odd or even in y so that the symmetry (4.2) is indeed satisfied. Of further interest is the evolution of the eigenmode topology as kz is increased. For this purpose, figure 12 shows a comparison between the numerical and theoretical vertical vorticity contour maps for Fh = 0.1 and {Re = 1000, Sc = 1} and increasing vertical wavenumbers. In contrast with the previous expression of the analytical vertical vorticity (5.8), corrections up to the third order in Froude number have been taken into account √ ∂∆ψ0 ∂∆ψ0 − Fh kz −D + Fh2 kz2 ∆Ψ2 . (5.9) ωz = ∂y ∂θ The additional term involving the streamfunction Ψ2 is a third-order correction that has been calculated in part 2. This term has no simple physical interpretation, unlike the first two terms of the expansion (5.9). The theoretical and numerical vertical vorticity contour maps shown in figure 12 agree well. The evolution of the eigenmode structure, in particular the apparition of negative regions on each side of the shaded central part, as kz is increased, is predicted correctly by the theory. This is entirely due to the third-order correction ∆Ψ2 in (5.9) which becomes increasingly important at large wavenumbers. This agreement is remarkable since the asymptotic analysis was not expected to be valid for such large wavenumbers. Furthermore, the analytical eigenmode continues to be a good approximation for wavenumbers beyond the domain of validity kz 6 3 of the long-wavelength dispersion relation (5.3). When kz is increased, the breaking of the symmetry x → −x becomes more apparent in figure 12. Since Ψ2 is even in x like the first term on the right-hand side of (5.9), this symmetry breaking is solely due to the rotational neutral mode (second term in (5.9)). u2x + ¯ u2y ))1/2 and (¯ ρ02 /(¯ u2x + ¯ u2y ))1/2 Finally, we show that the scaling of the ratios (¯ u2z /(¯ with Fh at the most amplified wavenumber kz max displayed on figure 7 for Fh 6 0.2 is in full agreement with those expected from the first order of the expansion (5.5)– (5.7). At first order, the vertical velocity, density perturbation and horizontal velocity scale like uz = O(kz Fh2 ), ρ0 = O(kz ) and uh = O(1), respectively. Therefore, at the wavenumber kz = kz max ∝ 1/Fh , it is predicted that (¯ u2z /(¯ u2x + ¯ u2y ))1/2 = O(Fh ) and 02 2 2 1/2 ux + ¯ uy )) = O(1/Fh ) as it was indeed observed in figure 7. (¯ ρ /(¯ In conclusion, the numerical analysis has recovered the qualitative and quantitative characteristics of the zigzag instability predicted analytically in part 2 for small Froude
86
P. Billant and J.-M. Chomaz (a) kz = 4
(e) 4
(b) 6
(f)6
(c) 7
(g) 7
(d) 8.5
(h) 8.5�
Figure 12. Comparison between the numerical (left-hand side a–d) and theoretical (right-hand side e–h) vertical vorticity given by (5.9) for Fh = 0.1 and {Re = 1000, Sc = 1} for increasing vertical wavenumbers. (a, e) kz = 4; (b, f) kz = 6; (c, g) kz = 7; (d, h) kz = 8.5. For other details refer to the legend of figure 4. The theoretical prediction is satisfactory even at large wavenumbers although it was expected to be valid only for infinitely small wavenumbers.
and wavenumbers. Qualitatively, the growth rate is self-similar with respect to Fh kz for Fh 6 0.2. Quantitatively, the asymptotic formulation continues to provide a good approximation of the growth rate as well as the eigenmode for finite Froude numbers, Fh 6 0.2, and finite wavenumbers, kz 6 0.3/Fh .
6. Comparison with experimental results In figure 13, the wavelength of the zigzag instability measured in the experimental study (part 1) is compared with the most amplified wavelength calculated for {Re = 1000, Sc = 1} and {Re = 200, Sc = 637}. Each experimental point represents the mean wavelength of the zigzag instability measured in one experiment as a function of the Froude number Fh0 , based on the initial propagating velocity U0 of the vortex pair. The error bars give the minimum and maximum wavelengths participating in the mean.
Three-dimensional stability of a vertical vortex pair in a stratified fluid Zigzag
87
Elliptic
3
2
k˜ R 1
0 0.05
0.10
0.15
0.20
0.25
0.30
0.35
Fh0 Figure 13. Comparison between the experimental wavelength and the most amplified wavelength as a function of the Froude number. The wavelength ˜ λ is non-dimensionalized by the radius R of the dipole. For the experimental points, the Froude number Fh0 = U0 /NR is based on the initial propagating velocity U0 of the vortex pair. N, numerical study {Re = 1000, Sc = 1}; , numerical study {Re = 200, Sc = 637}; �, experiments, N = 1.75 rad s−1 ; , experiments, N = 1.70 rad s−1 ; �, forced experiment, N = 1.75 rad s−1 . The vertical dotted lines indicate the domains where the zigzag instability is observed in the experiment. The vertical dashed line represents the critical Froude number, Fh = 0.22, of inhibition of the elliptic instability derived from the criterion of Miyazaki & Fukumoto (1992). The regimes labelled Elliptic and Zigzag indicate the regions where the instability is of elliptic type and of zigzag type in the stability analysis. Each experimental point represents the mean wavelength measured in one experiment. The errors bars indicate the minimum and maximum wavelengths participating in the mean.
◦
•
Despite the fact that the wavelength does not significantly vary with the Froude number in the experiments, there is quite good agreement with the numerically calculated most amplified wavelength. In contrast with the numerical study, the Reynolds and Froude numbers vary together in the experiments according to Re0 = (R 2 N/ν)Fh0 because the main control parameter which is varied is the propagating velocity U0 . The Reynolds number thus decreases approximately from Re0 = 400 to Re0 = 250 when the Froude number is decreased from Fh0 = 0.21 to Fh0 = 0.13 in figure 13. However, as far as the wavelength is concerned, this difference in Reynolds number is not critical for the comparison since the numerical study has shown that the most amplified wavelength does not depend on the Reynolds number. The same is true for the Froude-number threshold between zigzag and elliptic instabilities and there is a good agreement between the experiments and numerics (figure 13). In the experiments, the elliptic instability develops above Fh = 0.21. Subsequently, the resulting three-dimensional motions are observed to collapse. This distinct behaviour has allowed us to determine a well-defined critical Froude number between elliptic and zigzag instabilities. For the linear stability analysis, the value Fh = 0.22 obtained from the criterion of Miyazaki & Fukumoto (1992) in § 4.5 has been indicated as the threshold. However, it should be born in mind that the threshold is not precisely located in the linear stability analysis since the transition is continuous in the range 0.2 < Fh < 0.25, as discussed in § 4.5. For a more precise comparison with experiments, a full nonlinear simulation would be necessary to determine the Froude number above which a gravitational collapse of the elliptic instability occurs.
88
P. Billant and J.-M. Chomaz 0.6 0.5 0.4
ó˜R U
0.3 0.2 0.1 0 0.06
0.08
0.10
0.12
0.14
0.16
0.18
Fh Figure 14. Comparison of the experimental growth rate with the maximum growth rate calculated for {Re = 200, Sc = 637} as a function of the Froude number. For the experimental points, ˜ is non-dimensionalized by U(tb )/R, where U(tb ) is the propagating velocity of the growth rate σ the vortex pair measured at the time tb where the zigzag instability becomes visible. The Froude number Fh = U(tb )/NR is also based on this velocity. The approximate experimental error bar is shown on one point. , numerical study {Re = 200, Sc = 637}; �, experiments, N = 1.75 rad s−1 ; , experiments, N = 1.70 rad s−1 ; �, forced experiment, N = 1.75 rad s−1 .
◦
•
In contrast, the zigzag instability is observed to be stabilized at low Froude number Fh < 0.13 in the experiments, while such a stabilisation occurs for Fh < 0.06 in the stability analysis for {Re = 200, Sc = 637}. The explanation for this difference lies in the fact that the viscous diffusion of the basic state has been omitted in the numerical analysis. In the experiments, the zigzag deformations begin to be visible only at tb ≈ 35–50 s after the creation of the vortex pair so that the basic state has significantly slowed down by viscous diffusion. When this damping is taken into account, both thresholds agree, as shown in figure 14 where the experimental and numerical growth rates are compared. In this plot, the experimental growth rate scaled by U(tb )/R is represented as a function of the effective Froude number Fh = U(tb )/NR, where U(tb ) is the velocity at the time tb where the growth rate of the zigzag instability is measured. The corresponding Reynolds number now varies from Re = 110 to Re = 310, so that the experimental growth rate can be reasonably compared to the {Re = 200, Sc = 637} numerical case. As seen in figure 14, there is good agreement between the experimental and numerical growth rates. In both cases, the growth rate decreases to zero for Fh ≈ 0.05–0.06. Therefore, when the viscous diffusion of the basic state is taken into account in the experiments, the zigzag instability is stabilized around the same Froude number as predicted by the stability analysis.
7. Summary and conclusions In this paper, we have investigated the three-dimensional stability of a columnar vertical vortex pair in a stratified fluid. This flow is a convenient experimental and theoretical model for understanding the generic phenomenon of layering observed in strongly stratified flows. The present numerical study follows experimental and theoretical investigations on the dynamics of a columnar vertical vortex pair in which a new three-dimensional instability, called zigzag instability, has been observed and described at small Froude numbers (parts 1 and 2). Experimentally, this instability is observed to eventually slice the columnar vortex pair into thin horizontal layers of individual pancake dipoles.
Three-dimensional stability of a vertical vortex pair in a stratified fluid
89
Such an instability is different from the three-dimensional instabilities observed in homogeneous fluids. The theoretical study has shown that the zigzag instability is related to the breaking of translational and rotational invariances. In agreement with experimental observations, the analytical zigzag eigenmode generates sinusoidal deformations along the vertical which consist of a translation in the direction perpendicular to the dipole travelling direction associated with a slight rotation of the vortex pair. This theoretical approach has predicted that the growth rate should be self-similar with respect to the variable Fh kz implying the intriguing and important feature that the most amplified dimensional wavelength should be proportional to U/N. Because of the dominance of viscous effects in the low-Froude-number regime, it was not possible to definitely validate this scaling law in the experiments. One goal of the present numerical study was therefore to confirm the asymptotic analysis and the associated scaling law. The most unstable modes have been determined as a function of the vertical wavenumber for nine Froude-number values covering the range [0.033, ∞] and three sets of Reynolds–Schmidt numbers {Re = 10 000, Sc = 1}, {Re = 1000, Sc = 1}, {Re = 200, Sc = 637}. We have shown that the parameter space can be divided into two domains depending solely on the Froude-number value. For Fh > 0.25, the most unstable mode is due to an elliptic instability (Billant et al . 1999) whereas the zigzag instability is dominant for Fh 6 0.2. For Fh > 0.25, stratification effects are stabilizing. The growth rate of the elliptic instability is reduced compared to the unstratified case. The transition between the elliptic and zigzag instabilities occurs continuously in a short Froude-number range [0.2, 0.25]. The two instabilities never coexist, rather, there is a metamorphosis of one instability into the other in the vicinity of Fhc = 0.2–0.25. In the transitional region, the instability is therefore of a mixed type. The transitional Froude-number values, Fhc = 0.2–0.25, are in good agreement with the critical Froude number Fh = 0.22 derived from the criterion of Miyazaki & Fukumoto (1992) for the suppression of the elliptic instability. For Fh 6 0.2, the most amplified wavenumber varies as 1/Fh whereas the maximum growth rate is independent of the Froude number for Reynolds and Schmidt numbers {Re = 10 000, Sc = 1} approaching the non-dissipative limit. The corresponding perturbation vertical velocity and density scale approximately as Fh and 1/Fh , respectively. More generally, the growth rate of the zigzag instability is self-similar with respect to the variable Fh kz , as predicted in the theoretical analysis. The present numerical investigation thus fully confirms and validates the qualitative prediction of the inviscid theoretical analysis. Quantitatively, the asymptotic formulation has proved successful in predicting the characteristics of the zigzag instability. The comparisons of the analytical dispersion relation and spatial eigenmode with those numerically computed are very good in a surprisingly large Froude number and wavenumber range although the asymptotic formulation assumed Fh � 1 and kz � 1/Fh . Viscous and molecular diffusions alter the self-similarity for the lower Reynolds and Schmidt numbers investigated: (Re = 1000, Sc = 1) and (Re = 200, Sc = 637). As the Froude number is lowered, viscous and diffusive effects become increasingly important owing to the shift of the growth rate curves towards high vertical wavenumbers. A low cutoff Froude number therefore exists. Comparisons with experiments are also satisfactory. The wavelength measured experimentally and the threshold between elliptic and zigzag instabilities agree with those calculated numerically. Therefore, the numerical analysis succeeds in filling the gap between experiment and theory.
90
P. Billant and J.-M. Chomaz
We have shown experimentally, theoretically and numerically that an instability can be the mechanism responsible for the vertical decoupling of a strongly stratified flow which was initially vertically uniform. In the inviscid limit, the selected dimensional wavelength is proportional to U/N and is very small compared to the horizontal lengthscale of the flow. This scaling law indicates that the wavelength becomes thinner and thinner as the mean density gradient is increased until viscous and molecular diffusions come into play. Since the instability is observed not to saturate experimentally and to produce layers with a thickness equal to the initial instability wavelength, the layer thickness will also vary as U/N. We believe that such a type of instability and scaling law λ ∝ U/N is not specific of the vortex pair case but will affect most flows as soon as they contain several tall interacting vertical vortices. Applied to strongly stratified turbulence, this instability mechanism transfers energy from large vertical scales directly to the small scale U/N without any cascade process. Such a thin layering contradicts the hypothesis underlying the scaling analysis of Riley et al . (1981) and Lilly (1983) where it is postulated that the vertical Froude number Fv = U/(NLv ) is small, whereas here, Fv = O(1). Scaling the equations of motion by taking U/N as the appropriate vertical lengthscale indicates that strongly stratified flows are not governed by two-dimensional Euler equations in each horizontal layer. We wish to thank Pierre Brancher who made the numerical code available and Olivier Eiff for his careful reading of the manuscript. REFERENCES Baily, B. J. 1986 Three-dimensional instability of elliptical flow. Phys. Rev. Lett. 57, 2160–2163. Batchelor, G. K. 1967 An Introduction to Fluid Dynamics. Cambridge University Press. Billant, P. Brancher, P. & Chomaz, J.-M. 1999 Three-dimensional stability of a vortex pair. Phys. Fluids 11, 2069–2077. Billant, P. & Chomaz, J.-M. 2000a Experimental evidence for a new instability of a vertical columnar vortex pair in a strongly stratified fluid. J. Fluid Mech. 418, 167–188 (referred to herein as part 1). Billant, P. & Chomaz, J.-M. 2000b Theoretical analysis of the zigzag instability of a vertical columnar vortex pair in a strongly stratified fluid. J. Fluid Mech. 419, 29–63 (referred to herein as part 2). Bonnier, M., Eiff, O. & Bonneton, P. 2000 On the density structure of far wake vortices in a stratified fluid. Dyn. Atmos. Oceans 31, 117–137. ´ ´ Brancher, P. 1996 Etude num´erique des instabilit´es secondaires de jets. PhD thesis, Ecole Polytechnique, France. Brancher, P., Chomaz, J.-M. & Huerre, P. 1994 Direct numerical simulations of round jets: Vortex induction and side jets Phys. Fluids 6, 1768–1774. Browand, F. K., Guyomar, D. & Yoon, S.-C. 1987 The behavior of a turbulent front in a stratified fluid: Experiments with an oscillating grid. J. Geophys. Res. 92, 5329–5341. Chomaz, J. M., Bonneton, P., Butet, A. & Hopfinger, E. J. 1993 Vertical diffusion in the far wake of a sphere moving in a stratified fluid. Phys. Fluids A 5, 2799–2806. Delbende, I., Chomaz, J. M. & Huerre, P. 1998 Absolute/convective instabilities in the Batchelor vortex: A numerical study of the linear impulse response. J. Fluid Mech. 355, 229–254. Drazin, P. G. & Reid, W. H. 1981 Hydrodynamic Stability. Cambridge University Press. Edwards, W. S., Tuckerman, L. S., Friesner, R. A. & Sorensen, D. C. 1994 Krylov methods for the incompressible Navier–Stokes equations. J. Comput. Phys. 110, 82–102. Fincham, A. M., Maxworthy, T. & Spedding, G. R. 1996 Energy dissipation and vortex structure in freely decaying stratified grid turbulence. Dyn. Atmos. Oceans 23, 171–182.
Three-dimensional stability of a vertical vortex pair in a stratified fluid
91
´ J. B. & Heijst, G. J. F. van 1996 Stable and unstable monopolar vortices in a stratified fluid. Flor, J. Fluid Mech. 211, 257–287. Goldhirsch, I., Orszag, S. A. & Maulik, B. K. 1987 An efficient method for computing leading eigenvalues and eigenvectors of large asymmetric matrices. J. Sci. Comput. 2, 33–58. Herring, J. R. & Me´ tais, O. 1989 Numerical simulations in forced stably stratified turbulence. J. Fluid Mech. 202, 97–115. Hopfinger, E. J. 1987 Turbulence in stratified fluids: A review. J. Geophys. Res. 92, 5287–5303. Kimura, Y. & Herring, J. R. 1996 Diffusion in stably stratified turbulence. J. Fluid Mech. 328, 253–269. Lamb, H. 1932 Hydrodynamics. Cambridge University Press. Leweke, T. & Williamson, C. H. K. 1998 Cooperative elliptic instability of a vortex pair. J. Fluid Mech. 360, 85–119. Lilly, D. K. 1983 Stratified turbulence and the mesoscale variability of the atmosphere. J. Atmos. Sci. 40, 749–761. Lin, Q., Lindberg, W. R., Boyer, D. L. & Fernando, H. J. S. 1992 Stratified flow past a sphere. J. Fluid Mech. 240, 315–354. Lin, J. T. & Pao, Y. H. 1979 Wakes in stratified fluids: A review. Ann. Rev. Fluid Mech. 11, 317–338. Mamun, C. K. & Tuckerman, L. S. 1995 Asymmetry and Hopf bifurcation in spherical Couette flow. Phys. Fluids 7, 80–91. Meleshko, V. V. & Heijst, G. J. F. van 1994 On Chaplygin’s investigations of two-dimensional vortex structures in an inviscid fluid. J. Fluid Mech. 272, 157–182. Me´ tais, O. & Herring, J. R. 1989 Numerical simulations of freely evolving turbulence in stably stratified fluids. J. Fluid Mech. 202, 117–148. Miyazaki, T. & Fukumoto, Y. 1992 Three-dimensional instability of strained vortices in a stably stratified fluid. Phys. Fluids A 4, 2515–2522. Moore, D. W. & Saffman, P. G. 1975 The instability of a straight vortex filament in a strain field. Proc. R. Soc. Lond. A 346, 413–425. Pierrehumbert, R. T. 1986 Universal short-wave instability of two-dimensional eddies in an inviscid fluid. Phys. Rev. Lett. 57, 2157–2159. Pierrehumbert, R. T. & Widnall, S. E. 1982 The two- and three-dimensional instabilities of a spatially periodic shear layer. J. Fluid Mech. 114, 59–82. Potylitsin, P. G. & Peltier, W. R. 1998 Stratification effects on the stability of columnar vortices on the f-plane. J. Fluid Mech. 335, 45–79. Riley, J. J., Metcalfe, R. W. & Weissman, M. A. 1981 Direct numerical simulations of homogeneous turbulence in density stratified fluids. In Proc. AIP Conf. Nonlinear Properties of Internal Waves (ed. B. J. West), pp. 79–112. Robinson, A. C. & Saffman, P. G. 1984 Three-dimensional stability of an elliptical vortex in a straining field. J. Fluid Mech. 142, 451–466. Spedding, G. R., Browand, F. K. & Fincham, A. M. 1996 Turbulence, similarity scaling and vortex geometry in the wake of a sphere in a stably-stratified fluid. J. Fluid Mech. 314, 53–103. Spedding, G. R. 1997 The evolution of initially turbulent bluff-body wakes at high internal Froude number. J. Fluid Mech. 337, 283–301. Thomas, P. J. & Auerbach, D. 1994 The observation of the simultaneous development of a longand a short-wave instability mode on a vortex pair. J. Fluid Mech. 265, 289–302. Tsai, C. Y. & Widnall, S. E. 1976 The stability of short waves on a straight vortex filament in a weak externally imposed strain field. J. Fluid Mech. 73, 721–733. Waleffe, F. 1990 On the three-dimensional instability of strained vortices. Phys. Fluids A 2, 76–80. Widnall, S. E., Bliss, D. B. & Tsai, C. Y. 1974 The instability of short waves on a vortex ring. J. Fluid Mech. 66, 35–47.