Nov 24, 2014 - and elementary processes in DSC to uncover the fundamental limits in each ..... signature for hydrogen-bonded monodentate adsorption.38,39.
Research Article www.acsami.org
Precise Identification and Manipulation of Adsorption Geometry of Donor−π−Acceptor Dye on Nanocrystalline TiO2 Films for Improved Photovoltaics Fan Zhang, Wei Ma, Yang Jiao, Jingchuan Wang, Xinyan Shan, Hui Li, Xinghua Lu, and Sheng Meng* Beijing National Laboratory for Condensed Matter Physics, and Institute of Physics, Chinese Academy of Sciences, Beijing, 100190, P. R. China Collaborative Innovation Center of Quantum Matter, Beijing 100190, China S Supporting Information *
ABSTRACT: Adsorption geometry of dye molecules on nanocrystalline TiO2 plays a central role in dye-sensitized solar cells, enabling effective sunlight absorption, fast electron injection, optimized interface band offsets, and stable photovoltaic performance. However, precise determination of dye binding geometry and proportion has been challenging due to complexity and sensitivity at interfaces. Here employing combined vibrational spectrometry and density functional calculations, we identify typical adsorption configurations of widely adopted cyanoacrylic donor-π bridge-acceptor dyes on nanocrystalline TiO2. Binding mode switching from bidentate bridging to hydrogen-bonded monodentate configuration with Ti−N bonding has been observed when dye-sensitizing solution becomes more basic. Raman and infrared spectroscopy measurements confirm this configuration switch and determine quantitatively the proportion of competing binding geometries, with vibration peaks assigned using density functional theory calculations. We further found that the proportion of dye-binding configurations can be manipulated by adjusting pH value of dye-sensitizing solutions. Controlling molecular adsorption density and configurations led to enhanced energy conversion efficiency from 2.4% to 6.1% for the fabricated dye-sensitized solar cells, providing a simple method to improve photovoltaic performance by suppressing unfavorable binding configurations in solar cell applications. KEYWORDS: adsorption structure, manipulation, cyanoacrylic acid, vibrational spectra, dye-sensitized solar cell, enhanced efficiency
■
INTRODUCTION As a promising route toward low-cost, environmentally friendly power generation, the dye-sensitized solar cell (DSC), invented by Michael Grätzel in 1991,1 has attracted much attention. Many efforts were carried out on device optimization, while progress is slow. Until now, highest overall efficiency of DSC is 13%,2,3 still not high enough for large-scale application. Therefore, more attention should be focused on key factors and elementary processes in DSC to uncover the fundamental limits in each energy conversion step and to overcome the bottleneck in current researches. In a DSC device, light absorption (by dyes adsorbed on metal oxide) and charge collection (by metal oxides like TiO2) processes are separated, mimicking natural light harvest in photosynthesis. Only when dye molecules effectively bind to TiO2 surface can processes such as charge injection and © 2014 American Chemical Society
transportation proceed with high efficiency. Therefore, dye adsorption is the most important elementary process in DSCs. It is well-known that the adsorption geometry has a remarkable influence on photovoltaic parameters of DSC such as open-circuit voltage (Voc) and short-circuit current. Dyes that only weakly bind to TiO2 usually result in poor device performance (lower than 2% energy conversion efficiency).4,5 De Angelis et al. investigated the adsorption configuration of most popular Ru-complex N-719 dyes on TiO2 and showed that dipole moment orientation of the sensitizers, resulting from different binding configurations, can lead to as Received: September 16, 2014 Accepted: November 24, 2014 Published: November 24, 2014 22359
dx.doi.org/10.1021/am506365a | ACS Appl. Mater. Interfaces 2014, 6, 22359−22369
ACS Applied Materials & Interfaces
Research Article
fingerprints for accurate determination of D−π−A dye binding geometry, through which an optimized distribution of interface geometries can be obtained by adjusting dyeing conditions and high-energy conversion efficiency of DSC devices can be reached.
large as a 0.61 eV shift in TiO2 conduction band edge (CBE), introducing an ∼0.1 V larger open-circuit voltage.6 Recently, Kley et al. confirmed strong dependence of the lowest unoccupied molecular orbital (LUMO) positions of N3 dye on its binding modes, whereas scanning tunneling spectroscopy data acquired on tens of N3 molecules exhibit a wide distribution of LUMO positions ranging from 1.3 to 2.3 eV.7 More importantly, dye adsorption geometry undergoes various transformations under certain circumstances. Li et al. observed that the adjustment of adsorption configuration with assistance of surface hydrogen helps catechol diffusion on TiO2.8,9 Our previous work investigated Eosin Y binding configurations on TiO2 and associated structural changes controlled by changing electrolyte solutions.10 Identifying dye binding configuration is a crucial step before any rational structural control can be envisaged. Precise determination of dye binding geometry is, however, very challenging because of the complexity and sensitivity of dye/ nanocrystalline TiO2 interface. Tremendous controversy exists concerning the precise interface structures upon dye adsorption on TiO2. For the majority of dyes, a carboxyl group is employed as an effective anchor through which dyes bind onto TiO2 surfaces. At least three adsorption configurations were proposed regarding the position of the carboxylic group: monodentate, bidentate chelating, and bidentate bridging modes.11,12 Among them, bidentate chelating is highly unstable according to first-principles calculations,13 so this configuration is thought to be nonexistent in real devices. Bidentate bridging was considered to be most stable and widely accepted in most previous works.11,12,14,15 However, our observation suggests that the adsorption configuration with Ti−N and Ti−O binding is more stable than bidentate bridging for cyanoacrylate dyes.16 For a full understanding of the fundamental processes in DSC and a rational control in applications, the information about the precise binding configurations and relative concentration is highly desirable. A large proportion of synthesized dyes use cyanoacrylic groups as the anchor, making various adsorption configurations possible in real DSC devices. These metal-free organic dyes adopt a donor-π bridge-acceptor (D−π−A) structure,17−21 attracting much attention in DSC community recently and reaching a highest efficiency of 11.5−12.8%.18 In the present work, we have taken a typical cyanoacrylic D−π−A dye named 5-[4-(diphenylamino)phenyl]thiophene-2-cyanoacrylic acid (L1) as a representative dye to study its adsorption on TiO2 by combining vibration spectroscopic measurements and firstprinciples calculations. Two different binding configurations, hydrogen-bonded monodentate with Ti−N bonding (A2) and bidentate bridging (B2), were clearly identified by analyzing spectroscopic Fourier transform infrared (FTIR) and Raman measurements, accompanied by theoretical analysis. The existence of newly proposed structure A2 is strongly supported by the presence of asymmetric COO vibration, spectral changes upon adjusting dyeing solution, and the persistent shift of CN stretch mode. More importantly, the quantitative proportion of A2 adsorption mode can be first determined, and artificially adjusted by the pH value of dye-loading solution. A direct link between the measured interface structure and resultant device photovoltaic performance has been established, whereas the dominance of A2 binding geometry leads to increased opencircuit voltage, higher dye loads, and enhanced device stability. Our results suggest the position and intensity of asymmetric COO mode and CN stretch mode can serve as effective
■
EXPERIMENTAL SECTION
Materials and Chemicals. 2-Cyano-3-(2-thienyl)acrylic acid (M0, 97%, powder) from PI Company, P25 TiO2 nanoparticles (99.5%), and 200 nm particle from Degussa are all commercially available and used as received without further purification. Confirmed by Raman and X-ray diffraction, anatase content is over 90% in our P25 TiO2 sample. 5-[4-(Diphenylamino)phenyl]thiophene-2-cyanoacrylic acid (L1, 98.5%) is synthesized by Synwit Technology Company in Beijing. Its purity was confirmed by 1H nuclear magnetic resonance spectra and compared with ref 20. Other regents such as ethanol or NaOH are analytically pure. Raman and IR Spectra. A layer of nanocrystalline TiO2 (5 μm) was deposited on a precleaned glass substrate by doctor blade method using a uniform TiO2 paste containing 3.5 g Degussa P25 TiO2 powder (scanning electron microscopy image in Supporting Information, Figure S1), 35 mL ethanol. TiO2 film was heated to 500 °C in the muffle furnace and kept at that temperature for 30 min to remove organic pollutants. When it was cooled to 100 °C, it was immersed immediately into 0.3 mM L1 or 10 mM M0 ethanol solution. The adsorption process was maintained for 15 h. Then the film was rinsed with pure ethanol thoroughly to remove unbound dye molecules and dried in air. The pH value of dye solutions was adjusted by adding NaOH solid powder or 37% HCl aqueous solution, measured by a pH meter (Mettler Toledo) with an accuracy of ±0.3. Note that the numerical pH values in this work are reproducible and should be considered unconventional because referred to a reading in ethanol solvent rather than in water. To measure Raman spectra, the sensitized TiO2 powder was removed from the glass and contained in Nuclear Magnetic Resonance tubes and sealed. NICOLET 6700 FT-Raman spectrometer (Thermo Scientific, USA) was applied. The wavelength used was 1064 nm to avoid fluorescence effect, and a frequency resolution of 4 cm−1 was achieved. Transmission infrared spectra were obtained using a NICOLET iN10 MX FTIR spectrometer (Thermo Scientific, USA). A small volume powder of M0, L1, and molecule-adsorbed TiO2 was pressed between two diamond windows. Spectra covering the range from 4000 to 600 cm−1 and 16 scans at a resolution of 4 cm−1 were used. The IR illuminating area was ∼100 μm × 100 μm. Laser Photolysis Studies. The nanosecond laser flash photolysis (LFP) technique was applied to study dynamic process of dyeadsorbed TiO2 nanoparticles. Dye-loaded TiO2 films were dispersed in acetonitrile by 3 min of sonication. The suspension was filled into a sample quartz cell (1 cm × 1 cm × 4 cm). Details of LFP instrument setup named LP920 are described in ref 22. A nanosecond Nd:YAG laser system was used for excitation (Surelite Continuum laser, pulse width 5−8 ns), and Xe lamp with 450 W was used as probe light. DSC Fabrication. The procedure for DSC fabrication and assembly followed the description in ref 23. Fluorine-doped tin oxide coated glass (FTO, NSG) was cleaned by sequential sonication in distilled water, acetone, and ethanol and then treated in UV-ozone furnace for 20 min. A compact TiO2 blocking layer was deposited on the conductive side of FTO glass by soaking the substrate in 40 mM TiCl4 aqueous solution and heated to 70 °C for 30 min. After rinsing with distilled water and drying in air, a layer of nanocrystalline TiO2, 10 μm thick, was deposited by doctor blade method, using a uniform TiO2 paste containing 3.5 g Degussa P25 TiO2 powder and 0.17 g carbowax M-20,000 in 35 mL ethanol. Following that, a layer of lightscattering TiO2 containing 200 nm particles, 4 μm thick, was deposited on P25 TiO2 film, then dried in air for 5 min and heated to 450 °C for 30 min. After cooling to room temperature, the film was soaked in 40 mM TiCl4 solution again and boiled at 70 °C for 40 min. After washing it with distilled water, we heated the TiO2 film gradually to 22360
dx.doi.org/10.1021/am506365a | ACS Appl. Mater. Interfaces 2014, 6, 22359−22369
ACS Applied Materials & Interfaces
Research Article
500 °C (8 °C per minute) and maintained at 500 °C for 30 min and then cooled it to 100 °C. The film was immersed into L1 ethanol solution (0.3 mM) and sensitized overnight. After 15 h, the film was removed from the dye solution, rinsed with ethanol, and dried in a 60 °C oven. Plastic spacers were prepared and put on dye-adsorbed TiO2 film. Drop electrolyte onto the film. Standard electrolyte was used. The standard electrolyte contains DMPII 0.3M, I2 0.05 M, LiI 0.5 M, 4-TBP 0.5 M in acetonitrile. Finally, fix the anode and Pt counter electrode together to make the DSC device. Current density−voltage (I−V) curves of DSCs with 0.16 cm2 active area were obtained under AM 1.5G (100 mW/cm2) illumination. The measurement employed a solar simulator equipped with 150 W xenon lamp (model 94021A, Oriel), a reference solar cell (model 91150 V) and a Keithley model 2400 digital source meter. Theoretical Computation. First-principles density functional theory (DFT) calculations were carried out to study the molecular geometry, electronic structure, and vibration spectrum of M0 adsorbed onto TiO2 surfaces. The ground-state molecular geometries were optimized with Vienna ab initio simulation package (VASP), using Vanderbilt ultrasoft pesudopotentials and generalized gradient approximation (GGA) of PW91. An energy cutoff of 400 eV and Γ point k-sampling was used. Geometries were optimized until forces on nonfixed atoms are below 0.03 eV/Å, which were considered fully relaxed. The simulation cell contains the M0 molecules, bonded onto the TiO2 anatase (101) surface, the dominant and thermodynamically stable facet. The surface slab has dimensions of 10.38 × 15.27 × 25.00 Å3, corresponding to a TiO2 surface coverage of one dye per 158 Å2 or 1.05 μmol·m−2. Periodic boundary conditions were applied to replicate the simulation cell in all three dimensions. A sufficiently large vacuum layer (at least 10 Å) was added to the simulation cell in the direction perpendicular to the surface to ensure no interactions between each slab. Vibration spectroscopy was calculated by Fourier transform of the dipole correlation function with an energy resolution of 6 cm−1. The dipole correlation function was obtained by molecular dynamics (MD) simulations with a time step of 1 ps. When vibration mode of COO group is discussed, theoretical curves are rescaled by a factor of 1.015 in frequency to display a better fit to experimental curves.
■
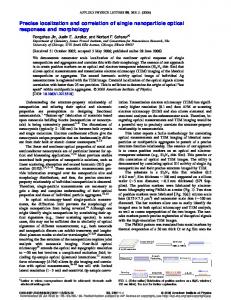
Figure 1. IR spectrum of (a) M0 powder, (b) M0 adsorbed TiO2 through pure ethanol solution, and (c) M0 adsorbed TiO2 through ethanol solution containing NaOH. (inset) The M0 molecule structure and possible adsorption structure of the anchor part. Theoretical frequencies of M0/TiO2 are shown as vertical bars in (c). Red bars for configuration A2: νasym(COO) = 1608 cm−1, νsym(COO) = 1292 cm−1; Blue for configuration B2: νasym(COO) = 1584 cm−1, νsym(COO) = 1315 cm−1; Green for configuration A1: νasym(COO) = 1691 cm−1, νsym(COO) = 1229 cm−1.
RESULTS AND DISCUSSION
IR and Raman Spectra of M0 Adsorbed on TiO2. Direct evidence concerning dye-adsorption configuration on TiO2 surface can be obtained by measuring the vibrational spectra of dye molecules at the interface. Since L1 is a complex molecule and interaction between dyes and TiO2 is localized at the acceptor part of the dye, we take M0 (2-cyano-3-(2thienyl)acrylic acid) as a simple model to study dye adsorption first. The chemical structure of M0 is shown in Figure 1a inset. Figure 1a presents the IR spectrum of M0 molecules in powder form. The band at 1689 cm−1 is assigned to CO stretching of a free carboxyl group (in dimer form).14 It completely disappears after M0 adsorption on TiO2 (Figure 1b), strongly suggesting that carboxyl group take part in adsorption. In the IR spectrum of M0 adsorbed TiO2 film (Figure 1b), new sharp band appears at 1606 cm−1, which may be related to the asymmetric vibration of adsorbed COO group.24,25 Features at ∼1640 cm−1 can be attributed to water.26 A sharp peak at 1581 cm−1 in Figure 1a is designated to vibration mode of the thiophene moiety. Since the thiophene group is pointing away from the surface and not involved in surface binding,27 its IR peak position should not change, consistent with a shoulder appearing at the same position after adsorption (Figure 1b). More interesting, the peak at 2225 cm−1, which is the CN stretching mode of L1 in powder form, is red-shifted to 2222 cm−1, suggesting CN also participates in dye adsorption.
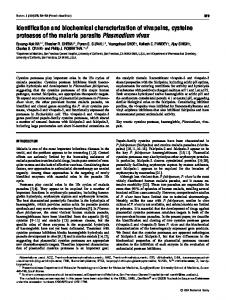
The observations above provide a clue about M0’s adsorption structure. To ascribe the peaks more precisely, we calculated the binding energy and vibration frequency of COO group from all possible M0 adsorption structures, as displayed in Figure 2. A1 has both −CN and −CO bonded to surface with 2.29 Å Ti−N and 2.04 Å Ti−O bond length. A2 is more robust with an additional hydrogen bond (H-bond) connected to the surface, where the O···H length is 1.60 Å. Configuration B1 is similar to A2 in that it contains the Ti−O monodentate bond and H-bond but no Ti−N bonding. Structure B2 is bidentate bridging mode with two interface Ti−O bonds (bond length: 2.08 Å). Note that D−π−A dyes containing anchors similar to M0 are found to stand up on TiO2 surface;27−29 therefore, we adopt the Z isomer30,31 (thiophene and COOH are in cis configuration) for A structures and the E isomer (thiophene and CN are in cis configuration) for B2 configuration to avoid steric hindrance between the dye donor and the TiO2 surface. The E isomer for A1−A3 and Z isomer for B2 are also considered. For D−π−A dyes with a large donor group, however, strong steric hindrance prevents formation of these lying down configurations. Among all possible adsorption structures, A2 is most stable, whose adsorption energy is 1.3 eV, similar to previous result.16 B2, which is widely accepted to be dominant adsorption species in most previous works, is less stable by only 0.2 eV. Calculated adsorption energy for A1 is moderate, 1.0 eV, while for B1, its 22361
dx.doi.org/10.1021/am506365a | ACS Appl. Mater. Interfaces 2014, 6, 22359−22369
ACS Applied Materials & Interfaces
Research Article
Figure 2. Different adsorption structures of M0. First row: adsorption with Ti−N binding; second row: adsorption without Ti−N binding.
The assignment is in good agreement with our additional experiments. After addition of NaOH in M0 ethanol solution, with 1:1 molar ratio, IR spectrum of adsorbed molecule changes compared with Figure 1b. COO asymmetric vibration is blue-shifted to be 1615 cm−1, and CN stretching band is further red-shifted to be 2220 cm−1, indicating an increased ratio of A2 (A3) configuration (Figure 1c). In the present situation, more hydroxyl groups are preserved on NaOHmodified TiO2, with some donating a hydrogen atom to form a hydrogen bond with the dangling O atom from M0’s carboxylate group,34 and forming configuration A3, which resembles configuration A2 very much. The calculated adsorption energy, vibration peak, and dipole moment of A3 is almost identical to that of A2. These two configurations only differ in the hydrogen bond length: in A2 the H···O length is 1.60 Å, while in A3 it is 2.02 Å. A weaker H bond in configuration A3 would result in an increase in νasym(COO) from 1606 to 1615 cm−1. Therefore, both A2 and A3 configurations can be essentially considered as the same structure. We note that if only one stable configuration exists in the M0/TiO2 (L1/TiO2) system, changes in IR spectra mentioned above cannot occur. Therefore, there are at least two binding configurations coexisting, and presumably they are configurations A2 and B2. MD simulations provide a more direct comparison to experiments on peak assignment. Asymmetric and symmetric vibration peaks of adsorbed COO group in A2 configuration are shown in Figure 3a. For comparison, IR spectrum of M0 adsorbed TiO2 is also plotted. Clearly, A2’s vibration peaks are similar to experimental curve, both in amplitude and peak positions. As for B2, amplitude of its symmetric COO vibration (1315 cm−1), matches better with 1312 cm−1 peak than 1292 cm−1 peak of A2 (Figure 3b). Vibration frequency for asymmetric COO mode (1584 cm−1) is fairly low, which contributes to the 1580 cm−1 shoulder in experimental curve. Calculated bands located at 1563 and 1393 cm−1 for A2, together with bands at 1483 and 1376 cm−1 for B2, are designated to coupled vibrations of other groups conjugated
binding energy is small, 0.9 eV, which easily desorbs from TiO2 surface. Considering the accuracy of DFT simulations, A1, A2, and B2 are possible structure candidates for dye adsorption on TiO2 that could coexist in devices. To judge which structure is dominant, IR and Raman signals related to the anchor group in these configurations must be measured and analyzed. Through first-principles calculations, we found the CN stretching band in A2 adsorption configuration is located at 2212 cm−1, which is red-shifted compared to that of a free molecule and of configurations without Ti−N bonding (2217 cm−1).16 The trend is in good accordance with experiment, where CN stretching frequency moves from 2225 to 2222 cm−1 after M0 adsorbs onto TiO2 substrate (Figure 1). The existence of A2 mode with interface Ti−N bond suggests that cyano group in organic dye is not just an electronaccepting unit but also binds to TiO2 substrate. Coupling between cyano group and TiO2 surface has been considered by previous work.32,33 It stabilizes dye anchoring by additional 0.4−0.7 eV Ti−N bond strength. This is consistent with A2’s highest adsorption energy. More importantly, the bond produces higher Voc while maintaining efficient photoelectron injection with higher yields, shown in previous work.16 As a result, ratio of A2 mode should be increased in real devices to enhance photovoltaic performance. More evidence comes from locations of calculated peaks for COO asymmetric and symmetric vibration modes represented by short vertical bars in Figure 1c. The frequency of asymmetric COO vibration in the A2 configuration, νasym(COO) = 1608 cm−1, is almost identical with the value of 1606 cm−1 measured in IR experiment after rescaling by a factor of 1.015. Therefore, the 1606 cm−1 peak confirms the existence of A2 adsorption mode. No obvious band is observed for frequencies higher than 1606 cm−1, indicating few molecules would adopt the A1 configuration on TiO2, where νasym(COO) = 1691 cm−1. As for structure B2, a peak shows up at 1312 cm−1 after adsorption, which matches well with calculated νsym(COO) = 1315 cm−1. From the analysis of IR spectra, there is a great possibility that A2 and B2 coexist during M0 (L1) adsorption. 22362
dx.doi.org/10.1021/am506365a | ACS Appl. Mater. Interfaces 2014, 6, 22359−22369
ACS Applied Materials & Interfaces
Research Article
Figure 3. (a) Computed IR spectra from vibration of A2’s COO group (black) and IR spectrum of adsorbed M0 (red, experiment); (b) computed vibrational spectra of B2’s COO group. (inset) Configuration A2 and B2 at anchor part. Theoretical curves are rescaled by a factor of 1.015 in vibration frequency to display a better fit to experimental curves.
Figure 4. IR spectrum of (a) L1 powder, (b) L1 adsorbed TiO2 through L1 ethanol solution (pH = 5.9), and (c) L1 adsorbed TiO2 through L1 ethanol solution (pH = 8.9). (inset) The L1 molecule structure.
shows up out of the background of water bands (∼1640 cm−1) when the dye-sensitizing solution is adjusted to be more basic, that is, at a relative pH = 8.9. The position of peak is almost the same as the asymmetric vibration mode of the COO group after M0 is adsorbed. Consequently, the appearance of 1610 cm−1 peak indicates A2’s existence in L1/TiO2 adsorption system. Raman spectra can also be applied to investigate L1’s adsorption structure. Figure 5b is Raman spectrum of adsorbed L1. Compared to spectrum of pure L1 (Figure 5a), location of peak at 1588 cm−1 does not change at all. This peak is assigned to vibration modes of the phenyl group, similar to that for IR spectrum. Because phenyl group does not participate in dye
with COO group. Above analysis shows that A2 and B2 configuration coexist in M0/TiO2 system. Previous investigations also support the above assignment. Red shift of CN stretch mode is similar to those observed for other molecules with the cyanoacrylic acid as an anchor. 14,35−37 Both experimental and theoretical works show that the vibration band located between 1600 cm−1 to 1630 cm−1 is a sensitive signature for hydrogen-bonded monodentate adsorption.38,39 Recognition and Manipulation of L1’s Adsorption Structure. In real DSC devices, M0 should be attached to a triphenylamine group to absorb visible light. This would form L1, a typical D−π−A dye (Figure 4a inset). Absorption spectrum of L1 in ethanol shows an intense peak at 434 nm. The light-harvesting behavior can be adjusted by adsorption. After binding to TiO2, the band is blue-shifted to 414 nm and broadened at 500−550 nm (Supporting Information, Figure S2), suggesting most carboxylic groups of L1 are deprotonated.40−42 L1 has similar adsorption structures to those of M0 since their anchor part is exactly the same. We investigate the vibration features for L1 adsorption on anatase TiO2 through Raman and IR measurements. As shown in Figure 4, CN stretching vibration mode is red-shifted from 2219 cm−1 (Figure 4a) to 2216 cm−1 (Figure 4b) after adsorption, following the same trend as M0. This fact suggests that CN is involved in L1 adsorption so that A2 configuration might exist. To further confirm the existence of A2 adsorption, vibration bands from the adsorbed carboxylate group should be distinguished. However, a strong band develops at 1591 cm−1, which comes from vibration modes of the phenyl group. This band covers signals from the COO groups in the IR spectra. As a result, it is hard to identify the A2 mode from Figure 4b alone. Fortunately, a peak at 1610 cm−1 (Figure 4c)
Figure 5. Raman spectrum of (a) L1 powder and (b) L1 adsorbed TiO2 through L1 ethanol solution (pH = 5.9). 22363
dx.doi.org/10.1021/am506365a | ACS Appl. Mater. Interfaces 2014, 6, 22359−22369
ACS Applied Materials & Interfaces
Research Article
adsorption, we take this band as a reference in the following analysis. The shoulder at 1607 cm−1 may also contain signals for vibration modes in the phenyl group. However, the position and amplitude are slightly different from the corresponding peak in the IR spectrum for L1 adsorption. Since the asymmetric COO stretch is both IR and Raman active, we believe this mode will contribute to the 1607 cm−1 band.34,38,43 Moreover, Raman spectrum is insensitive to water, and the Raman bands at this region are narrower than IR bands, making it a suitable tool to investigate quantitatively changes in adsorption structures. We find that binding configuration of cyanoacrylic dyes such as M0 and L1 can be controlled by changing pH value of dye solution used for adsorption. To see whether the ratio of a certain adsorption mode can be manipulated successively, pH value of L1 ethanol solution is adjusted by adding NaOH or HCl. Figure 6 shows Raman spectra for L1 adsorbed on TiO2
Figure 7. Cyano group vibration frequencies (IR) of L1 powder and L1 adsorbed via ethanol solution with different pH values. Dashed line is the guide for eyes.
cm−1), suggesting less Ti−N bond formation. At pH = 1.3, the CN frequency is almost identical to that for free CN, indicating no Ti−N bonding in this case. In such cases, B1-like adsorption mode with protonated COOH and no Ti−N bond can be inferred. Note the asymmetric vibration of adsorbed COOH group usually locates at ∼1580 cm−1, far away from the 1607 cm−1 region,39,44 explaining the red shift of 1588 cm−1 peak (blue line) in Figure 6. Assuming these two situations (pH = 11.8 and 1.3) as limiting cases, the ratio of A2 structure in all dye solutions can be estimated given that the area of Raman peaks is proportional to the concentration of analyte.45 The results are shown in Figure 8 and summarized in Table 1. It is obvious that A2’s Figure 6. Raman spectrum of L1 adsorbed TiO2 through L1 ethanol solution with relative pH value adjusted to be 11.8, 8.9, 6.8, 5.9, 4.3, and 1.3. All spectra are normalized in intensity with reference to that for the peak at 1588 cm−1.
through different solutions. Normalized by 1588 cm−1 peak, the band located at 1607 cm−1 is enhanced with pH value increasing, suggesting formation of more A2 configurations. Detailed data analysis gives semiquantitative analysis about A2’s ratio of all adsorbed molecules. Two Lorentz peaks located at 1588 and 1607 cm−1 are used to fit the Raman signal in Figure 6. In this work, we use the ratio of peak areas as an approximate measure of A2’s proportion among all adsorbed dye molecules. When dye solutions become very basic (pH = 11.8), area and amplitude of 1607 cm−1 peak reaches maximum, because hydroxyl groups on TiO2 surface donate more hydrogen atoms to increase A2/A3 modes, similar to that in the M0/TiO2 system. Since NaOH reaches saturate solubility in ethanol, the pH = 11.8 case is assumed to reach a corresponding proportion of 100% for A2 configuration. When acid is added, A2, an anion form, is suppressed because HCl in solutions and H3O+ on TiO2 surface prevent dissociation of L1’s carboxylic group, whose pKa value is between 3 and 5. For pH = 1.3 solution, no anion form exists based on Henderson−Hasselbalch equation. So pH = 1.3 case corresponds to no A2 configuration in M0/TiO2 system. Figure 7 shows that decreasing pH value of dye-sensitizing solution lead to CN vibration frequency closer to that for free CN (2219
Figure 8. Approximate proportion of A2 configuration among all possible adsorption structures as a function of pH value of dye loading solutions.
proportion is increased along with increasing the pH value. This is the first time that the ratio of a particular adsorption structure is determined for dye/TiO2 system. Influence of Adsorption Structure on DSC Performance. Manipulating dye adsorption structures provides a simple effective way to improve DSC performances. Inspired by above observation that L1 dye adsorption can switch from B2 to A2 when dye-loading solution becomes more basic, we take this wisdom to adjust the binding mode of L1 on TiO2 to 22364
dx.doi.org/10.1021/am506365a | ACS Appl. Mater. Interfaces 2014, 6, 22359−22369
ACS Applied Materials & Interfaces
Research Article
(no. 2), 8.9 (no. 5), rapid decrease in photovoltaic parameters like Jsc is observed compared to cells sensitized in solution no. 4, indicating that pH = 6.8 is the optimized level. Over 6% efficiency and 0.68 V open-circuit voltage are repeated easily when NaOH is replaced by KOH in cell no. 4, suggesting the enhanced efficiency is not caused by cation.46 The adsorption mechanism mentioned above can give us invaluable insight into the relationship between the adsorption structures and the DSC performance. For cells with highest efficiency sensitized with L1 solution no. 4, the data presented in Table 1 show that A2 structure ratio is increased compared to cell no. 3 from 22% to 60%. Note that in these experiments we only adjust pH value of dye-sensitizing solutions, while the same electrolyte is used for all the solar cell devices. Previous studies show that adsorption geometry of dyes such as Eosin Y and N-719 on TiO2 is stable in the presence of nitrile-based electrolyte.10,47 To explain why different adsorption configurations at interface result in a marked change in the measured DSC photovoltaic performance, especially the persistent increase in Voc, we perform first-principles calculations to illustrate the electronic structure of M0/TiO2 of different interface configurations and extend the result to L1/TiO2. The Perdew-Burke-Ernzerhof exchange-correlation functional is employed in our calculation. From the calculated projected density of states plots in Figure 10, the conduction band edge for the B2 adsorption
Table 1. Raman Peak Analysis of L1 Adsorbed TiO2 Sensitized in Different Solutions pH of solutions
area(1607 cm−1)/area(1588 cm−1)
A2’s ratio (%)
1.3 4.3 5.9 6.8 8.9 11.8
0.161 0.245 0.317 0.580 0.764 0.857
0 12 22 60 87 100
see whether the photovoltaic performance of DSC device can be improved. Figure 9 shows the measured I−V characteristics of DSC fabricated with TiO2 film sensitized in L1 solutions with
Figure 9. Current−voltage (I−V) curves for dye solar cells with TiO2 photoanode sensitized with different L1 solutions, measured under AM 1.5G (100 mW/cm2) illumination. The same electrolyte (DMPII 0.3M, I2 0.05 M, LiI 0.5 M, 4-TBP 0.5 M in acetonitrile) is used for all the solar cell devices.
different pH values. Key parameters of the DSC devices including short-circuit photocurrent Jsc, open-circuit voltage Voc, and fill factors (FF) are listed in Table 2, together with the Table 2. Performance Characteristics of Dye Solar Cellsa Based on L1 Sensitized in Different Solutions cell no.
dye
pH of solutions
Voc (V)
Jsc (mA/cm2)
FF
η (%)
1 2 3 4 5
L1 L1 L1 L1 L1
1.3 4.3 5.9 6.8 8.9
0.57 0.60 0.63 0.67 0.56
7.1 11.0 15.5 15.4 8.3
0.59 0.58 0.60 0.60 0.55
2.4 3.9 5.8 6.1 2.6
Figure 10. Calculated projected density of states for configurations A2 and B2. Red curves are for molecules, and shaded areas under black lines are for TiO2 substrate.
configuration is lower than that for A2 configuration by ∼80 meV. This trend matches well with the Voc trend in DSC performance. Note the measured Voc corresponds to the energy difference between the quasi-Fermi level of TiO2 under illumination (close to CBE) and the redox potential of the electrolyte.1 And the position of CBE is directly related to surface potential, affected by the dipole moments induced by dye adsorption. Since L1’s dipole moment is determined by orientation of anchor part (M0), it is reasonable to apply the M0 result. Calculated dipole moment of A2 mode is 0.84 e·Å, larger than B2 mode (0.68 e·Å). According to the fact that higher dipole moment shifts CBE to be more negative in potential,6,48 an enhanced Voc of A2 adsorption mode can be inferred. Higher Voc can be also explained by suppressed interfacial recombination.49,50 According to Marcus theory (eq 1),
a
The same electrolyte (DMPII 0.3M, I2 0.05 M, LiI 0.5 M, 4-TBP 0.5 M in acetonitrile) is used for all the solar cell devices.
overall sunlight-to-electricity conversion efficiency (η). For L1based devices, five kinds of dye solutions are applied. When L1 ethanol solution is introduced to sensitize TiO2 film, the device reaches an efficiency of η = 5.8% (cell no. 3). Dye solution no. 4 differs from no. 3 by adding a little NaOH into dye solution, and pH is increased from 5.9 to 6.8. As a result, open-circuit voltage Voc of cells with electrolyte no. 4 is improved from 0.63 to 0.67 V, and the efficiency is increased by ∼5% (see Table 1). When pH value of L1 solutions are adjusted to 1.3 (no. 1), 4.3 22365
dx.doi.org/10.1021/am506365a | ACS Appl. Mater. Interfaces 2014, 6, 22359−22369
ACS Applied Materials & Interfaces
Research Article
process with time constant τ2 is attributed to trapping of excited electrons into localized state of TiO2 near midgap.56,57 From Table 3, it is clear that L1 adsorbed TiO2 sensitized from pH = 6.8 solution has slower recombination rate than that from pH = 5.9 and 4.3 solutions. Since adjusting pH value of sensitizing solution to be 6.8 led to more favorable configuration A2 (Figure 8), the result is in good accordance with estimated recombination rate from Marcus theory and measured higher Voc for device no. 4, further confirming the differences in charge dynamics and device performance are resulted from dye configuration changes. Factors other than adsorption structure manipulation are excluded by detailed analysis. It is well-known that dye adsorption amount on TiO2 surface sensitized are influenced by sensitizing solvents and pH values. By desorbing the L1 dye into a NaOH basic solution, the dye load was estimated by measuring the absorption spectrum of the rinsing solution. The concentration of L1 on TiO2 film sensitized in pH = 1.3, 4.3, 5.9, 6.8, and 8.9 solutions was estimated to be 0.20 × 10⁻⁷, 1.31 × 10⁻⁷, 1.34 × 10⁻⁷, 1.44 × 10⁻⁷, and 0.22 × 10⁻⁷ M·cm−2, respectively (film thickness normalized to 10 μm, Figure 12).
electron-transfer rate kET between two states is related to energy difference ΔG0 between them: ⎛ −(ΔG° + λ)2 ⎞ π ⎟ |V |2 exp⎜ 4λkBT ℏ λkBT ⎝ ⎠
kET =
2
(1)
Here λ is defined as reorganization energy, and its value is taken as 1.0 eV, which is commonly accepted in previous works investigating similar dye/TiO2 systems.51,52 From Figure 10, the driving force ΔG0 for recombination between CBE and highest occupied molecular orbital (HOMO) of A2 is −1.43 eV, while for B2 it is −1.36 eV. Estimation from eq 1 shows that recombination rate is 40% slower for A2 than B2 at 300 K. Further support is provided by nanosecond laser photolysis experiment. Figure 11 shows oxidized-state decay of L1 dye
Figure 12. Adsorption density of L1 on TiO2 via dyeing solutions with different pH values.
Figure 11. Transient absorption data following the decay of oxidized state of L1 attached to TiO2 via pH = 4.3, 5.9, and 6.8 solution. All samples are dispersed in acetonitrile. Excitation wavelength: 355 nm. Probe wavelength: 650 nm. ΔA is absorbance difference between excited and ground state sample.
The result shows that rapid photocurrent decrease of cell nos. 1 and 5 is due to low dye adsorption amount. This is reasonable because HCl suppress the L1 deprotonation, which is important for stable adsorption (no. 1); and hydroxyl group strongly binds to TiO2 surface,58 competing with L1 adsorption (no. 5). The adsorbed dye density on TiO2 films (1.31 ± 0.24) × 10−7, (1.34 ± 0.26) × 10−7, and (1.44 ± 0.24) × 10−7 mol/ cm2, respectively, for pH = 4.3, 5.9, and 6.8, is essentially the same within the measurement error (differences