David L. Donoho1 and Jared Tanner2. 1Department of Statistics ...... the same for every matrix A with nullspace ker(A) in general position with respect to the ...
1
Precise Undersampling Theorems David L. Donoho1 and Jared Tanner2 1 Department of Statistics, Stanford University 2 School of Mathematics, University of Edinburgh
Abstract—Undersampling Theorems state that we may gather far fewer samples than the usual sampling theorem while exactly reconstructing the object of interest – provided the object in question obeys a sparsity condition, the samples measure appropriate linear combinations of signal values, and we reconstruct with a particular nonlinear procedure. While there are many ways to crudely demonstrate such undersampling phenomena, we know of only one approach which precisely quantifies the true sparsity-undersampling tradeoff curve of standard algorithms and standard compressed sensing matrices. That approach, based on combinatorial geometry, predicts the exact location in sparsity-undersampling domain where standard algorithms exhibit phase transitions in performance. We review the phase transition approach here and describe the broad range of cases where it applies. We also mention exceptions and state challenge problems for future research. Sample result: one can efficiently reconstruct a k-sparse signal of length N from n measurements, provided n & 2k · log(N/n), for (k, n, N ) large, k � N . Keywords: Undersampling. `1 minimization. Superresolution. Bandlimited measurements. Random Measurements. Compressed Sensing. Random Polytopes. Universality of matrix ensembles. AMS 2000 subject classifications. Primary: 41A46, 52A22, 52B05, 62E20, 68P30, 94A20; Secondary: 15A52, 60F10, 68P25, 90C25, 94B20.
Acknowledgments: The authors would like to thank the Isaac Newton Mathematical Institute of Cambridge University for hospitality during the program Statistical Theory and Methods for Complex, High-Dimensional Data, and for a Rothschild Visiting Professorship held by DLD. The authors would like to thank Erling Anderson for donating licenses for the Mosek software package to allow for timely empirical investigation of the phenomenon presented herein. This work has made use of the resources provided by the Edinburgh Compute and Data Facility (ECDF). DLD was partially supported by NSF DMS 05-05303, and JT was partially supported by Sloan Fellowship and Leverhulme Fellowship. I. I NTRODUCTION The sampling theorem of Shannon-Nyquist-KotelnikovWhittaker has been of tremendous importance in engineering theory and practice. Straightforward and precise, it sets forth the number of measurements required to reconstruct any bandlimited signal. However, the sampling theorem is wrong! Not literally wrong, but psychologically wrong. More precisely, it engenders the psychological expectation that we need very large numbers of samples in situations where we need very few. We now give three simple examples which the reader can easily check, either on their own or by visiting the website [Spa] that duplicates these examples.
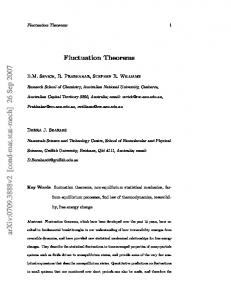
Example 1. k-Sparse Signal, general sign pattern. We begin with a caricature of Magnetic Resonance imaging. Related ideas have been used by MRI researchers [LP07], [LDSP08] to speed up dynamic cardiac imaging by a factor of 8. We hope to recover a discrete-time signal vector x0 with N = 1600 entries, only k = 128 of which are nonzero, but some of them may be positive and some may be negative. We again observe many fewer that 1600 measurements; in fact just n = 481 randomly chosen Fourier frequencies. Figure 1(a) shows such a sparse sequence, with 128 nonzero terms. Figure 1(b) shows the modulus of its Fourier transform, which is quite substantial out to Nyquist. The red box indicates the measurement cutoff at wavenumber 240. In fact fully 70% of the signal energy lies beyond the cutoff. Naturally, one expects that only 481 measurements will not be sufficient to recover the signal, and in fact, if we used standard linear methods, it would not be. However, reconstructing the signal is possible using the solution to this `1 -norm minimization problem: X min |xi | subject to Ax = b. (P1) i
The results depend on the exact nature of the random subset of Fourier coefficients observed, but with high probability, we do get exact reconstruction. Extensive experiments show that the probability of exact reconstruction P ≈ 95.5%. For fuller discussion, see [CRT06b], [DT09a] Example 2. k-Sparse Nonnegative Signal. Turn to a caricature of a measurement problem faced by physical chemists who perform spectroscopy: they observe the low-frequency content of a signal thought to have relatively few, distinct spectral lines. Suppose we are interested in a discrete time signal vector x0 with N = 512 non-negative entries, only k = 20 of which are nonzero, but we observe many fewer than 512 measurements; in fact just the n = 51 lowest Fourier frequencies (wavenumber ≤ 25). Such positive sparse signals are naturally wideband; they have full frequency content, approximately 90% of the signal energy is beyond the cutoff at wavenumber 25. Naturally, one expects that a mere 51 measurements will not be sufficient to recover the signal, and using standard linear methods, it would not be. However, reconstructing the signal is possible using the solution to the linear program min 1T x
subject to
Ax = b
x ≥ 0.
We do get exact reconstruction in this case.
(LP)
2
be sufficient to recover the signal, and in fact, if we use standard linear methods, it would not be. Reconstructing the signal is possible using the solution to the feasibility problem
3
2
x s.t. Ax = b and 0 ≤ xi ≤ 1 i = 1, 2, . . . , N. (Feas) 1
0
−1
−2
−3 200
400
600
800
1000
1200
1400
200
400
600
1600
(a) 1.8
1.6
1.4
1.2
1
0.8
0.6
0.4
0.2
0 −800
−600
−400
−200
0
(b) Fig. 1. Example of Successful Undersampling. Panel (a): A randomly drawn sequence of length 1600 with 128 nonzero whose locations were drawn uniformly from permutations of 1,2,. . . ,1600 and whose magnitude was drawn from the standard Gaussian N (0, 1); Panel (b): The magnitude of the Fourier Transform of the sequence in Panel (a), with the lowest 481 Fourier modes demarked by the red box. A full 70% of the signal energy lies beyond the lowest 481 Fourier modes. Here (P1) perfectly reconstructs the full wideband signal from 481 random Fourier modes. Despite undersampling, (P1) gives exact reconstruction in this case.
Theorem: for every positive signal having at most k nonzeros, (LP) reconstructs exactly from n ≥ 2k + 1 Fourier measurements. For fuller discussion, see [DJHS92], [DT05b], [Fuc05] Example 3. k-Simple Bounded Signal. Now turn to a caricature of a problem in infrared absorption spectroscopy [Jan97]; we observe low-pass measurements of a signal bounded between 0 and 1. We wish to recover a discrete time signal vector x0 with N = 512 entries. By the nature of the measurements, the values of x0 are proportions taking values in the interval [0, 1]. In addition suppose that the signal has a bang-bang character, spending most of its samples at the extremes: only k = 75 of these values are not equal to either 0 or 1. We now observe somewhat fewer than 512 measurements; in fact just the n = 301 lowest Fourier frequencies (wavenumber ≤ 150). Naturally, one expects that only 301 measurements will not
Surprisingly, there is typically a unique feasible vector which is precisely x0 . In fact, among all signals of length 512 which are bounded between 0 and 1 and have k entries strictly between 0 and 1, exact reconstruction has a frequency of about 59%. For fuller discussion, see [DT10a] These three examples illustrate a broader abstract phenomenon: we don’t need N linear measurements to reconstruct a vector with N entries – if those entries obey a sparsity constraint or simplicity constraint. We can use fewer measurements and get exact reconstruction, provided: • our measurements are appropriate linear combinations of signal entries (in the above cases, subsets of Fourier coefficients, but others will do) • the sparsity/simplicity condition is sufficiently strong. • we use an appropriate nonlinear reconstruction method. Recently a flood of papers in applied mathematics, information theory, optimization, signal and image processing has explored the implications of this phenomenon, which range from medical imaging to proteomics to radar interference rejection. In some fields – Magnetic Resonance Imaging is an example – undersampling would make it possible to improve patient throughput or even create totally new applications, for example dynamic images of the beating heart or spectroscopic images of the brain [LP07], [LDSP08]. While this is exciting stuff, the reader may feel uneasy. We have abandoned the certainty and simplicity of the usual sampling theory for the vagueness of uncharted territory: undersampling. What can replace the sampling theorem in this setting? In this paper, we describe a range of recent work [Don06b], [Don04], [DT05b], [DT05a], [DT09a], [DT10a] on what we here call undersampling theorems. Such theorems conclude we may reconstruct perfectly while making fewer measurements than the usual sampling theorem, provided we may exploit sparsity or simplicity. While involving relatively sophisticated notions in combinatorial geometry – which we downplay here – such theorems give precise information about the tradeoff of sparsity for undersampling which underlies the three phenomena discussed above. To give an idea where we are headed, here is a sample result, from Section V. Informally, for (k, n, N ) large, k � N , both (P1) and (LP) exactly reconstruct k-sparse signals of length N from n measurements provided n & 2k · log(N/n); but for n appreciably smaller, both fail. To properly understand and interpret this result of Section V requires, naturally Sections II through IV. In Section II we introduce the notion of phase transition and show how this offers the correct framework for undersampling theorems in this new setting. In Section III we explain theory which allows precise derivation of phase transitions and hence can be interpreted as providing the required undersampling theorems in the case of large N . This section may be skipped
3
on first reading. In Sections IV and V we descibe implications of this theory for small N and for extreme undersampling n/N very small. Sections VI and VII describe the broad range of types of sensing matrices A where our undersampling theorems apply precisely. Section X mentions popular analysis tools which have yielded loose undersampling theorems. Sections IX and XI briefly mention what is known about undersampling theorems and phase transitions for properties besides exact reconstruction and for algorithms besides the three already mentioned. Section XII finishes the paper with a list of challenges remaining in this area. We also catalog some exceptions which have been discovered and which can be quite interesting.
1
We now develop a systematic framework for understanding the undersampling phenomena of the introduction. We conducted extensive computational experiments over the last few years, systematically attempting to find sparse solutions to a large variety of systems y = Ax which possess sparse solutions. Each such system has the form y = Ax0 where x0 is an N -vector with having k nonzeros, and A is an n × N matrix. We regard y as information measured from the object x0 and A as the measurement matrix. A problem instance is a pair (y, A). In the basic experimental unit, we present a problem instance – but not the underlying object x0 – to an algorithm and evaluate whether it can reconstruct x0 to within a specified accuracy, producing a score of ‘success’ or ‘failure’ on that instance. Consider an experiment generalizing Example 1 of the introduction. We generate the n × N matrix A of a problem instance by taking n rows at random from the N × N Fourier matrix. We generate a random N -vector x0 by picking k sites at random in 1, . . . , N and randomly place ±1’s in those sites; all other entries in x0 are zero. We then present this problem instance to a convex optimization routine for solving the `1 minimization problem (P1 ), and record a success if the solution agrees with x0 to relative error 10−6 . The whole experiment considers many such problem instances varying several parameters with replications. We consider N = 1600 and vary n systematically through a grid ranging from n = 160 up to n = 1440 in 9 equal steps. At each combination N, n, we vary k systematically from 1 to n. Finally, at each combination N, n, k we consider M = 200 different problem instances x0 and A, each one drawn randomly as above. We end up with data (N, n, k, M, S) where S is the number of successes in M trials. It is very convenient to display results graphically with a standard set of undersampling/sparsity coordinates: δ = n/N and ρ = k/n. δ measures the degree of determinacy/indeterminacy of the system: 0 < δ ≤ 1, with δ = 1 meaning the matrix A is square and so the system y = Ax is well-determined, while δ � 1 meaning the matrix A is very wide and the system y = Ax is very underdetermined. Equivalently δ is the undersampling factor: δ = 1 indicates marginal undersampling while δ � 1 means high undersampling. ρ
0.90
0.8
0.7
0.6
0.90
0.50
ρ=k/n
0.5
0.4
0.50 0.10
0.3 0.10 0.2
0.1
0
II. P HASE D IAGRAMS AND P HASE T RANSITIONS
Red: 0.1 Green: 0.5 Blue: 0.9 Black: Asymptotic
0.9
0
0.1
0.2
0.3
0.4
0.5
δ=n/N
0.6
0.7
0.8
0.9
1
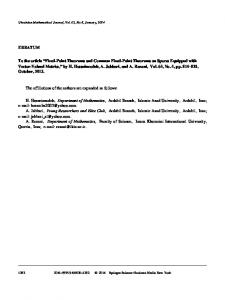
Fig. 2. Empirical Phase Transitions for Undersampling. Lower set of curves: level curves of success probabilities S/M for Experiment 1 at values 0.1 (red), 0.5 (green), and 0.9 (blue); ρ(δ; C) overlaid in black is in close agreement with the 0.5 level curve, partially obscuring it. Higher set of curves: level curves of success probabilities S/M for Experiment 2 at values 0.1 (red), 0.5 (green), and 0.9 (blue); ρ(δ; T ) overlaid in black is in close agreement with the 0.5 level curve, partially obscuring it.
measures the sparsity and/or density of the object x0 to be recovered: ρ close to zero means the vector is very sparse, ρ close to 1 means it is almost fully dense. We call the domain (δ, ρ) ∈ [0, 1]2 the undersampling/sparsity phase space. Figure 2 portrays results from the experiment just described; three colored curves indicate level sets of S/M , the fraction of successful reconstructions at (n/N, k/n); success rates of 90%, 50% and 10% are indicated by the lower set of blue, green, and red curves respectively. There are two clear phases: one where the fraction of success is essentially one and another where the fraction of success is essentially zero. In between these phases is a narrow transition zone where the fraction of success drops from 1 to 0. (The width of the transition region between two level curves decays as n−1/2 as the problem size increases [DT10a].) The plot is decorated with a curve in black (lower) showing a function ρ(δ; C) derived from combinatorial geometry and discussed in the next section. Evidently the black curve agrees closely with the green 50% success curve; it thus separates the diagram into two phases, and accordingly we call the display a phase diagram. In short, the experimental data exhibit the phenomenon of phase transition; the phase transition occurs at a theoreticallyderived location k ≈ nρ(n/N ; C). Now since A is in effect sampling information about x0 and we definitely succeed in reconstructing x0 for k/n below ρ(n/N ; C), the theoretical curve ρ(δ, C) can be called the phase transition boundary for this situation. It gives precise guidance on the number of samples needed to reconstruct x0 with high probability. The reader now has an explanation of our title: an undersampling theorem in this arena of trading off indeterminacy for sparsity is quite simply a mathematical derivation of the location of a phase transition. The phenomenon is far broader than this one experimental result.
4
More generally, we may consider other suites of problem instances. In such a suite, the matrix A is drawn from a specific matrix ensemble E. The introduction considered either deterministic or random submatrices of the N × N Fourier matrix, but many other ensembles are possible. In such a suite, the coefficient vector x0 is drawn from a specific coefficient ensemble C. In the introduction, we considered three ensembles: k-sparse vectors with nonnegative entries, or k-sparse vectors with nonzeros having both signs, and k-simple vectors, i.e. vectors bounded between 0 and 1, with all but k entries either 0 or 1. Finally, we can consider various reconstruction algorithms; in the introduction we reconstructions solved (P1) (LP), and (Feas) respectively. The second argument in the phase transition boundary curves ρ(δ; Q) denotes a priori information about the signal model, with C, T, and I associated with the models discussed in Experiments 1-3 respectively and the associated reconstruction solvers (LP), (P1) and (Feas) respectively. The choice of this notation will be discussed in Section III. Figure 2 also presents a variant on Example 2 of the introduction, where we replace a specific partial Fourier matrix by a random matrix. It shows the case where A is a Bernoulli matrix with entries independently chosen by tossing a fair coin having signs labelled 0 and 1, the coefficients are either zero or 1 and the coefficient vector has k nonzeros. The reconstruction algorithm is to solve (LP). The upper set of blue, red, and green curves in this figure display the 90%, 50%, and 10% success fraction S/M as function of undersampling rate δ and sparsity ρ. The upper black curve displays a function ρ(δ; T ) again derived from combinatorial geometry, also to be defined in the next section. The experimental data again exhibit a phase transition at a theoretically-derived location k ≈ nρ(n/N ; T ) – but at a new location, as ρ(δ; T ) > ρ(δ; C). We have a new undersampling theorem offering precise guidance on the number of samples needed to reconstruct a nonnegative vector. Example 3 of the introduction could be elaborated in a similar fashion. In such an experiment, A is a Gaussian matrix, with entries independently chosen from the standard Normal distribution N (0, 1). The coefficients are bounded between 0 and 1 and with all but k of them randomly assigned to be either 0 or 1, the other k are chosen from a uniform distribution. We call such vectors k-simple. The reconstruction solves (Feas). We could at this point display experimental results showing the expected success fraction S/M as function of undersampling rate δ and sparsity ρ; but as the expectation of S/M can be explicitly calculated we skip the computational experiment entirely. Again there are two phases, separated by the curve ρ(δ; I) := max(0, 2 − δ −1 ) also derived from combinatorial geometry; see the blue curve in Figure 3. We again have a phase transition at a theoretically-derived location k ≈ nρ(n/N ; I) – but at a new location. We have a new undersampling theorem offering precise guidance on the number of samples needed to reconstruct a k-simple, bounded vector. We speak of undersampling theorems, but theorems usually come with formal hypotheses and conclusions. We decided to give the reader a specific experimental setup before going into theoretical issues, as we will below. Also, the reader may
suspect we are engaging in bait-and-switch tactics – starting out in the introduction with partial Fourier matrices – having a well-defined meaning to engineers – but now substituting various random matrices. Actually the phenomena we discuss are quite general and would be the same for many classes of matrices – exceptions will be explicitly noted. III. C OMBINATORIAL G EOMETRY We now discuss the mathematical underpinnings of the undersampling theorems ρ(δ; Q) for Q = T, C, I; including the black curves of Figure 2. While this material is what gives rigor to the notion of undersampling theorem, it is far more abstract than everything else in this article. We have written the paper in such a way that this section may be skipped on first reading. A. Polytope Terminology Let P be a convex polytope in RN , i.e. the convex hull of points p1 , . . . , pm . Let A be an n × N matrix. The image Q = AP lives in Rn ; it is a convex set, in fact a polytope; the convex hull of points Ap1 , . . . , Apm . Q is the result of ’projecting’ P from RN down to Rn and will be called the projected polytope. The polytopes P and Q have vertices, edges, 2-dimensional faces, ... . Let fk (P ) and fk (Q) denote the the number of such k-dimensional faces, thus f0 (P ) is the number of vertices of P and fN (P ) the number of facets, while f0 (Q) the number of vertices and fn (Q) the number of facets. Projection can only reduce the number of faces, so fk (Q) = fk (AP ) ≤ fk (P ),
k ≥ 0.
Three very special families of polytopes P are available in every dimension N > 2, the so-called regular polytopes: • The simplex (an (N − 1)-dimensional analog of the equilateral triangle) ( ) n X N −1 N T := x ∈ R | xi = 1, xi ≥ 0 , (III.1) i=1 •
•
The hypercube (an N -dimensional analog of the cube) � I N := x ∈ RN | 0 ≤ xi ≤ 1 , (III.2) and the cross-polytope (an N -dimensional analog of the octahedron) ( ) n X C N := x ∈ RN | |xi | ≤ 1, . (III.3) i=1
B. Connection to Underdetermined Systems of Equations The regular polytopes are simple and beautiful objects, but are not commonly thought to be useful objects. However, their face counts reveal solution properties of underdetermined systems of equations. Such underdetermined systems arise frequently in modern applications and the existence of unique solutions to such systems is responsible for the three surprises given in the introduction. Consider first the case of the simplex.
5
Consider the underdetermined system of equations y0 = Ax, where A is n × N , n < N . Of course, ordinarily, the system has an infinite number of solutions as does the problem (LP) . Lemma 3.1: Suppose the columns of A are in general position in RN and that the left hand side y0 of the system has a sparse solution y0 = Ax0 where x0 ≥ 0 has k nonzeros. Among all systems (y0 , A) of this form, the fraction of systems where (LP) has the associated x0 as its unique solution is f raction{Reconstruction using (LP) } =
fk (AT N −1 ) . fk (T N −1 )
In short, the ratio of face counts between the projected simplex and the unprojected simplex gives the probability that (LP) reconstructs the x0 associated with (y0 , A) given that Ax = y0 admits a nonnegative k-sparse solution. Consider next the case of the cross-polytope. Consider the optimization problem (P1) applied to the problem instance (y0 , A) generated by an underdetermined system of equations y0 = Ax0 , where A is n × N , n < N . Of course, ordinarily, both the linear system and the problem (P1) have an infinite number of solutions. Lemma 3.2: Suppose the columns of A are in general position in RN and that the left hand side y0 of the system has a sparse solution y0 = Ax0 where x0 has k nonzeros. Among all systems (y0 , A) of this form, the fraction where (P1) has the associated x0 as its unique solution is f raction{Reconstruction using (P1) } =
fk (AC N ) . fk (C N )
In short, the ratio of face counts between the projected crosspolytope and the unprojected cross-polytope gives the probability that (P1) reconstructs the x0 associated with (y0 , A) given that Ax = y0 admits a k-sparse solution. Consider now the case of the hypercube. Consider the feasibility problem (Feas), on a problem instance (y0 , A) with an underdetermined system of equations y0 = Ax, where A is n × N , n < N . Again, ordinarily the linear system and the problem (Feas) have an infinite number of solutions. Lemma 3.3: The columns of A are in general position in RN and the left hand side y0 of the system has a simple solution y0 = Ax0 where x0 has at most k values which are strictly between the bounds [0, 1]. Among all instances (y0 , A) of this kind, the fraction of systems where (Feas) has the associated x0 as its unique solution is f raction{Unique Solution to (Feas) } =
fk (AI N ) . fk (I N )
In short, the ratio of face counts between the projected hypercube and the unprojected hypercube gives the probability that (Feas) has an unique solution given that it has at least a k-simple solution. In short, it is essential to know whether or not fk (AQ) ≈1 fk (Q) for Q in the three families of regular polytopes.
1 T C I
0.9
0.8
0.7
0.6
ρ=k/n
0.5
0.4
0.3
0.2
0.1
0
0
0.1
0.2
0.3
0.4
0.5
δ=n/N
0.6
0.7
0.8
0.9
1
Fig. 3. Three Asymptotic Phase Transitions. ρ(δ; Q) for Q = T (green), Q = C (red), and Q = I (blue).
C. Asymptotics of Face Counts with Gaussian Matrices A How does one actually find the face counts mentioned in the above three lemmas? Consider the case where the n by N matrix A has iid Gaussian random entries, and N and n are both large. Then the mapping Q 7→ AQ is a random projection. In this case, rather amazingly, tools from polytope theory and probability theory can be combined to study the expected face counts in high dimensions. The results demonstrate rigorously the existence of sharp thresholds in face count ratios. Theorem 1: [DT05a], [Don06b], [DT09a], [DT10a] Let the n × N random matrix A have iid N (0, 1) Gaussian elements. Consider sequences of triples (N, n, k) where n = δN , k = ρn, and N → ∞. There are functions ρ(δ; Q) for Q ∈ {T, C, I} demarcating phase transitions in face counts: � fk (AQ) 1 ρ > ρ(δ, Q) lim = 0 ρ < ρ(δ, Q). N →∞ fk (Q) Figure 3 displays the three curves referred to in this theorem. One can see that the simplex has the ’highest’ transition, and the hypercube the ’lowest’. To the authors, even after some time, it still seems surprising that a sharp phase transition can be observed experimentally and that anything at all can be proven. In fact many phase transition phenomena are observed in statistical physics, but rigorous results are very rare. Our approach relies on fundamental contributions made by Affentranger and Schneider [AS92] and by Vershik and Sporyshev [VS92] in combinatorial geometry which, to say the least, seem quite remote from the sampling theorem! IV. F INITE -N U NDERSAMPLING T HEOREMS The phase transitions ρ(δ, Q) discussed in Section II, and made precise by Theorem 1, describe the situation N → ∞. There are also finite-N results. The most explicit are for (Feas); [DT10a] gives an exact formula for the expected fraction of successes as a function of undersampling, sparsity, and
6
where R(�, n, N ) := 2[n−1 log(4(N + 2)6 /�)]1/2 . Evidently, this bound is asymptotically precise: it approaches the phase transition with increasing N .
1 N=400 N=1600 N=6400 N→∞
0.9
0.8
0.7
V. A SYMPTOTICS AS δ → 0
0.6
The blue curve ρ(δ; I) in Figure 3 vanishes below δ = 1/2. Informally, we cannot undersample by more than a factor two in this situation, no matter how simple we know the object to be! This will be satisfying to readers with a pessimistic nature. Much more surprising is the fact that the red and green curves in Figure 3 stay positive whenever δ > 0: there is no hard limit on undersampling. For any given degree of undersampling, there is a precise sparsity level at which such undersampling leads to valid reconstructions. Readers with an optimistic nature may be inspired to attempt ambitious undersampling applications. Thus, stimulated by the notion of compressed sensing, we have heard scientists working in MRI announce successful use of undersampling by a factor 8, but optimistically announce efforts to undersample by much larger factors. The benefits for advanced medical research and someday to patients and doctors would be considerable. What do the red and green curves in Figure 3 say about the possibility of undersampling at very high factors? Careful mathematical analysis gives the following. Theorem 3: [DT09a]
ρ=k/n
0.5
0.4
0.3
0.2
0.1
0
0
0.1
0.2
0.3
0.4
0.5
δ=n/N
0.6
0.7
0.8
0.9
1
(a) 1 N=400 N=1600 N=6400 N→∞
0.9
0.8
0.7
0.6
ρ=k/n
0.5
0.4
0.3
ρ(δ; C) ∼ [2 log(1/δ)]−1 ,
δ → 0.
0.2
−1
ρ(δ; T ) ∼ [2 log(1/δ)]
,
δ → 0.
0.1
0
0
0.1
0.2
0.3
0.4
0.5
δ=n/N
0.6
0.7
0.8
0.9
1
(b)
Informally, we can reconstruct a k-sparse object from n samples provided k . n/(2 log(N/n)).
Fig. 4. Undersampling Guarantees, Finite-N . Panel (a): Curves below which (LP) is guaranteed to successfully recover at least 99% of problem instances provided N ≥ 400 (blue), N ≥ 1600 (green), or N ≥ 6400 (red); Panel (b): Curves below which (P1) is guaranteed to successfully recover at least 99% of problem instances provided N ≥ 400 (blue), N ≥ 1600 (green), or N ≥ 6400 (red). As N increases the finite-N bounds approach the black curves ρ(δ, Q) for Q = T in Panel (a) and Q = C in Panel (b).
More precise formulas, effective in finite samples, are available in [DT10b]. One remarkable aspect of this theorem: the value of positivity constraints, so evident at moderate undersampling factor δ in Figures 2 and 3, evaporates at extreme undersampling. VI. U NIVERSALITY ACROSS M ATRIX E NSEMBLES
problem size, n−k−1 X �N − k − 1� Efk (AI N ) −N +k+1 = 2 . fk (I N ) ` `=0
For (LP) and (P1) [DT10b] gives bounds on expected success fractions for A from the Gaussian ensemble. These bounds generate a family of curves, indexed by N , bounding a region where the expected success fraction exceeds 1−�. Such curves are displayed in Figure 4 for � = 1/100, N0 = 400 (blue), N0 = 1600 (green), and N0 = 6400 (red). Here is a simple formula providing useful bounds: Theorem 2: [DT10b] Let the n × N random matrix A have iid N (0, 1) Gaussian elements. Consider sequences of triples (N, n, k) where n = δN , k = ρn, and N ≥ N0 . (LP) and (P1) will successfully recover at least 1 − � fraction of the problem instances provided n > k/ρ(δ, Q) · (1 − R(�, n, N ))−1 ,
The theory discussed so far assumes that the matrix A has Gaussian iid entries. However, Section II showed that the theory correctly located phase transitions for nonGaussian ensembles. There is existing theory proving rigorously that some nonGaussian matrix ensembles offer phase transitions at the same place as Gaussian ones. In other cases, there is massive empirical evidence that they do. In this subsection we mention some theory. First, we note that, for any nonsingular n × n matrix B, the problem instances (y, A) and (By, BA) both lead to success or failure identically the same. In particular, if we suppose that A has linearly independent rows (happens with probability 1 at the Gaussian ensemble) then setting B = (AA0 )−1/2 the matrix A0 = BA yields a random orthoprojector RN 7→ Rn . In fact A0 is uniformly distributed on the space G(N, n) of orthoprojectors. We see what was already implicit in Section III: all results for random orthoprojectors are identical to those for Gaussian iid matrices.
7
Second, we note that the blue curve ρ(δ, I) is quite generally applicable. Suppose we consider problem (Feas) where x0 is chosen randomly from the ensemble with k entries chosen at random having arbitrary values strictly interior to (0, 1) and the other N −k entries equal to 0 or 1, with the choice between these being made independently and equally likely. Then the probability that x0 will be unique solution to (Feas) is exactly the same for every matrix A with nullspace ker(A) in general position with respect to the coordinate axes. In a clear sense, for problem (Feas), almost every fixed matrix behaves like a Gaussian random matrix. These two results are the main theoretical information known at this time; however, as Section II showed, the phenomenon is much broader. VII. E MPIRICAL R ESULTS FOR N ON G AUSSIAN E NSEMBLES Over the last few years we ran thousands of computer experiments in which we set up specific underdetermined systems of equations of various kinds, ran standard optimization tools to select specific solutions, and checked whether the solution was unique and/or sparse. The bulk of this effort has found results in line with the narrative in this paper so far. In most cases, calculations derived from Gaussian polytope theory accurately match the actual outcomes of our experiments, even though the matrices involved are not Gaussian To illustrate this point, we quote results from [DT09b] concerning several random matrix ensembles: • Gaussian iid. A has standard normal entries. • Partial Fourier. A is a random n by N matrix formed by selecting n rows at random from the N by N Fourier matrix. • Partial Hadamard. A is a random n by N matrix formed by selecting n rows at random from the N by N Hadamard matrix. • Rademacher. A is a random n by N matrix with matrix entries ±1 equiprobable. • Bernoulli. A is a random n by N matrix with matrix entries 0 and 1 equiprobable. • Random Sparse Expander Graphs. A is a random n by N matrix with nonduplicative columns having bp·nc entries equal to one and all other entries equal to zero. • Random Ternary. A is a random n by N matrix with matrix entries {0, ±1} and both nonzeros equiprobable; the chance of a nonzero being p. We either generated nonnegative sparse vectors, and solved (LP) or general sparse vectors, with both positive and negative entries, and solved (P1); and we studied a wide range of undersampling factors δ = n/N , and sparsity levels ρ = k/n. Figure 5 presents results from [DT09b] , showing the level curves for 50% frequency of exact reconstruction, for each of the 7 ensembles above. The appropriate theoretical curves ρ(δ; Q) are overlaid. The Uppermost seven curves present the data for the nonnegative case, Q = T , solve (LP) ; and the seven lower curves present the data for Q = C, with (P1) solved. At problem size N = 1600 and we varied n systematically through a grid ranging from n = 160 up to
1 Gaussian Bernoulli Fourier Ternary p=2/3 Ternary p=2/5 Ternary p=1/10 Hadamard Expander p=1/5 Rademacher ρ(δ,Q)
0.9
0.8
0.7
0.6
ρ=k/n
0.5
0.4
0.3
0.2
0.1
0
0
0.1
0.2
0.3
0.4
0.5
δ=n/N
0.6
0.7
0.8
0.9
1
Fig. 5. Empirical Universality: N = 1600. 7 Upper curves: level curves for 50% success rate of (LP) reconstruction under 7 random matrix ensembles. Asymptotic phase transition ρ(δ; T ) is overlaid in black. 7 Lower curves: level curves for 50% success rate of (P1) under 7 random matrix ensembles. Asymptotic phase transition ρ(δ; C) overlaid in black. The 50% success rate level curves are largely obscured by the asymptotic limit ρ(δ; Q) proven for the Gaussian ensemble, not deviating by more than 2 × 10⁻² for this value of N , and agreeing even more accurately for larger values of N [DT09b].
n = 1440 in 9 equal steps. At each combination N, n, we varied k systematically from 1 to n. For each k, the location of the nonzeros in x0 are drawn uniformly at random from the permutations of 1, 2, . . . , N . Finally, at each combination N, n, k we considered M = 200 different problem instances x0 and A, each one drawn randomly as above. We end up with data (N, n, k, M, S) where S is the number of successes in M trials. Further details are given in [DT09b]. We see very good agreement between the empirical results for each of the matrix ensembles, and the asymptotic theory. This is not surprising for Gaussian A: it simply demonstrates that the large-N theory works accurately already for moderate N . For the nonGaussian ensembles (besides uniformly distributed random orthoprojectors) the fact that phase diagram behavior matches the Gaussian case goes far beyond current theory. [ALTJ09] proves that, for a range of random matrix ensembles with independent identically distributed entries, there is a region in the phase diagram where the expected success fraction tends to one. It has not yet been proven that this region matches the region for the Gaussian. VIII. K NOWN E XCEPTION While some large family of matrix ensembles follows the same phase transitions as the Gaussian ensemble, there is one phase transition proven to be better than the Gaussian ensemble. It was mentioned already in Example 2 of the Introduction. One observes merely the n = 2k + 1 lowest frequencies of a nonnegative sequence solving (LP) yields exact reconstruction. This corresponds to exact reconstruction below ρ = 0.5 at every δ > 0. At extremely high undersampling, i.e. small δ, this is dramatically larger than all other transitions which have been observed – compare with the blue curve ρ(δ; T ) for the Gaussian case; as we have seen, ρ(δ, T ) ∼ (2 log(1/δ))−1 which is much smaller than 1/2 at small δ.
8
This amazing behavior is quite special, limited to the case were the coefficients of the object x0 are known to be nonnegative and arises from the theory of neighborly polytopes see eg. [DT05a] and citations there. For the case where x0 has both positive and negative signs, Barvinok and Novik [BN08] proposed that a related A matrix would have good properties, however, in our own extensive empirical tests, it closely matches the Gaussian. IX. P HASE T RANSITIONS FOR OTHER P ROPERTIES We discussed so far only one question: does exact reconstruction occur for typical individual problem instances? At base we are considering the triples (k, n, N ) where face counts obey fk (AQ) = 1 + o(1), fk (Q) as (k, n, N ) grow large. Here Q is one of the polytopes underlying our chosen algorithm. In fact, we can ask other questions and observe other phase transitions. This exact reconstruction may hold, with a given A for all problem instances of a given sparsity. Such a matrix A can be used repeatedly as a sensing matrix and will permit exact reconstruction every time the problem instance has a k-sparse solution. This has a combinatorial geometry interpretation: the matrix A yields face counts obeying fk (AQ) = fk (Q); the face counts are not just close, but actually equal. This condition is equivalent to the null-space condition, T ∀z such that Az = 0, and ∀x on any k-face of Q, {x + z} Q = x. This more stringent condition has also been studied in [Don06b], [DT05a], [DT09a], [DT10a], and undersampling theorems exist for this case as well. We call the phase transitions for this property the strong transition, in distinction to the earlier ones which we also call the weak transition. Modifying notation to accommodate the new notion, these transitions occur at curves ρ(δ; C, strong) and ρ(δ; T, strong) which are ‘below’ their weak counterparts: ρ(δ; Q, strong) < ρ(δ; Q, weak). Moreover, there is no strong transition for Q = I N and there is no strong undersampling theorem: ∀δ ∈ (0, 1).
ρ(δ; I, strong) = 0,
We may consider approximate sparsity; say that a vector x is (k, �)-sparse if there is a subset J of cardinality k such that X X |x(j)| < � |x(j)|. Jc
J
Ordinary sparsity is the case where � = 0. Xu and Hassibi [XH08] have announced asymptotically precise undersampling theorems assuming (k, �)-sparsity. They show in a region of the phase diagram, (P1) approximately recovers a k-sparse approximation to an approximately sparse vector, with specified approximation error in `1 norm proportional to �. Their region is bounded by a curve ρ� (δ; C) depending on � > 0. They show that ρ� (δ; C) → ρ(δ; C) as � → 0, with ρ(δ; C) as in
Section III. Xu and Hassibi’s result shows that undersampling is a robust phenomenon: there is no ’qualitative gap’ between what is true for approximate sparsity and what is true for strict sparsity. Following the submission of this article, Stojnic [Sto09] presented an alternative derivation of ρ(δ; Q, weak) for Q = T, C as well as somewhat different thresholds ρ(δ; Q, strong) for Q = T, C. This alternative derivation focuses on the null-space condition rather than the equivalent polytope condition. Martin Wainwright [Wai09] has obtained phase transition results for a different property and slightly different problem set up. In a notation consistent with our paper, he considers the case y = Ax + �z where z is a random noise (for example Gaussian iid noise) and � > 0 is a noise level parameter. Since noise is present, we can no longer expect exact reconstruction. Wainwright’s goal is to identify triples (k, n, N ) where a given algorithm reconstruct with nonzeros only at the correct positions. He shows that the best achievable boundary is n , k.p 2 log(N − k) when (k, n, N ) are all large. Below this boundary, support recovery occurs with overwhelming probability and above this boundary is fails. Note that this boundary does not allow the sparsity control parameter k to be of size c · n; instead it must be of size o(n), because of the log term. In comparison, all other results in this paper allow on a scale cn, where c = ρ(n/N ) for a specified ρ(δ). Wainwright has now compiled transition information for several interesting algorithms; it is interesting to see how the transition varies depending on the noise and the algorithm. X. OTHER U NDERSAMPLING T HEOREMS Many undersampling theorems exist; though mostly they cannot be considered precise undersampling theorems, as they do not explain precisely the boundary between success and failure for given algorithms and typical problem instances. We briefly discuss the situation for `1 minimization which is the single most studied algorithm up to now. The earliest undersampling theorems were based on √the notion of coherence and covered only cases where k < n, [DH01], [EB02], [Fuc05], [GN03], [DE03], [Tro04] which is much weaker than the ≈ ρn we know to be descriptive of actual performance (this was already discussed and demonstrated in [DH01]) Cand`es, Romberg and Tao [CRT06a] improved the situation in the setting of Example 1 to k . cn/ logθ (N ) for θ = 6 which is still short of typical behavior; Donoho [Don06a], Cand`es and Tao [CT05] and Rudelson Vershynin [RV08] studied Gaussian matrices and/or random orthoprjectors and finally pushed the situation to k . cn, but without precise information about the the dependence of c on n/N or, in fact whether the transition was sharp. The approach developed in [CT05] – so called Restricted Isometry Property (RIP) – became very popular, and a very large number of articles in the last 5 years use it in a wide variety of problems. However the RIP approach is seemingly not precise. Blanchard, Cartis and Tanner [BCT08] have determined the most precise bounds known on the needed RIP constants and have
9
0.18
found that, for bounding the strong transition for matrices from the Gaussian ensemble, the best known bounds based upon the RIP are substantially below the precise boundary (derived via polytope theory) and even lower than the method of Rudelson and Vershynin, see Figure 6(a). XI. OTHER S PARSIFYING A LGORITHMS
ρ(δ;C,strong) Rudelson & Vershynin Foucart & Lai
0.16
0.14
0.12
0.1
ρ
0.08
We so far discussed phase transitions for three algorithms: (LP), (P1), and (Feas). But phase transitions have been observed for many other algorithms by many researchers and are commonly displayed in talks at conferences. [DTDS08], [DT08], [MD], [NT09], [DM09], [BD09], [JXHC08], [BGI+ 08] consider algorithms running much faster than do standard solvers for (P1). Those algorithms do not solve any standard optimization problem; however, they do provide reasonably good transitions. Phase transitions occur for other properties of algorithms. [DT08] showed that the homotopy/LARS/LASSO algorithms for solving (P1) exhibit phase transitions in operation counts. Below an empirically observed curve in sparsity/undersampling phase space, the algorithms run much more rapidly than they do above that curve. This empirical curve approximates the red curve ρ(δ; C) in Figure 3. At the moment no theory accurately derives formal expressions matching empirical observations for algorithms besides the central three discussed above. (The theory in [DTDS08] is semi-empirical. In the noisy case, Wainwright and coauthors [Wai09], [OWJ] derive formal expressions for various algorithms which match experiments, however, for the support reconstruction property, not the recovery property). What has been proven for most algorithms is far weaker than what typically happens. The most popular analysis technique works with the RIP constants of the sensing matrix A; a typical result has the form “if the RIP constants of A are appropriately bounded, this algorithm exactly reconstructs”. The RIP constants can in principle be obtained once the matrix A is specified; however, computing the RIP constants seems to require a massive combinatorial enumeration, and has an air of impossibility. Currently no large deterministic matrices are known to have useful RIP constants. Large Gaussian random matrices do typically have useful RIP constants. Using the best known bounds on RIP constants for Gaussian random matrices, [BCTT09] is able to reinterpret several well-known recovery results implied by RIP assumptions. The reinterpretations provides lower bounds on the phase transition location for some popular algorithms. As Figure 6 shows, the RIP based results, even with the best known constants, are much weaker than the results we have seen in Figure 3. It would be interesting to know weather this gap is caused by intrinsic properties of the algorithm, or by slack in the method of analysis, or by a combination of both. A similar analysis of the RIP(1) used in [BGI+ 08] and [JXHC08] for expander graphs has not been conducted.
0.06
0.04
0.02
0
We propose the following challenges:
0.1
0.2
0.3
0.4
0.5
δ
0.6
0.7
0.8
0.9
1
0.6
0.7
0.8
0.9
1
(a)
−3
x 10 1.2
IHT SP CoSaMP
1
0.8 ρ 0.6
0.4
0.2
0 0
0.1
0.2
0.3
0.4
0.5 δ
(b)
Fig. 6. Bounds on Phase Transitions implied by RIP. Panel (a): Lower bounds on the strong phase transition for (P1) with A having Gaussian normal entries; from top to bottom: ρS (δ; C, strong) from [Don06b], [Don04] (black) derived by counting faces of AC, Rudelson and Vershynin [RV08] (green) derived using covering properties from geometric functional analysis, and Foucart and Lai [FL09] (blue) implied by the RIP; Panel (b): Lower bounds on the strong phase transition for A having Gaussian normal entries, using the following algorithms [BCTT09]; from top to bottom: Iterated Hard Thresholding (red) [BD09], Subspace Pursuit (magenta) [DM09], and CoSaMP (black) [NT09].
A.
B.
C. XII. R ESEARCH CHALLENGES
0
Characterize Universality classes of Gaussian Phase Transitions. We have shown that many ‘random’ matrix ensembles yield phase transitions matching those of Gaussian matrices. Characterize the precise universality class of such matrices. Discover New Transitions for (LP) and (P1) Many but not all matrix ensembles yield phase transitions matching those of Gaussian matrices. Discover more examples which don’t, and which are also interesting matrix ensembles, either because the phase transition is better or because the matrix is explicit and deterministic. Discover an analog of Example 1 (n = 2k + 1) for the signed case. If there is no such analog, characterize the best achievable performance and the matrices which achieve it.
10
D.
E.
F.
Discover an analog of Example 1 for the 2D case. If there is no such analog, characterize the best achievable performance and the matrices which achieve it. Derive phase transitions of new algorithms. Discover formal theory which precisely locates phase transitions that have been observed for other algorithms Derive phase transitions for Accurate Recovery in Noise. When noise is present we can no longer expect exact reconstruction, but we can expect stable recovery (error at most proportional to noise level). phase transitions have been observed empirically for such properties. Formal results would give undersampling theorems in noise. Derive such results. R EFERENCES
[ALTJ09] R. Adamczak, A. E. Litvak, and A. Pajor N. Tomczak-Jaegermann. Compressed sensing matrices with independent columns and neighborly polytopes by random sampling. Technical report, Dept. of Math. and Stat. Sciences, University of Alberta, 2009. [AS92] Fernando Affentranger and Rolf Schneider. Random projections of regular simplices. Discrete Comput. Geom., 7(3):219–226, 1992. [BCT08] Jeffrey. D. Blanchard, Coralia Cartis, and Jared Tanner. The restricted isometry property: quantitative bounds for sparse approximation. submitted, 2008. [BCTT09] Jeffrey D. Blanchard, Coralia Cartis, Jared Tanner, and Andrew Thompson. Phase transitions for greedy sparse approximation algorithms. submitted, 2009. [BD09] T. Blumensath and M. E. Davies. Iterative hard thresholding for compressed sensing. Appl. Comput. Harmon. Anal., 27(3):265– 274, 2009. + [BGI 08] R. Berinde, A. C. Gilbert, P. Indyk, H. Karloff, and M. J. Strauss. Combining geometry and combinatorics: a unified approach to sparse signal recovery. submitted, arXiv:0804.4666v1, 2008. [BN08] A. Barvinok and I. Novik. A centrally symmetric version of the cyclic polytope. Discrete Comput. Geom., 39(1):76–99, 2008. [CRT06a] Emmanuel J. Cand`es, Justin Romberg, and Terence Tao. Robust uncertainty principles: exact signal reconstruction from highly incomplete frequency information. IEEE Trans. Inform. Theory, 52(2):489–509, 2006. [CRT06b] Emmanuel J. Cand`es, Justin K. Romberg, and Terence Tao. Stable signal recovery from incomplete and inaccurate measurements. Comm. Pure Appl. Math., 59(8):1207–1223, 2006. [CT05] Emmanuel J. Candes and Terence Tao. Decoding by linear programming. IEEE Trans. Inform. Theory, 51(12):4203–4215, 2005. [DE03] David L. Donoho and Michael Elad. Optimally sparse representation in general (nonorthogonal) dictionaries via `1 minimization. Proc. Natl. Acad. Sci. USA, 100(5):2197–2202 (electronic), 2003. [DH01] David L. Donoho and Xiaoming Huo. Uncertainty principles and ideal atomic decomposition. IEEE Trans. Inform. Theory, 47(7):2845–2862, 2001. [DJHS92] David L. Donoho, Iain M. Johnstone, Jeffrey C. Hoch, and Alan S. Stern. Maximum entropy and the nearly black object. J. Roy. Statist. Soc. Ser. B, 54(1):41–81, 1992. With discussion and a reply by the authors. [DM09] W. Dai and O. Milenkovic. Subspace pursuit for compressive sensing signal reconstruction. IEEE Trans. Inform. Theory, 55(5):2230–2249, 2009. [Don04] David L. Donoho. Neighborly polytopes and sparse solution of underdetermined linear equations. Technical Report, Department of Statistics, Stanford University, 2004. [Don06a] David L. Donoho. For most large underdetermined systems of equations, the minimal l1 -norm near-solution approximates the sparsest near-solution. Comm. Pure Appl. Math., 59(7):907–934, 2006. [Don06b] David L. Donoho. High-dimensional centrally symmetric polytopes with neighborliness proportional to dimension. Discrete Comput. Geom., 35(4):617–652, 2006. [DT05a] David L. Donoho and Jared Tanner. Neighborliness of randomly projected simplices in high dimensions. Proc. Natl. Acad. Sci. USA, 102(27):9452–9457 (electronic), 2005.
[DT05b]
David L. Donoho and Jared Tanner. Sparse nonnegative solution of underdetermined linear equations by linear programming. Proc. Natl. Acad. Sci. USA, 102(27):9446–9451 (electronic), 2005. [DT08] David L. Donoho and Yaakov Tsaig. Fast solution of `1 -norm minimization problems when the solution may be sparse. IEEE. Trans. Info. Thry., 54(11):4789–4812, 2008. [DT09a] David L. Donoho and Jared Tanner. Counting faces of randomly projected polytopes when the projection radically lowers dimension. J. AMS, 22(1):1–53, 2009. [DT09b] D.L. Donoho and J. Tanner. Observed universality of phase transitions in high-dimensional geometry, with implications for modern data analysis and signal processing. Phil. Trans. Roy. Soc. A, 367(1906):4273–4293, 2009. [DT10a] David L. Donoho and Jared Tanner. Counting the faces of randomly-projected hypercubes and orthants, with applications. Discrete Comput. Geom., 43(3):522–541, 2010. [DT10b] David L. Donoho and Jared Tanner. Exponential bounds implying construction of compressed sensing matrices, error-correcting codes and neighborly polytopes by random sampling. IEEE Trans. Inform. Theory, 2010. in press. [DTDS08] David L. Donoho, Yaakov Tsaig, Iddo Drori, and Jean-Luc Stark. Sparse solution of underdetermined linear equations by stagewise orthogonal matching pursuit. IEEE Trans. Inform. Theory, 2008. submitted. [EB02] Michael Elad and Alfred M. Bruckstein. A generalized uncertainty principle and sparse representation in pairs of bases. IEEE Trans. Inform. Theory, 48(9):2558–2567, 2002. [FL09] S. Foucart and M.-J. Lai. Sparsest solutions of underdetermined linear systems via `q -minimization for 0 < q ≤ 1. Appl. Comput. Harmon. Anal., 26(3):395–407, 2009. [Fuc05] Jean-Jacques Fuchs. Sparsity and uniqueness for some specific underdetermined systems. In IEEE International Conference on Acoustics, Speech, and Signal Processing, March 2005, Philadelphia, PA., 2005. [GN03] R´emi Gribonval and Morten Nielsen. Sparse representations in unions of bases. IEEE Trans. Inform. Theory, 49(12):3320–3325, 2003. [Jan97] Peter A. Jansson. Deconvolution of Images and Spectra. Academic Press: New York, 1997. [JXHC08] S. Jafarpour, W. Xu, B. Hassibi, and R. Calderbank. Efficient and robust compressed sensing using high-quality expander graphs. submitted, arXiv:0806.3802v1, 2008. [LDSP08] M. Lustig, D.L Donoho, J.M. Santos, and J.M Pauly. Compressed sensing mri. IEEE Signal Processing Magazine, March 2008. [LP07] D. Lustig, M. Donoho and J. M. Pauly. Sparse mri: The application of compressed sensing for rapid mr imaging. MAGNETIC RESONANCE IN MEDICINE, 58(6):1182–1195, 2007. [MD] Arian Maleki and David L. Donoho. Optimally tuned iterative reconstruction algorithms for compressed sensing. IEEE Selected Topics in Signal Processing. in press. [NT09] Deanna Needell and Joel Tropp. Cosamp: Iterative signal recovery from incomplete and inaccurate samples. Appl. Comp. Harm. Anal., 26(3):301–321, 2009. [OWJ] G. Obozinski, M. J. Wainwright, and M. I. Jordan. Support union recovery in high-dimensional multivariate regression. Annals of Statistics. in press. [RV08] Mark Rudelson and Roman Vershynin. On sparse reconstruction from Fourier and Gaussian measurements. Comm. Pure Appl. Math., 61(8):1025–1045, 2008. [Spa] SparseLab. http://sparselab.stanford.edu. [Sto09] M. Stojnic. Various thresholds for `1 -optimization in compressed sensing. submitted, arXiv:0907.3666, 2009. [Tro04] Joel A. Tropp. Greed is good: algorithmic results for sparse approximation. IEEE Trans. Inform. Theory, 50(10):2231–2242, 2004. [VS92] A. M. Vershik and P. V. Sporyshev. Asymptotic behavior of the number of faces of random polyhedra and the neighborliness problem. Selecta Math. Soviet., 11(2):181–201, 1992. [Wai09] Martin A. Wainright. Sharp thresholds for noisy and highdimensional recovery of sparsity using `1 -constrained quadratic programming. IEEE Trans. Inform. Theory, 55(5):2183–2202, 2009. [XH08] Weiyu Xu and Babak Hassibi. Compressed sensing over the grassmann manifold: A unified analytical framework. In Communication, Control, and Computing, September 2008, 46th Annual Allerton Conference on, pages 562–567, 2008.