Nutrient Cycling in Agroecosystems 70: 283–291, 2004. © 2004 Kluwer Academic Publishers. Printed in the Netherlands.
283
Predicting crop residue decomposition using moisture adjusted time scales M. Quemada Departamento de Producción Vegetal: Fitotecnia, E.T.S. Ingenieros Agrónomos, Universidad Politécnica de Madrid, Avd. Complutense s/n, E-28040 Madrid, Spain; (fax: +34-915449983; e-mail:
[email protected]) Received 16 January 2004; accepted in revised form 28 May 2004
Key words: Crop residues, Decomposition, Time scale, Winter cover crops
Abstract Crop residue decomposition is generally described by exponential decay functions with empirically determined decay constants. The most common time scales used are days after application 共DAA兲, degree-days 共DD兲 and decomposition-days 共DCD兲. We propose a new time scale 共corrected degree-days, CDD兲 that reflects the effect of moisture on decomposition by dividing the daily mean temperature by the difference between maximum and minimum temperature. The objectives of this study were to compare the ability of using different time scales to predict biomass decomposition, and to account for the effect of weather conditions on biomass decomposition. Results from a 4-month litterbag study in which crimson clover 共Trifolium incarnatum L.兲, rye 共Secale cereale L.兲, wheat 共Triticum aestivum L.兲, and oats 共Avena sativa L.兲 were allowed to decompose on the soil surface were used to validate the models under field conditions. The first-order exponential model using either DAA, DD, DCD or CDD as time scales was able to properly estimate biomass decomposition. However, only when time was calculated using DCD and CDD methodologies was the model able to account for the effect of weather conditions on residue decomposition. The concept of CDD has several advantages that may justify the use of this time scale in field decomposition studies: the calculation is simple, is exclusively based on climatic conditions, and allows to reflect possible temperature and moisture interactions in decomposition.
Introduction Management of crop residues is a key to sustainability in conservation tillage cropping systems. Cash crops and winter cover crops are the most common source of residues, and when they die they form the characteristic residue layer of no-till systems. This layer affects soil cover, soil structure, soil temperature, nutrient availability, water evaporation, microbial activities, soil-borne diseases, and insect populations 共Unger 1994兲. Soil erosion control and water conservation objectives of reduced tillage require enough surface residue to provide soil cover 共Singh et al. 1990兲. However, if large amounts of residues remain on the soil surface at seeding, yield may decrease due to poor crop establishment 共Jessop and
Stewart 1983; Stroo et al. 1989兲. Therefore, it is important to be able to predict the amount of residue left on the field at any given time for better soil and crop management. The amount depends on the initial quantity and its subsequent decomposition. Residue decomposition is controlled by environmental factors 共mainly temperature and moisture兲 and by residue quality 共Heal et al. 1997兲. Numerous studies have described residue decomposition through exponential decay functions with empirically determined decay constants, the first-order exponential model being the most widely used 共Hunt 1977; Stroo et al. 1989; Schomberg et al. 1994; Quemada and Cabrera 1995兲. Decay constants, also called decomposition rates, have been determined for different crop residues and locations. Decomposition rates integrate
284 the effect of environmental conditions and residue quality, and may vary widely. Approaches that explicitly describe the effect of these factors separately may improve our capability to compare decomposition rates from different residues, locations, and years. This paper studies the effect of the environmental factors on residue decomposition. Most decomposition models were originally developed to study incorporated residues, and the effect of environmental conditions is based on soil conditions 共Andrén and Paiustian 1987; Godwin and Jones 1991兲. Decay constants are modified based on soil temperature and moisture, either measured or predicted from simulation models. However, when residues are surface applied, temperature and moisture conditions in the residue layer differ from those in the soil, and changes in moisture or temperature have a different effect on the decomposition process of crop residues and mineral soil 共Quemada and Cabrera 1997兲. Measurement or prediction of moisture and temperature in the residue layer is very complex, depends on many variables 共thickness of residue layer, degree of decomposition兲 and it is difficult to monitor 共Bristow et al. 1986兲. Hence, a simpler approach using climatic data easily available to develop factors that account for the effect of temperature and moisture on residue decomposition is of general interest. This approach has been used in the residue decomposition submodel of the revised universal soil loss equation 共Shomberg and Steiner 1997兲. Various methodologies have been proposed to account for the effect of air temperature and precipitation on residue decomposition. Honeycut and Potaro 共1990兲 used degree-days 共DD兲 as the time scale in the exponential model to predict C and N mineralization from crop residues. They obtained decomposition rates in which the temperature factor was already integrated, and expressed in heat units 共DD兲. As DD is used to predict crop development, this approach also allows to match soil and crop processes, and has been used by other researchers 共Douglas and Rickman 1992; Ma et al. 1999; Ruffo and Bollero 2003兲. Stroo et al. 共1989兲 proposed the calculation of decomposition days 共DCD兲 based on the minimum of a temperature and a moisture factor. Steiner et al. 共1999兲 proposed to calculate DCD from daily temperature and precipitation data, and used cumulative DCD as the time scale in the first-order exponential model of decomposition rate. As DCD includes the effect of precipitation, it is supposed to reflect adequately the effect on decomposition rates due to dif-
ferences in environmental conditions between locations and years. We propose a new time scale that reflects the effect of moisture on decomposition by dividing the daily mean temperature by the difference between maximum and minimum temperature. The oscillation between maximum and minimum temperature is smaller when vapour pressure is high, therefore, rainy days are characterized by a low oscillation 共Hargreaves and Samani 1985兲. This relationship is stronger in non-oceanic climates, but it can be generalized across a wide range of climatic conditions. Dividing the daily mean temperature by the oscillation may allow to increase the relative weight of rainy days in decomposition. The new time scale is defined as ‘corrected degree-days’ 共CDD兲. The objectives of this study were to compare the ability of using cumulative DAA, DD, DCD and CDD as time scale 共i兲 to predict biomass decomposition, and 共ii兲 to account for the effect of weather conditions on biomass decomposition.
Materials and methods Data from a litterbag decomposition study conducted during 1992 and 1993 were used to compare model performance under field conditions. Sixteen microplots 共3 ⫻ 2 m兲 were established in an area mapped as Cecil sandy loam 共clayey, kaolinitic, thermic, Typic Kanhapladult兲 to study the decomposition of clover, rye, wheat and oat residues in four replications. The soil had a pH 共1 g soil/2 ml H2O兲 of 6.2, contained 6.01 g C kg–1 and 0.57 g N kg–1, and had a surface bulk density of 1.5 g cm–3. Initial soil inorganic N in the upper 10 cm of soil was 5 mg N kg–1 in 1992 and 7 mg N kg–1 in 1993. Fiberglass litterbags 共0.15 ⫻ 0.15 m, 1-mm mesh size兲 containing 30 g fresh matter of either clover, rye, wheat, or oats residues were placed in plots cropped respectively with clover, rye, canola, or hairy vetch during winter 1992. Previous crop residues were completely removed before six litterbags were randomly distributed on the soil surface of each microplot. All litterbags in a microplot contained the same cover crop residue, and were used to monitor dry weight and N content during spring and summer. On April 30th 1992, corn 共Dekalb DK 689兲 was planted by hand in rows 76 cm apart. After emergence, the corn was thinned to 54000 plants ha–1. Following corn harvest in September 1992, cover
285 Table 1. Initial residue dry matter 共DM兲 applied and selected properties of crop residues. DM 共kg ha–1兲
C/N
C 共g kg–1兲
CARBa 共g kg–1兲
Cellulose 共g kg–1兲
Hemicellulose 共g kg–1兲
Lignin 共g kg–1兲
Ash 共g kg–1兲
1992 Clover Rye Wheat Oat
4169 3484 4964 2929
24.4 46.2 32.9 30.4
438 454 451 454
520 340 460 400
317 351 256 316
83 249 214 214
74 56 65 65
6 4 5 5
1993 Clover Rye Wheat Oat
2707 3160 4680 3382
22.1 50.5 57.7 55.6
444 457 445 448
450 320 440 360
296 375 236 268
154 235 264 332
93 64 55 35
7 6 5 5
Residue
a
Soluble carbohydrates.
crops were again planted. In spring 1993 cover crops were clipped by hand and plant materials were placed in mesh bags. Litterbags were placed on the microplots following the same experimental procedure as in 1992. This year, however, the cover crop in the litterbag was the same as the one that covered the plot during winter. The same corn hybrid was planted on 17 May 1993 following the procedure previously described. In both years litterbags were placed on May 18th. They were collected to monitor dry weight after 4, 7, 15, 41, 57, and 120 d after application in 1992, and after 2, 7, 14, 28, 58, and 128 d in 1993. The contents of each bag were dried for 3 d at 65 °C, weighed, and ground to pass a 1-mm mesh. To minimize the effect of soil contamination, the residual residue weight was calculated on an ash-free weight basis by determining the ash content 共550 °C兲 on a 1 g subsample from each bag. Residue samples were analyzed for total C and N using a dry combustion analyzer 共LECO, St. Joseph, Michigan兲. The neutral and acid detergent fibre methods 共Goering and Van Soest 1970兲 were used to determine crop residue quality 共Table 1兲. Daily meteorological data from a weather station located 500 m from the microplots were used to calculate the climatic indices. Degree-days were calculated as the average of daily maximum and minimum temperature. Cumulative DD were calculated daily during the growing season. For all indices, the base temperature for residue decomposition was assumed to be 0 °C 共Honeycutt and Potaro 1990兲. Calculation of DCD was based on the model developed by Steiner et al. 共1999兲. This model consid-
ers a moisture and a temperature factor, and each one is included in DCD using a coefficient that ranges from 0 共no decomposition兲 to 1 共optimum conditions兲. The DCD for a given day is equal to the minimum of the moisture or the temperature coefficients. The model assumes that 4 mm of rain is enough to fully wet a layer of residues 共Steiner et al. 1999兲; therefore, if precipitation for a given day is more than 4 mm, the moisture coefficient is set to 1. Below 4 mm the coefficient is equal to precipitation divided by 4. In the absence of precipitation, the moisture coefficient decreases by a factor of 0.5 each day after the last precipitation. The temperature coefficient 共TC兲 is calculated as: TC ⫽
2 · Tmean2 · T2opt ⫺ Tmean4 T4opt
where Tmean is the daily average of maximum 共Tmax兲 and minimum 共Tmin兲 air temperature, and Topt the optimum air temperature for residue decomposition 共32 °C兲. CDD is calculated as: CDD ⫽
Tmean
共Tmax ⫺ Tmin兲
Biomass decomposition was analysed by fitting a first-order exponential model: Y t ⫽ Y 0 · e⫺k·t where Yt is residual crop residues at time t, Y0 is the
286
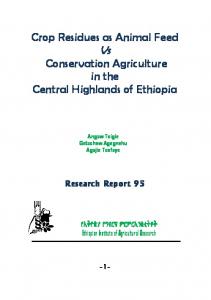
Figure 1. Meteorological data for the growing seasons. Bars represent daily rainfall 共mm兲 and lines daily maximum and minimum temperature 共°C兲.
initial biomass or N applied in the residues, k is the relative decomposition rate, and t is the time expressed in DAA, DD, DCD or CDD. The procedure NLIN in SAS 共SAS Institute 2000兲 was used to estimate model parameters for each residue type, repetition, and year. Biomass decay rates were analysed using the procedure GLM. To determine whether nonlinear regression models using the different time scales differed in error sum of squares 共ESS兲, an F-test ratio between the ESS of the different models was performed for each year and crop residue 共Ruffo and Bollero 2003兲.
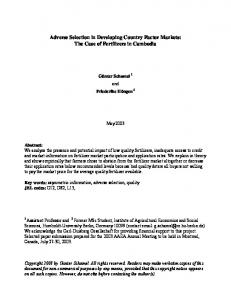
Results and discussion The growing season in 1992 lasted for 120 d and total precipitation was 210 mm, while in 1993 it lasted 128 d with 512 mm of precipitation 共Figure 1兲. Cumulative DD reflecting differences in temperature between years was larger in 1992 共Figure 2兲. Cumulative DCD reflecting the effect of precipitation on decomposition was larger in 1993. Dry periods, when moisture was the limiting factor for residue decom-
position, did not increase cumulative DCD, while they allow accumulation of DD. As a consequence, cumulative DCD reflected larger differences between years than DD. In general, the difference between maximum and minimum temperature was smaller on wet days 共Figure 1兲, in agreement with Hargreaves and Samani 共1985兲. In the wettest year, 1993, average daily oscillation of temperature was 10.5 °C, while in the driest year, 1992, it was 12.5 °C. Dividing daily mean temperature by the oscillation increases the relative weight of wet days in decomposition. Daily correction of DD by the temperature oscillation gave CDD, and its accumulation allowed to reflect the larger differences between years 共Figure 2兲. Decomposition rate 共k兲 estimates from nonlinear regression equations describing residue decomposition and their correlation coefficient 共r2兲 and root mean square error 共RMSE兲 for each year and crop residue combination are presented in Table 2 for the different time scales. All biomass exponential models were significant 共p ⬍ 0.0001兲 and the correlation coefficient was in all cases over 0.50 共Table 2兲. The lowest values were
287
Figure 2. Cumulative degree-days 共DD兲, decompositon-days 共DCD兲, and corrected degree-days 共CDD兲 for the year 1992 共continuous line兲 and 1993 共dashed line兲.
obtained for clover in 1992, where a fast initial decomposition phase was not reflected in any of the models. According to the F-test, RMSE of the exponential model using DD 共49.1 g.m–2兲, DCD 共49.6 g.m–2兲, DAA 共45.6 g.m–2兲 and CDD 共46.1 g.m–2兲 were not significantly different 共data not shown兲; therefore, all time scales performed similarly as estimators of residue decomposition. Previous research has shown that the one-pool exponential model used with different time scales gives a good estimation of residue decomposition 共Douglas et al. 1980; Honneycut et al. 1993; Schomberg et al. 1994; Ma et al. 1999; Ruffo and Bollero 2003兲. In our
study, even the simplest exponential model using DAA was a good estimator of residue decomposition when decay constants were calculated for each year and crop residue combination. Some authors have proposed the use of two exponential models to better describe the initial stages of decomposition. However, our goal was to develop a simple model that can be applied across a wide range of environmental conditions with a minimum set of parameters. The chemical composition of crop residues varied widely 共Table 1兲. In both years clover had a lower C/N ratio than cereals, which explains the faster decomposition 共Figures 2 and 3兲. All time scales were able to reflect this crop residue effect, therefore, decomposition rates for clover were higher than those for cereal residues, for each year and time scale 共Table 2兲. The k’s of crop residues when time was expressed as DAA were between 0.011 and 0.014 d–1 for clover, and between 0.004 and 0.009 d–1 for cereals 共Table 2兲. Rates for residue legumes decomposition reported in the literature varied from 0.005 to 0.03 d–1, and for cereals from 0.001 to 0.009 d–1 共Douglas and Rickman 1992; Honneycut et al. 1993; Schomberg et al. 1994兲. The k’s of crop residues when time was expressed as DD were between 0.48 ⫻ 10–3 and 0.61 ⫻ 10–3 for clover, and between 0.18 ⫻ 10–3 and 0.38 ⫻ 10–3 for cereals 共Table 2兲. Ma et al. 共1999兲 reported a range of k for wheat crop residues between 0.3 ⫻ 10–3 and 0.45 ⫻ 10–3 DD–1. The k’s of clover residue when time was expressed as DCD averaged 0.043, and were significantly higher than those of cereal residues 共0.022 DCD–1兲. In an experiment involving oat, barley and wheat, Steiner et al. 共1999兲 reported k values ranging from 0.015 to 0.042 DCD–1. Decomposition rate values of cereals obtained in this study were within the same range. The only report found in the literature for legumes expressed as DCD is for hairy vetch 共Ruffo and Bollero 2003兲, with an average k for two years and fields of 0.036. The k’s of clover residue when time was expressed as CDD averaged 0.006, and were significantly higher than those for cereal residues 共0.004 CDD–1兲. The estimates of k for the residue decomposition model were used to analyse the effect of year and crop residue on this parameter. The analysis of variance for the biomass decomposition rate 共k兲 showed that the interaction Year ⫻ Residue was significant for DAA and DD, while it was not significant for
288 Table 2. Decomposition rate 共k兲, correlation coefficient 共r2兲, and root mean square error 共RMSE兲 for biomass decomposition from cover crop residues placed on the soil surface, estimated from exponential decay models in which time was expressed as days after application 共DAA兲, degree-days 共DD兲, decomposition-days 共DCD兲 or corrected degree-days 共CDD兲. DAA Crop residue k 共d–1兲
DD r2
RMSE 共g.m–2兲
DCD
k 共DD–1兲
r2
RMSE 共g.m–2兲
CDD
k 共DCD–1兲
r2
RMSE 共g.m–2兲
k 共CDD–1兲
r2
RMSE 共g.m–2兲
1992 Clover Rye Wheat Oat
0.014 0.009 0.008 0.009
0.53 126 0.74 44 0.67 59 0.81 30
0.00061 0.00038 0.00035 0.00037
0.53 133 0.70 47 0.64 63 0.78 31
0.050 0.031 0.028 0.030
0.56 132 0.68 49 0.61 67 0.77 32
0.0071 0.0045 0.0041 0.0043
0.54 136 0.70 43 0.63 59 0.78 28
1993 Clover Rye Wheat Oat
0.011 0.005 0.004 0.006
0.52 0.91 0.81 0.78
0.00048 0.00021 0.00018 0.00027
0.59 0.90 0.81 0.77
0.036 0.014 0.012 0.017
0.61 0.89 0.82 0.71
0.0052 0.0041 0.0035 0.0036
0.64 0.90 0.81 0.76
25 15 37 29
28 15 36 40
27 18 38 34
30 13 32 28
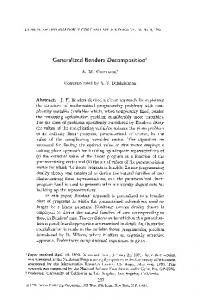
Figure 3. Biomass remaining in clover, rye, wheat, and oat residues applied on the soil surface in a 128-d litterbag decomposition study in 1992. Lines are values calculated by a first-order exponential model using corrected degree-days as time scale.
DCD and CDD 共Table 3兲. This means that only DCD and CDD methodologies were able to separate the effects of year and crop residue on decomposition rate. The variance component analysis confirms this conclusion: the residue factor was only significant when the time scale used was based on DCD and CDD methodologies, while in the other cases the interac-
tion effect kept the residue factor from being significant 共Table 4兲. When the time scale used was DCD or CDD, the variance component of year was smaller than the residual, indicating that year was not a significant source of variability 共Table 4兲. This means that DCD and CDD were able to account for the year to year variability effect on biomass decomposition,
289 Table 3. Summary of the analysis of variance for biomass decay rates from crop residues placed on the soil surface, estimated from exponential decay models in which time was expressed as days after application 共DAA兲, degree-days 共DD兲, decomposition-days 共DCD兲 or corrected degree-days 共CDD兲. DAA
DD
DCD
CDD
Source of error
df
MSE
F-ratio
MSE
F-ratio
MSE
F-ratio
MSE
F-ratio
Year Residue Year ⫻ Residue Residual error
1 3 3 24
0.00001046 0.00001227 0.00003925 0.00000625
1.67 1.96 6.28*
0.00001771 0.00001496 0.00003925 0.00000952
1.57 1.86 6.06*
0.0001386 0.0006499 0.0000890 0.0000330
4.20 19.68** 2.70
0.00000413 0.00001076 0.00000199 0.00000098
4.22 10.98** 2.04
*Indicates factors statistically significant at the 95% confidence interval; **indicates factors statistically significant at the 99% confidence interval.
Table 4. Variance of biomass decay rates from crop residues placed on the soil surface estimated from exponential decay models in which time was expressed as days after application 共DAA兲, degree-days 共DD兲, decomposition-days 共DCD兲 or corrected degreedays 共CDD兲 divided into components. Source of variance
Year Residue Error
% of total variance DAA
DD
DCD
CDD
50.8 0.0 49.2
49.6 0.0 50.4
14.4 57.8 27.8
16.2 42.9 40.9
probably because both indexes reflect the effect of moisture and temperature on the decomposition process. Ruffo and Bollero 共2003兲 compared DCD and DD methodologies to predict residue decomposition, and concluded that, although the calculation of DCD combines precipitation and temperature, it was as good an estimator of weather effects as DD. They explained this result saying that, in their experiment, the effect of precipitation was not large enough to obtain significant differences between DCD and DD. In our study, climatic conditions in 1992 an 1993 were very different, and DCD reflected the effect of weather conditions on decomposition better than DD. More research is needed to clarify the ability of both methodologies as estimators of weather effects on decomposition. DCD and CDD behave in a similar way, decomposition being slightly better described by the CDD scale 共Table 3兲. The validity of the CDD methodology needs to be further tested with a different data set, but it has potential advantages for application in field decomposition studies: 共i兲 CDD accounts for the effect of days without precipitation and low temperature oscillation in decomposition. These are days with high atmospheric
vapour pressure, and so environmental conditions are more suitable for decomposition 共Bartholomew and Norman 1946兲. Moreover, moisture absorption by plant residues in contact with humid air can be an important source of water that enhances microbial decomposition 共Sain and Broadbent 1975兲. 共ii兲 The importance of the interaction effect between moisture and temperature for residue decomposition is well known 共Quemada and Cabrera 1997兲. The CDD methodology takes into consideration the effect of both temperature and moisture, allowing to reflect possible interactions. 共iii兲 Calculation of CDD is simple and exclusively based on climatic conditions. Meanwhile, calculation of DCD obliges to assume a certain amount of rain needed to fully wet the residue layer, which implies the assumption of a certain thickness of the residue layer. Figures 3 and 4 show comparison of observed data and data predicted by the exponential model using CDD as time units. Since there was a significant effect of crop residue type on decomposition rate when CDD was used as the time scale, the mean parameter was used over both years for each crop residue to plot biomass decay. The main source of lack of fit was during the initial phase of crop residue decomposition, but after a month the one-pool exponential model properly described biomass decomposition 共Table 2兲. In summary, the first-order exponential model using either DAA, DD, DCD or CDD as time scale was able to properly estimate biomass decomposition from crop residues applied on the soil surface. However, only using DCD and CDD the models were able to account for the effect of moisture conditions on biomass decomposition. The concept of CDD has several advantages that may justify its use in field decomposition studies: the calculation is simple, is ex-
290
Figure 4. Residual biomass remaining in clover, rye, wheat, and oat residues applied on the soil surface in a 128-d litterbag decomposition study in 1993. Lines are values calculated by a first-order exponential model using corrected degree-days as time scale.
clusively based on climatic conditions, and allows incorporation of possible temperature and moisture interactions in decomposition.
Acknowledgements This work was partially funded by the Ministerio de Ciencia y Tecnología 共Spain兲, reference no. AGL2001-2214-C06-01.
References Andrén O. and Paustian K. 1987. Barley straw decomposition in the field: a comparison of models. Ecology 68: 1190–1200. Bartholomew W.V. and Norman A.G. 1946. The threshold moisture content for active decomposition of some mature plant materials. Soil Sci. Soc. Am. Proc. 11: 270–279. Bristow K.L., Campbell G.S., Papendick R.I. and Elliot L.F. 1986. Simulation of heat and moisture transfer through a surface residue-soil system. Agric. For. Meteorol. 36: 193–214. Douglas C.L. and Rickman R.W. 1992. Estimating crop residue decomposition from air temperature, initial nitrogen content, and residue placement. Soil Sci. Soc. Am. J. 56: 272–278.
Godwin D.C. and Jones C.A. 1991. Nitrogen dynamics in soil-plant systems. In: Hanks R.J. and Ritchie J.T. 共eds兲, Modeling Plant and Soil Systems. Agron. Monogr. 31. ASA, CSSA and SSSA, Madison, Wisconsin, USA, pp. 287–321. Goering H.K. and Van Soest P.J. 1970. Forage fibre analysis: apparatus, reagents, procedures, and some applications. USDA Agricultural Handbook 379. US Government Print Office, Washington, DC, USA. Hargreaves G.H. and Samani Z.A. 1985. Reference crop evapotranspiration from temperature. Appl. Engr. Agric. 1: 96–99. Heal O.W., Anderson J.M. and Swift M.J. 1997. Plant litter quality and decomposition: an historical overview. In: Cadish G. and Giller K.E. 共eds兲, Driven by Nature: Plant Litter Quality and Decomposition. CAB International, Cambridge, UK, pp. 3–30. Honeycutt C.W., Potaro L.J., Avila K.L. and Halteman W.A. 1993. Residue quality, loading rate and soil temperature relations with hairy vetch 共Vicia villosa Roth兲 residue carbon, nitrogen and phosphorus mineralization. Biol. Agric. Hortic. 9: 181–199. Honeycutt C.W. and Potaro L.J. 1990. Field evaluations of heat units for predicting crop residue carbon and nitrogen mineralization. Plant Soil 125: 213–220. Hunt H.W. 1977. A simulation model for decomposition in grasslands. Ecology 58: 469–484. Jessop R.S. and Stewart L.W. 1983. Effects of crop residues, soil type and temperature on emergence and early growth of wheat. Plant Soil 74: 101–109. Ma L., Peterson G.A., Ahuja L.R., Sherrod L., Shaffer M.J. and Rojas K.W. 1999. Decomposition of surface crop residues in
291 long-term studies of dryland agroecosystems. Agron. J. 91: 401– 409. Quemada M. and Cabrera M.L. 1995. Carbon and nitrogen mineralization from leaves and stems of four cover crops. Soil Sci. Soc. Am. J. 59: 471–477. Quemada M. and Cabrera M.L. 1997. Temperature and moisture effects on C and N mineralization from surface applied clover residues. Plant Soil 189: 127–137. Ruffo L. and Bollero G.A. 2003. Modeling rye and hairy vetch decomposition as a function of degree-days and decompositiondays. Agron. J. 95: 900–907. SAS Institute 2000. SAS User’s Guide: Statistics. SAS Institute, Cary, North Carolina, USA. Sain P. and Broadbent F.E. 1975. Moisture absorption, mold growth, and decomposition of rice straw at different relative humidity. Agron. J. 67: 759–762.
Schomberg H.H., Steiner J.L. and Unger P.W. 1994. Decomposition and nitrogen dynamics of crop residues: residue quality and water effects. Soil Sci. Soc. Am. J. 58: 372–381. Schomberg H.H. and Steiner J.L. 1997. Comparison of residue decomposition models used in erosion prediction. Agron. J. 89: 911–919. Singh R.P., Parr J.F. and Stewart B.A. 1990. Dryland Agriculture: Strategies for Sustainability. Springer Verlag, New York, USA. Steiner J.L., Schomberg H.H., Unger P.W. and Cresap J. 1999. Crop residue decomposition in no-tillage small-grain fields. Soil Sci. Soc. Am. J. 63: 1817–1824. Stroo H.F., Bristow K.L., Elliot L.F., Papendick R.I. and Campbell G.S. 1989. Predicting rates of wheat residue decomposition. Soil Sci. Soc. Am. J. 53: 91–99. Unger P.W. 1994. Managing Agricultural Residues. Lewis Publishers, Boca Raton, Florida, USA.