www.nature.com/scientificreports
OPEN
received: 21 July 2016 accepted: 06 December 2016 Published: 19 January 2017
Predicting Drug Combination Index and Simulating the Network-Regulation Dynamics by Mathematical Modeling of DrugTargeted EGFR-ERK Signaling Pathway Lu Huang1,2,3, Yuyang Jiang1 & Yuzong Chen3,4 Synergistic drug combinations enable enhanced therapeutics. Their discovery typically involves the measurement and assessment of drug combination index (CI), which can be facilitated by the development and applications of in-silico CI predictive tools. In this work, we developed and tested the ability of a mathematical model of drug-targeted EGFR-ERK pathway in predicting CIs and in analyzing multiple synergistic drug combinations against observations. Our mathematical model was validated against the literature reported signaling, drug response dynamics, and EGFR-MEK drug combination effect. The predicted CIs and combination therapeutic effects of the EGFR-BRaf, BRaf-MEK, FTI-MEK, and FTI-BRaf inhibitor combinations showed consistent synergism. Our results suggest that existing pathway models may be potentially extended for developing drug-targeted pathway models to predict drug combination CI values, isobolograms, and drug-response surfaces as well as to analyze the dynamics of individual and combinations of drugs. With our model, the efficacy of potential drug combinations can be predicted. Our method complements the developed in-silico methods (e.g. the chemogenomic profile and the statistically-inferenced network models) by predicting drug combination effects from the perspectives of pathway dynamics using experimental or validated molecular kinetic constants, thereby facilitating the collective prediction of drug combination effects in diverse ranges of disease systems. Synergistic drug combinations have been extensively explored for enhanced therapeutic efficacies1–9. In discovering and investigating synergistic drug combinations, the level of synergism is typically measured and quantified by the drug combination index (CI, a quantitative measure of drug combination effects defined in Method Section) such as Chou and Talalay’s CI from experimental dose-response data1,3,10. Based on our literature search study, over 523 papers since 2004 have reported the discovery and optimization of synergistic drug combinations based on the experimentally determined CIs. In-silico tools that can predict CIs without the time-consuming and costly measurement of dose-response data are highly useful for facilitating the discovery of synergistic drug combinations.
1
The Ministry-Province Jointly Constructed Base for State Key Lab and Shenzhen Technology and Engineering Lab for Personalized Cancer Diagnostics and Therapeutics Tsinghua University Shenzhen Graduate School, and Shenzhen Kivita Innovative Drug Discovery Institute, Shenzhen, 518055, P.R. China. 2Institute of Molecular Biology (IMB), Ackermannweg 4, 55128 Mainz, Germany. 3Department of Pharmacy, and Center for Computational Science and Engineering, National University of Singapore, Blk S16, Level 8, 3 Science Drive 2, 117543 Singapore. 4State Key Laboratory of Biotherapy, West China Hospital, West China School of Medicine, Sichuan University, Chengdu, China. Correspondence and requests for materials should be addressed to Y.J. (email:
[email protected]) or Y.C. (email:
[email protected]) Scientific Reports | 7:40752 | DOI: 10.1038/srep40752
1
www.nature.com/scientificreports/
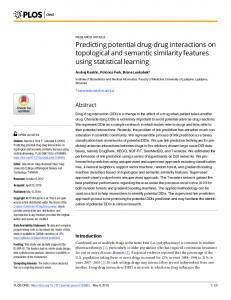
Figure 1. Drug-targeted EGFR-ERK pathway schema in this study. The EGFR, Raf and MEK inhibitor is represented by the small green, blue and yellow colored node with a letter D respectively. Computational methods have been developed for predicting drug combination effects from gene expression profiles of drug-treated samples11–15 and simulation of drug-targeted signaling16–21 and metabolic22–25 pathways. In particular, simulation of drug-targeted pathways is potentially useful for predicting CIs17,26, as demonstrated by the successful applications of the chemogenomic profile based models27,28 and the statistically-inferenced network models29,30 for the prediction of synergistic effects of drug combinations. But the ability of the pathway simulation methods in predicting CIs has not been adequately tested against the observed values of multiple drug combinations targeting multiple target combinations. More tests are needed for determining what the existing mathematical models are capable of and what need to be further improved. These also provide useful knowledge for developing drug or drug combination targeted mathematical models for a number of pathways targeted by drugs and drug combinations (e.g. EGFR-ERK31–35, apoptosis36,37, NFκB16,17, Wnt19 and disease-relevant metabolic22–25 pathways). In this work, we developed and tested a mathematical model of drug and drug combination targeted EGFR-ERK pathway (Fig. 1) based on the ordinary differential equation model of Hornberg38. The method for developing this model is provided in the method section. This pathway was selected for two reasons. First, several kinases in this pathway have been targeted by individual inhibitor drugs and drug combinations with available experimental drug response and CI data39–44. Secondly, it is one of the pathways with well-established mathematical models31–35,38, ideal for developing and testing drug-targeted pathway mathematical models. The kinase inhibitor drugs included in our mathematical model are EGFR, BRaf and MEK inhibitors, which together with their combinations have been clinically used or tested for the treatment of melanoma, colon, gastric, pancreatic, non-small-cell-lung-cancer (NSCLC) and other cancers39–44. The inhibitory effect of each drug against its target was measured by the percentage reduction of the integrated non-drug-bound target level at different drug concentrations (target dose response curve), and the concentration that induces 50% reduction was taken as the half maximal inhibitory concentration (IC50 value). The integrated non-drug-bound target level refers to the integral of the free target level over the first 2 hours of signaling stimulation. The anti-proliferative effect of each drug or drug combination was measured by the percentage reduction of the integrated phosphorylated ERK (ppERK) level (described below) with respect to the concentration(s) of the drug or drug combination (anti-proliferative dose effect curve)45, and the concentration(s) that induce 90% reduction was taken as the half maximal inhibition of growth (GI50 value) of the drug or drug combination (details in the Method Section). The integrated ppERK level refers to the integral of the ppERK level over the first 2 hours of signaling stimulation (the ppERK level typically returns to the basal level 1 antagonism
A CI of less than, equal to, and more than 1 indicates synergy, additivity, and antagonism, respectively. We simulated isobolograms for a pair of drugs with eight equally effective dose combinations for a particular effect level of GI50. GI50 normalized doses of drug 1 and drug 2 that give this effect in combination are plotted as axial points in the isobologram graphs. According to Eq. 4, the isobologram curves are expected to be parallel to the diagonal for additive drug pairs, concave for synergistic drug pairs, and convex for antagonistic drug pairs. We mainly concerned about the qualitative shape of the isobolograms for correctly identifying the drug pair category, and use the smallest CI of the eight drug dose combinations as the CI for this drug pair.
References
1. Keith, C. T., Borisy, A. a. & Stockwell, B. R. Multicomponent therapeutics for networked systems. Nat. Rev. Drug Discov. 4, 71–78 (2005). 2. Csermely, P., Agoston, V. & Pongor, S. The efficiency of multi-target drugs: The network approach might help drug design. Trends in Pharmacological Sciences 26, 178–182 (2005). 3. Zimmermann, G. R., Lehar, J. & Keith, C. T. Multi-target therapeutics: when the whole is greater than the sum of the parts. Drug Discovery Today 12, 34–42 (2007). 4. Smalley, K. S. M. et al. Multiple signaling pathways must be targeted to overcome drug resistance in cell lines derived from melanoma metastases. Mol. Cancer Ther. 5, 1136–1144 (2006). 5. Dancey, J. E. & Chen, H. X. Strategies for optimizing combinations of molecularly targeted anticancer agents. Nat. Rev. Drug Discov. 5, 649–659 (2006). 6. Kitano, H. A robustness-based approach to systems-oriented drug design. Nat. Rev. Drug Discov. 6, 202–210 (2007). 7. Silver, L. L. Multi-targeting by monotherapeutic antibacterials. Nat. Rev. Drug Discov. 6, 41–55 (2007). 8. Jia, J. et al. Mechanisms of drug combinations: interaction and network perspectives. Nat. Rev. Drug Discov. 8, 111–128 (2009). 9. Hopkins, A. L. Network pharmacology: the next paradigm in drug discovery. Nat. Chem. Biol. 4, 682–90 (2008). 10. Chou, T.-C. Theoretical basis, experimental design, and computerized simulation of synergism and antagonism in drug combination studies. Pharmacol. Rev. 58, 621–81 (2006). 11. Cline, E. I., Bicciato, S., DiBello, C. & Lingen, M. W. Prediction of in vivo synergistic activity of antiangiogenic compounds by gene expression profiling. Cancer Res. 62, 7143–7148 (2002). 12. Beerenwinkel, N. et al. Methods for optimizing antiviral combination therapies. In Bioinformatics 19 (2003). 13. Havaleshko, D. M. et al. Prediction of drug combination chemosensitivity in human bladder cancer. Mol. Cancer Ther. 6, 578–586 (2007). 14. Small, B. G. et al. Efficient discovery of anti-inflammatory small-molecule combinations using evolutionary computing. Nat. Chem. Biol. 7, 902–8 (2011). 15. Lee, J. H. et al. CDA: Combinatorial drug discovery using transcriptional response modules. PLoS One 7 (2012). 16. Yan, H., Zhang, B., Li, S. & Zhao, Q. A formal model for analyzing drug combination effects and its application in TNF-alphainduced NFkappaB pathway. BMC Syst. Biol. 4, 50 (2010). 17. Peng, H., Wen, J., Li, H., Chang, J. & Zhou, X. Drug inhibition profile prediction for NF??B pathway in multiple myeloma. PLoS One 6 (2011). 18. Al-Shyoukh, I. et al. Systematic quantitative characterization of cellular responses induced by multiple signals. BMC Syst. Biol. 5, 88 (2011). 19. Kogan, Y. et al. A new validated mathematical model of the Wnt signalling pathway predicts effective combinational therapy by sFRP and Dkk. Biochem. J. 444, 115–125 (2012). 20. Glants, R. M., Turchin, V. L., Chaplik, V. V. & Gribovich, IuIa. Treatment of acute renal insufficiency using prostaglandin E2 in surgical patients. Klinicheskaia khirurgiia 32–34 (1990). 21. Miller, M. L. et al. Drug synergy screen and network modeling in dedifferentiated liposarcoma identifies CDK4 and IGF1R as synergistic drug targets. Sci. Signal. 6, ra85–ra85 (2013). 22. Lehár, J. et al. Chemical combination effects predict connectivity in biological systems. Mol. Syst. Biol. 3, 80 (2007). 23. Yang, K. et al. Dynamic simulations on the arachidonic acid metabolic network. PLoS Comput. Biol. 3, 0523–0530 (2007). 24. Buse, E. Generation of GABA-synthesizing nerve cells cultured from embryonic cortex cerebri of mice with and without cell-to-cell contacts. Anat Embryol 182, 151–160 (1990). 25. Facchetti, G., Zampieri, M. & Altafini, C. Predicting and characterizing selective multiple drug treatments for metabolic diseases and cancer. BMC Syst. Biol. 6, 115 (2012).
Scientific Reports | 7:40752 | DOI: 10.1038/srep40752
7
www.nature.com/scientificreports/ 26. Sun, X. et al. Cytokine combination therapy prediction for bone remodeling in tissue engineering based on the intracellular signaling pathway. Biomaterials 33, 8265–8276 (2012). 27. Jansen, G. et al. Chemogenomic profiling predicts antifungal synergies. Mol. Syst. Biol. 5, 338 (2009). 28. Chandrasekaran, S. et al. Chemogenomics and orthology-based design of antibiotic combination therapies. Mol. Syst. Biol. 12, 872 (2016). 29. Molinelli, E. J. et al. Perturbation Biology: Inferring Signaling Networks in Cellular Systems. PLoS Comput. Biol. 9 (2013). 30. Korkut, A. et al. Perturbation biology nominates upstream–downstream drug combinations in RAF inhibitor resistant melanoma cells. Elife 4 (2015). 31. Schoeberl, B., Eichler-Jonsson, C., Gilles, E. D. & Müller, G. Computational modeling of the dynamics of the MAP kinase cascade activated by surface and internalized EGF receptors. Nat. Biotechnol. 20, 370–375 (2002). 32. Sasagawa, S., Ozaki, Y., Fujita, K. & Kuroda, S. Prediction and validation of the distinct dynamics of transient and sustained ERK activation. Nat. Cell Biol. 7, 365–373 (2005). 33. Li, H. et al. Pathway sensitivity analysis for detecting pro-proliferation activities of oncogenes and tumor suppressors of epidermal growth factor receptor- extracellular signal-regulated protein kinase pathway at altered protein levels. Cancer 115, 4246–4263 (2009). 34. Bairy, S. & Wong, C. F. Influence of kinetics of drug binding on EGFR signaling: A comparative study of three EGFR signaling pathway models. Proteins Struct. Funct. Bioinforma. 79, 2491–2504 (2011). 35. Huang, L. et al. Simulating EGFR-ERK signaling control by scaffold proteins KSR and MP1 reveals differential Ligand-Sensitivity Co-Regulated by CBL-CIN85 and Endophilin. PLoS One 6 (2011). 36. Fussenegger, M., Bailey, J. E. & Varner, J. A mathematical model of caspase function in apoptosis. Nat. Biotechnol. 18, 768–774 (2000). 37. Legewie, S., Blüthgen, N. & Herzel, H. Mathematical modeling identifies inhibitors of apoptosis as mediators of positive feedback and bistability. PLoS Comput. Biol. 2, 1061–1073 (2006). 38. Hornberg, J. J. et al. Control of MAPK signalling: from complexity to what really matters. Oncogene 24, 5533–5542 (2005). 39. Normanno, N. et al. The MEK/MAPK pathway is involved in the resistance of breast cancer cells to the EGFR tyrosine kinase inhibitor gefitinib. J. Cell. Physiol. 207, 420–427 (2006). 40. Yoon, Y. K. et al. Combination of EGFR and MEK1/2 inhibitor shows synergistic effects by suppressing EGFR/HER3-dependent AKT activation in human gastric cancer cells. Mol Cancer Ther 8, 2526–2536 (2009). 41. Martinelli, E. et al. Synergistic antitumor activity of sorafenib in combination with epidermal growth factor receptor inhibitors in colorectal and lung cancer cells. Clin. Cancer Res. 16, 4990–5001 (2010). 42. Diep, C. H., Munoz, R. M., Choudhary, A., Von Hoff, D. D. & Han, H. Synergistic effect between erlotinib and MEK inhibitors in KRAS wild-type human pancreatic cancer cells. Clin. Cancer Res. 17, 2744–2756 (2011). 43. Su, F. et al. Resistance to selective BRAF inhibition can be mediated by modest upstream pathway activation. Cancer Res. 72, 969–978 (2012). 44. Prahallad, A. et al. Unresponsiveness of colon cancer to BRAF(V600E) inhibition through feedback activation of EGFR. Nature 483, 100–3 (2012). 45. Klinger, B. et al. Network quantification of EGFR signaling unveils potential for targeted combination therapy. Mol. Syst. Biol. 9, 673 (2013). 46. Hornberg, J. J., Tijssen, M. R. & Lankelma, J. Synergistic activation of signalling to extracellular signal-regulated kinases 1 and 2 by epidermal growth factor and 4 beta-phorbol 12-myristate 13-acetate. Eur. J. Biochem. 271, 3905–13 (2004). 47. Asthagiri, a. R., Reinhart, C. a., Horwitz, a. F. & Lauffenburger, D. a. The role of transient ERK2 signals in fibronectin- and insulinmediated DNA synthesis. J. Cell Sci. 113 Pt 24, 4499–4510 (2000). 48. Albeck, J. G., Mills, G. B. & Brugge, J. S. Frequency-Modulated Pulses of ERK Activity Transmit Quantitative Proliferation Signals. Mol. Cell 49, 249–261 (2013). 49. Yang, H. et al. RG7204 (PLX4032), a selective BRAFV600E inhibitor, displays potent antitumor activity in preclinical melanoma models. Cancer Res. 70, 5518–5527 (2010). 50. Mayawala, K., Gelmi, C. a. & Edwards, J. S. MAPK cascade possesses decoupled controllability of signal amplification and duration. Biophys. J. 87, L01–L02 (2004). 51. Holbeck, S. L., Collins, J. M. & Doroshow, J. H. Analysis of Food and Drug Administration-Approved Anticancer Agents in the NCI60 Panel of Human Tumor Cell Lines. Mol. Cancer Ther. 9, 1451–60 (2010). 52. Ball, D. W. et al. Selective growth inhibition in BRAF mutant thyroid cancer by the mitogen-activated protein kinase kinase 1/2 inhibitor AZD6244. J. Clin. Endocrinol. Metab. 92, 4712–4718 (2007). 53. Dai, Z., Liu, S., Marcucci, G. & Sadee, W. 5-Aza-2′-deoxycytidine and depsipeptide synergistically induce expression of BIK (BCL2interacting killer). Biochem. Biophys. Res. Commun. 351, 455–461 (2006). 54. Georgakis, G. V., Li, Y., Rassidakis, G. Z., Medeiros, L. J. & Younes, A. The HSP90 inhibitor 17-AAG synergizes with doxorubicin and U0126 in anaplastic large cell lymphoma irrespective of ALK expression. Exp. Hematol. 34, 1670–1679 (2006). 55. Rowinsky, E. K., Windle, J. J. & Von Hoff, D. D. Ras protein farnesyltransferase: A strategic target for anticancer therapeutic development. J. Clin. Oncol. 17, 3631–3652 (1999). 56. Chaponis, D. et al. Lonafarnib (SCH66336) improves the activity of temozolomide and radiation for orthotopic malignant gliomas. J. Neurooncol. 104, 179–189 (2011). 57. Basso, A. D. et al. The farnesyl transferase inhibitor (FTI) SCH66336 (lonafarnib) inhibits Rheb farnesylation and mTOR signaling: Role in FTI enhancement of taxane and tamoxifen anti-tumor activity. J. Biol. Chem. 280, 31101–31108 (2005). 58. Niessner, H. et al. The farnesyl transferase inhibitor lonafarnib inhibits mTOR signaling and enforces sorafenib-induced apoptosis in melanoma cells. J. Invest. Dermatol. 131, 468–479 (2011). 59. Pellicano, F. et al. The MEK inhibitor PD184352 enhances BMS-214662-induced apoptosis in CD34+CML stem/progenitor cells. Leukemia 25, 1159–67 (2011). 60. Fisher, C. P., Plant, N. J., Moore, J. B., Kierzek, A. M. & Jurisica, I. QSSPN: Dynamic simulation of molecular interaction networks describing gene regulation, signalling and whole-cell metabolism in human cells. Bioinformatics 29, 3181–3190 (2013). 61. Proctor, C. J., Macdonald, C., Milner, J. M., Rowan, A. D. & Cawston, T. E. A computer simulation approach to assessing therapeutic intervention points for the prevention of cytokine-induced cartilage breakdown. Arthritis Rheumatol. 66, 979–989 (2014). 62. Gong, H. & Feng, L. Computational analysis of the roles of ER-Golgi network in the cell cycle. BMC Syst. Biol. 8, S3 (2014). 63. Peng, X.-H. et al. Cross-talk between epidermal growth factor receptor and hypoxia-inducible factor-1alpha signal pathways increases resistance to apoptosis by up-regulating survivin gene expression. J. Biol. Chem. 281, 25903–14 (2006). 64. Massarweh, S. & Schiff, R. Resistance to endocrine therapy in breast cancer: Exploiting estrogen receptor/growth factor signaling crosstalk. in Endocrine-Related Cancer 13 (2006). 65. Grimaldi, K. a., McAdam, S. R., Souhami, R. L. & Hartley, J. a. DNA damage by anti-cancer agents resolved at the nucleotide level of a single copy gene: evidence for a novel binding site for cisplatin in cells. Nucleic Acids Res. 22, 2311–7 (1994). 66. Malonga, H., Neault, J. F., Diamantoglou, S. & Tajmir-Riahi, H. A. Taxol anticancer activity and DNA binding. Mini Rev. Med. Chem. 5, 307–311 (2005). 67. Sintchak, M. D. et al. Structure and mechanism of inosine monophosphate dehydrogenase in complex with the immunosuppressant mycophenolic acid. Cell 85, 921–930 (1996).
Scientific Reports | 7:40752 | DOI: 10.1038/srep40752
8
www.nature.com/scientificreports/ 68. Apgar, J. F., Toettcher, J. E., Endy, D., White, F. M. & Tidor, B. Stimulus design for model selection and validation in cell signaling. PLoS Comput. Biol. 4 (2008). 69. Stites, E. C. The response of cancers to BRAF inhibition underscores the importance of cancer systems biology. Sci. Signal. 5, pe46 (2012). 70. Zhang, B., Chernoff, J. & Zheng, Y. Interaction of Rac1 with GTPase-activating proteins and putative effectors. A comparison with Cdc42 and RhoA. J. Biol. Chem. 273, 8776–8782 (1998). 71. Kholodenko, B. N., Demin, O. V., Moehren, G. & Hoek, J. B. Quantification of short term signaling by the epidermal growth factor receptor. J. Biol. Chem. 274, 30169–30181 (1999). 72. Yamada, S., Taketomi, T. & Yoshimura, A. Model analysis of difference between EGF pathway and FGF pathway. Biochem. Biophys. Res. Commun. 314, 1113–1120 (2004). 73. Kiyatkin, A. et al. Scaffolding protein Grb2-associated binder 1 sustains epidermal growth factor-induced mitogenic and survival signaling by multiple positive feedback loops. J. Biol. Chem. 281, 19925–19938 (2006). 74. Wojcik, J. & Schächter, V. Protein-protein interaction map inference using interacting domain profile pairs. Bioinformatics 17 Suppl 1, S296–S305 (2001). 75. Singhal, M. & Resat, H. A domain-based approach to predict protein-protein interactions. BMC Bioinformatics 8, 199 (2007).
Acknowledgements
This work is supported by Academic Research Fund (R-148-000-081-112/101) National University of Singapore.
Author Contributions
L.H. and Y.Z.C. conceived, designed the study and created the computational methods. L.H. performed the computational analysis. L.H., Y.Z.C. and Y.Y.J. analyzed the data and wrote the manuscript. All authors reviewed and commented on the manuscript.
Additional Information
Supplementary information accompanies this paper at http://www.nature.com/srep Competing financial interests: The authors declare no competing financial interests. How to cite this article: Huang, L. et al. Predicting Drug Combination Index and Simulating the NetworkRegulation Dynamics by Mathematical Modeling of Drug-Targeted EGFR-ERK Signaling Pathway. Sci. Rep. 7, 40752; doi: 10.1038/srep40752 (2017). Publisher's note: Springer Nature remains neutral with regard to jurisdictional claims in published maps and institutional affiliations. This work is licensed under a Creative Commons Attribution 4.0 International License. The images or other third party material in this article are included in the article’s Creative Commons license, unless indicated otherwise in the credit line; if the material is not included under the Creative Commons license, users will need to obtain permission from the license holder to reproduce the material. To view a copy of this license, visit http://creativecommons.org/licenses/by/4.0/ © The Author(s) 2017
Scientific Reports | 7:40752 | DOI: 10.1038/srep40752
9