remote sensing Technical Note
PROBA-V Mission Exploitation Platform Erwin Goor 1, *, Jeroen Dries 1 , Dirk Daems 1 , Martine Paepen 1 , Fabrizio Niro 2 , Philippe Goryl 2 , Philippe Mougnaud 2 and Andrea Della Vecchia 2 1
2
*
VITO, Vlaamse Instelling voor Technologisch Onderzoek-Flemish Institute for Technological Research, Boeretang 200, 2400 Mol, Belgium;
[email protected] (J.D.);
[email protected] (D.D.);
[email protected] (M.P.) ESA-ESRIN, European Space Agency–European Space Research Institute, Via Galileo Galilei, 00044 Frascati, Italy;
[email protected] (F.N.);
[email protected] (P.G.);
[email protected] (P.M.);
[email protected] (A.D.V.) Correspondence:
[email protected]; Tel.: +32-493-514-274
Academic Editors: Clement Atzberger, Mag. Magda Chelfaoui, Jose Moreno and Prasad S. Thenkabail Received: 25 April 2016; Accepted: 22 June 2016; Published: 2 July 2016
Abstract: As an extension of the PROBA-Vegetation (PROBA-V) user segment, the European Space Agency (ESA), de Vlaamse Instelling voor Technologisch Onderzoek (VITO), and partners TRASYS and Spacebel developed an operational Mission Exploitation Platform (MEP) to drastically improve the exploitation of the PROBA-V Earth Observation (EO) data archive, the archive from the historical SPOT-VEGETATION mission, and derived products by researchers, service providers, and thematic users. The analysis of the time series of data (petabyte range) is addressed, as well as the large scale on-demand processing of the complete archive, including near real-time data. The platform consists of a private cloud environment, a Hadoop-based processing environment and a data manager. Several applications are released to the users, e.g., a full resolution viewing service, a time series viewer, pre-defined on-demand processing chains, and virtual machines with powerful tools and access to the data. After an initial release in January 2016 a research platform was deployed gradually, allowing users to design, debug, and test applications on the platform. From the PROBA-V MEP, access to, e.g., Sentinel-2 and Sentinel-3 data will be addressed as well. Keywords: exploitation platform; PROBA-V; vegetation; data analytics; on-demand processing; web services
1. Introduction The concept of a Mission Exploitation (or Community) Platform (MEP) has been elaborated by the ESA after a series of consultations and inputs received, starting from the large survey conducted at the time of the Living Planet symposium in Edinburgh in September 2013. The amount of available Earth Observation (EO) satellite data combined with the latest technological evolutions has generated growing expectations, with the perspective of reaching new users. In this context, access to EO data and generation of services means: ‚ ‚ ‚ ‚ ‚
An increase the amount of data available (EO and non EO, including fiducial reference data), both to science and downstream services; Ensure shorter time for delivery; Increase collaboration; Guarantee quality/reliability of the data; and Improve flexibility to respond to changing demands and expectations.
Remote Sens. 2016, 8, 564; doi:10.3390/rs8070564
www.mdpi.com/journal/remotesensing
Remote Sens. 2016, 8, 564
2 of 15
In particular, the European industry requested support from the ESA for the development of Big Data from space-related applications, services, and the development of enabling technologies in order to ensure international competitiveness and reach new user segments beyond science and meteorology. We see, as well, that several Sentinel collaborative ground segments are established and some national agencies move towards thematic centres. There is a clear convergence to the paradigm of "user-oriented" exploitation platforms being the response to the Big Data from space challenge (variety, veracity, and velocity for the usability of the EO data for decision-making processes). The PROBA-V MEP addresses these challenges and builds further on the research and development (R and D) results, i.e., existing prototypes, from the ESA-sponsored ‘Enhanced Service Support Environment (ESE)’ and ‘Ontology Based EO Search (OBEOS)’ projects: the MEP aims to bring together all data, all software/tools/libraries, and all documentation needed by the users to analyse or process PROBA-V data on one single platform with scalable Information and Communication Technology (ICT) resources and support for collaboration between different actors. In Section 2 we explain the specific objectives of a MEP for the PROBA-V mission. Section 3 discusses the technical solution based on state-of-the-art tools used in Big Data solutions. In Section 4 we clarify how the users are involved to steer the evolution of the platform. Here we have a specific focus on calibration and validation activities, as this is an important aspect. The paper concludes with a discussion on future activities and conclusions. 2. Objectives and Benefits The PROBA-V MEP [1] has the ambition to complement the PROBA-V user segment [2] by building an operational exploitation platform (EP) on the data, addressing hereby the wider vegetation user community with the final aim to ease and increase the use of PROBA-V data [3]. The data offer will consist of the complete archive from PROBA-V (daily data from October 2013, onwards), the historical SPOT-VEGETATION missions (data archive from 1998 till May 2014) [4], complementary data required to process, analyse, and validate PROBA-V data, and derived products from users. The reasons for deploying a Mission Exploitation Platform dedicated to the PROBA-V mission are numerous: ‚
‚
‚
‚
The data, and specifically the time series of daily/ten-daily data, from 1998 until the present is too large to be downloaded to, and processed on, the users’ premises, at least for the majority of the users. Here, the data from the former SPOT-VEGETATION 1 and 2 missions and PROBA-V at 1 km are treated in the MEP as one time series. The differences between the two datasets will be documented and provided to the users as part of the documentation provided on the platform. Users benefit from a unique point of access to the mission/sensor data (core, derived, prototyped, test), but also to data from similar missions/sensors (i.e., in support to joint calibration and validation (cal/val) or synergetic products also issued from programmatic collaboration), to meteorological data or fiducial reference and campaign data. The MEP becomes the hub of the mission for the broad communities of users/scientists and service providers for searching, accessing, processing, manipulating, and visualizing the data with suitable tools. The platform can stimulate collaboration between the users, as we bring together services from various stakeholders on the same platform with a number of tools to support the publishing of these services and to allow others to provide online feedback. A further focus on documentation, knowledge-sharing, and user support complements this and also makes the MEP an information centre for the mission with documentation on all supported products, similar missions, and fiducial reference data, specifications, standards, reports, etc. Fast and efficient information exchange is ensured by social networking tools: forum/wikis/blogs/calendar of events/new social networks capabilities. The MEP becomes the hub information centre for the mission where ESA, in the role of facilitator, is re-enforced as a mediator and coordinator, setting a stepping stone for future growth.
Remote Sens. 2016, 8, 564
‚
‚
‚
3 of 15
The platform goes beyond offering standard products which can be only downloaded as they are produced by the processing centre: in the MEP applications are offered to visualize and analyse large time series of data. Furthermore on-demand processing services are developed including a web-based UI, which deliver user-tailored products. In a next step we gradually deploy a virtual research environment, being a platform, which allows users to develop, debug, and test an application on an infrastructure at VITO with access to the complete data archive. Successful applications from third-parties can then be offered as operational on-demand processing services to the user community on the same scalable platform. The platform is open for any processing workflow using any processing algorithm, including open source ‘processing’ code and/or public/collaborative software. The MEP strengthens the veracity pillar of the Big Data concept by holding all available information for all the supported products (core, derived, prototyped/test) of the mission and similar ones (synergetic products, joint cal/val, programmatic collaboration between agencies/services), fiducial reference and campaign data. The cal/val need is strong in a MEP context, both when the mission is still in its initial phase of operations and later on for algorithm validation. As an exploitation platform (EP) with a focus on open interfaces, we position the PROBA-V mission in an ecosystem of TEPs (Thematic EPs), REPs (Regional EPs), and other MEPs. In the future the PROBA-V MEP can be integrated gradually in a federation of different platforms, including Sentinel Collaborative Ground Segments, in line with the current ESA strategy on the ‘EO Ground Segment Evolution’.
During the PROBA-V MEP operational phase, which will continue at least until the end of the PROBA-V mission in May 2018, several third-party service projects will develop and operate applications on the platform. We will address their user requirements to implement the shift of paradigm from “data to user“ to “user to data”, bridging the gap between the traditional EO ground segment and the scientist or value-added industry by providing a one stop shop with access to the full PROBA-V mission data (including derived parameters) and to external repositories of similar missions/sensors (including Sentinel-2, Sentinel-3, and Landsat). 3. Technical Solution In this section we discuss the high-level components of the platform and the portfolio of tools which is currently available on the platform. 3.1. PROBA-V MEP Platform The platform consists of the following components as outlined in Figure 1 and explained in this section. 3.1.1. Product Distribution Facility The existing Product Distribution Facility (PDF) is serving the access to all data available in the archive at the VITO data centre, both via a Web portal interface as well as discovery, viewing and data access interfaces using widely accepted open standards. More evolutions on these standardized machine-to-machine interfaces are planned in the near future, e.g., the support of OpenSearch [5] and a download manager. The PDF can be accessed from [6] and offers the complete archives of PROBA-V and SPOT-VEGETATION, and also several other products e.g., 10-daily composites from METOP-AVHRR and data from the airborne hyperspectral Airborne Prism Experiment (APEX [7]) instrument. Also the output data i.e., results from applications running on the PROBA-V MEP can be ingested in the PDF, from where they can be downloaded by others users.
Remote Sens. 2016, 8, 564 Remote Sens. 2016, 8, 564
4 of 15 4 of 16
Figure 1. High level level architecture architecture diagram Figure 1. High diagram of of the the PROBA-V PROBA-V MEP. MEP.
3.1.2. Processing and Data Analytics Platform–Hadoop Cluster 3.1.1. Scalable Product Distribution Facility Hadoop [8], Product as a software framework for (PDF) data-intensive applications, is designed The existing Distribution Facility is servingdistributed the access to all data available in the to process amounts data both by separating datainterface into smaller chunks and performing archive at large the VITO data of centre, via a Webthe portal as well as discovery, viewinglarge and numbers of interfaces small parallel on the open data.standards. It is applied often for processing bigstandardized data and is data access usingoperations widely accepted More evolutions on these applied in this context for the on-demand of future, EO data, as the prototyped in the machine-to-machine interfaces are plannedprocessing in the near e.g., support successfully of OpenSearch [5] past project. manager. and aESE download In PROBA-V the Hortonworks distribution is deployed and Spark [10] is used ThethePDF can beMEP accessed from [6] and[9]offers the complete archives of PROBA-V and intensively to allow analytics large several time seriesother of data. The Hadoop furthermore SPOT-VEGETATION, and onalso products e.g.,ecosystem 10-dailyprovides composites from aMETOP-AVHRR rich and still growing set of tools, are hyperspectral used to provide fast andPrism secureExperiment access to the data in a and data from thewhich airborne Airborne (APEX [7]) format needed by the specific application. instrument. Also the output data i.e., results from applications running on the PROBA-V MEP can be Today pre-operational Hadoop is deployed at VITO and used within the platform ingested in athe PDF, from where theyenvironment can be downloaded by others users. to support the different applications. By end of the summer 2016 further investments are done to make the platform operations extensive monitoring is added, 3.1.2. Scalablemore Processing and friendly: Data Analytics Platform–Hadoop Clusterseveral maintenance tools are deployed and high availability is ensured on every component in the Hadoop environment. Hadoop [8], as a software framework for data-intensive distributed applications, is designed to Developing and deploying an application on the Hadoop cluster offers interesting opportunities process large amounts of data by separating the data into smaller chunks and performing large for developers, since they can run their processing workflow in a parallelised way on a powerful numbers of small parallel operations on the data. It is applied often for processing big data and is processing cluster with direct access to the full data archive. Today many of these users run their applied in this context for the on-demand processing of EO data, as prototyped successfully in the applications on a single server. It must be noted however that porting an existing application to Hadoop past ESE project. is not straightforward for many application developers. Therefore we support users intensively in this In the PROBA-V MEP the Hortonworks [9] distribution is deployed and Spark [10] is used process and several levels of integration can be considered: intensively to allow analytics on large time series of data. The Hadoop ecosystem provides a rich and growingthe setexisting of tools, application which are used provide secure access to ‚furthermore The easiest way is still to consider as a to black box. fast Theand integration is then the data in a format needed by the specific application. quite simple: (1) compile the code for CentOS 7 [11]; (2) wrap its invocation in a shell script; Today a pre-operational Hadoop environment deployed(4)atcreate VITOaand used within the (3) upload auxiliary data and executables on the isplatform; workflow using the platform to support the different applications. By end of the summer 2016 further investments are available Graphical User Interface (GUI) and finally (5) run and test the application on the doneHadoop to make the platform more operations friendly: extensive monitoring is added, several cluster. The drawback of this approach is that no parallelisation is done, hence there’s no maintenance toolsgain are deployed availability is ensured every The component inhowever the Hadoop performance of runningand thehigh application on the Hadoopon cluster. benefit is the environment. access to the full data archive. Developing and deploying an application on the Hadoop cluster offers interesting opportunities for developers, since they can run their processing workflow in a parallelised way on a powerful processing cluster with direct access to the full data archive. Today many of these users
•
The easiest way is to consider the existing application as a black box. The integration is then quite simple: (1) compile the code for CentOS 7 [11]; (2) wrap its invocation in a shell script; (3) upload auxiliary data and executables on the platform; (4) create a workflow using the available Graphical User Interface (GUI) and finally (5) run and test the application on the Hadoop Remotecluster. Sens. 2016, 8, 564 5 ofno 15 The drawback of this approach is that no parallelisation is done, hence there’s performance gain of running the application on the Hadoop cluster. The benefit is however the access to the full data archive. ‚ Because the PROBA-V synthesis products are delivered in tiles by 10˝ ˆ 10˝ , the processing • Because the PROBA-V synthesis products are delivered in tiles by 10° × 10°, the processing can can be done tile based, while keeping the application as it is. By this approach, the throughput be done tile based, while keeping the application as it is. By this approach, the throughput is is increased as each tile can be processed in parallel. In addition to what is described in the increased as each tile can be processed in parallel. In addition to what is described in the previous point, a simple Spark (Python or Java) script needs to be written to parallelise the previous point, a simple Spark (Python or Java) script needs to be written to parallelise the processing. It only requires a minimal programming knowledge in Python or Java and the processing. It only requires a minimal programming knowledge in Python or Java and the application/algorithm needs of course to support a tile based processing. application/algorithm needs of course to support a tile based processing. ‚• The The ideal, ideal, but but most most complex complex approach, approach, is is to to write write aa new new Spark Spark program program whereby whereby the the existing existing code code can can be be reused reused as as much much as as possible, possible, if if it it is is sufficiently sufficiently modular. modular. In In this this case case the the use use of of Spark Spark can learning, can be be maximised maximised and and all all Hadoop Hadoop features features can can be be exploited, exploited, e.g., e.g., distributed distributed machine machine learning, streaming, streaming, in in memory memory distributed distributed processing, processing, etc. etc. Based Based on on our our experience experience we we learned learned that, that, by by doing so, we can significantly increase the performance but a good knowledge of Hadoop doing so, we can significantly increase the performance but a good knowledge of Hadoop is is aa prerequisite thisthis approach requires considerably more development time. VITO is supporting prerequisiteand and approach requires considerably more development time. VITO is interested in the project guide them thisthrough learningthis process. supportingusers interested users intothe project to through guide them learning process. The three three different different scenarios scenarios are are illustrated illustrated in inFigure Figure2.2.
(a)
(b)
(c)
Figure 2. Several possible approaches for integrating an algorithm on the PROBA-V MEP: (a) Black Figure 2. Several possible approaches for integrating an algorithm on the PROBA-V MEP: (a) Black Box; (b) Tile based processing; (c) Maximise use of Spark. Box; (b) Tile based processing; (c) Maximise use of Spark.
3.1.3. Data Manager 3.1.3. Data Manager The EO raster data is accessible on the platform via Network File System (NFS) [12] and The raster datathe is accessible on the platform via Network File System possibly possibly EO as well from Hadoop Distributed Filesystem (HDFS) [13] where(NFS) data [12] can and be uploaded as from Manager. the Hadoop Filesystem (HDFS)with [13] several where data can bewhich uploaded by the by well the Data ThisDistributed Data Manager can interface catalogues implement Data Manager. This to Data Manager can interface withwhich several catalogues different protocols search and download data, allows us to which ingest implement data from different protocols and download data, by which allowsuser. us toNot ingest in providers to insearch the platform when needed a specific onlydata the from VITOdifferent Product providers Distribution the platform when needed a specific user. NotVITO only data the VITO Product Distribution which Facility which contains all by data available at the centre is connected to the Facility MEP, but also contains all data available the VITO data centre is connected to the MEP, but externalordata external data archives, e.g.,atthe ESA Data Hub Service for ingesting Sentinel-2 andalso Sentinel-3 the archives, e.g.,service the ESAfor Data Hub Service for Sentinel-2 Sentinel-3Aeronautics or the download download the Landsat dataingesting provided by theandNational and service Space for the Landsat data provided thedata National Aeronautics and Space Administration (NASA).on Note Administration (NASA). Noteby that ingested from an external archive is made available the that data ingested from an external archive is made available on the platform by the Data Manager for a limited period, i.e., when needed the least frequent or longest non-used data, according configuration, is removed. 3.1.4. Cloud Middleware–OpenStack Cluster Cloud computing technology enables dynamic resource provisioning and it is therefore providing a performing and scalable solution. OpenStack [14] is chosen as cloud middleware for a private cloud solution at VITO. Pre-configured Virtual Machines (VM) are offered to the users and can run on the OpenStack cluster at VITO, providing the environment needed for them to work with the data and
Remote Sens. 2016, 8, 564
6 of 15
develop/deploy applications on the platform, i.e., containing Integrated Development Environments (IDE), a rich set of tools and access to the complete data archive. Furthermore users can customise this environment by downloading more data and tools. Today the ESA Research and Service Support (RSS) Cloud Toolbox technology is used [15] to provide developers a VM with the tools they need, which run on a commercial cloud provider. By the summer 2016, these VMs can as well be configured and deployed on the VITO hosted OpenStack environment with direct access to the complete data archive available on the platform. A remote desktop access interface allows users to connect to this graphical environment from anywhere. A main concern on this component is security, since VITO allows users to develop and execute their applications on the platform, which is deployed within the VITO data centre. Furthermore we must ensure that the Intellectual Property Rights of the users are properly protected and the activities of individual users cannot influence the stability of the system and the work of other users. Single-sign-on and proper monitoring of used resources are further requirements. 3.1.5. Web Portal, Including Dashboards A Web portal accessible from proba-v-mep.esa.int, provides access to all applications and tools offered by the PROBA-V MEP and to the cloud consoles. Furthermore the portal provides all information on the data and components available on the platform and offers tools for e-collaboration and knowledge sharing amongst the users. Interactive Web-based dashboards will be designed and integrated later on in the Web portal to provide user-tailored information from the EO data archives of VITO and other providers, by combining existing components such as JavaScript libraries for dynamic charts and Geographic Information System (GIS) components into one single Web client solution. We can easily design user-tailored Web-based dashboards, which offer at any time near real-time information for the regional extent of interest for the user and in the format chosen by the user. This technology, applied on the platform, provides enormous opportunities to make the data more exploitable for a wide public, in cooperation with different stakeholders (researchers, service providers, etc.). 3.1.6. Web Services One of the key requirements of the PROBA-V MEP is to provide widely used interfaces at all levels (data discovery, data access, data analytics, on-demand processing), if possible based on open standards. Several Open Geospatial Consortium (OGC [16]) standards are used (Web Map Tile Service (WMTS [17]), Web Coverage Service (WCS [18]), Web Processing Service (WPS [19]), etc.), but also RESTful interfaces are developed and provided, since these are often less complex and can yet more easily be used by application developers. External applications can interface with these Web Services to perform a part of the processing or data analytics on the PROBA-V MEP platform. Furthermore, VITO and ESA aim to place the PROBA-V MEP within a federation of other Exploitation Platforms. Therefore the interoperability is a key requirement for the project. 3.2. Portfolio of Tools Today the platform offers already several tools/applications with varying complexity. For these tools, a Web client is provided for both human users and Web services for integration into third-party applications which can be deployed outside the platform i.e., at the users’ premises. All tools are deployed on the VITO private cloud environment, to ensure the scalability in the future. This list will be expanded in the future, also with tools from third parties. In the following subsections we describe the tools which are provided today.
This list will be expanded in the future, also with tools from third parties. In the following subsections we describe the tools which are provided today. 3.2.1. Geo Viewer RemoteWith Sens. 2016, 8, 564Viewer the Geo
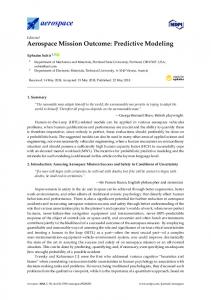
7 of 15 you can view the PROBA-V data in full resolution, as illustrated in Figure 3. The application is released in the pre-release at January 2016 for PROBA-V 1 km data. In the next months more PROBA-V data (300 m and 100 m) will become available and also derived vegetation 3.2.1. Geo Viewer parameters from the Copernicus Global Land Service [20] will be added. The Geo Viewer is backed OGC based services. It isaspossible to access these With the Geo Viewer you canbyview thestandard PROBA-V dataWeb in full resolution, illustrated in Figure 3. Webapplication services directly using a simple web at browser desktop tools such as data. QGIS In [21]. The is released in the pre-release Januaryor2016 for PROBA-V 1 km the More next information and the end points of these servicesavailable (WMS, and WMTS) are available on months more PROBA-V data (300 m and 100 m)Web will become also derived vegetation http://proba-v-mep.esa.int/applications/geo-viewer. parameters from the Copernicus Global Land Service [20] will be added.
Figure 3. 3. Geo true colour image at 1atkm spatial resolution over Figure Geo Viewer, Viewer,showing showingPROBA-V PROBA-VS10 S10TOC TOC true colour image 1 km spatial resolution Belgium. over Belgium.
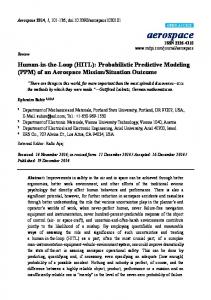
3.2.2.The Time Viewer GeoSeries Viewer is backed by OGC standard based Web services. It is possible to access these Web services usingViewer a simple web browser or desktop such asand QGIS [21]. More information Thedirectly Time Series application allows the userstools to explore view PROBA-V time series and the end points of these Web services (WMS, WMTS) are available on http://proba-v-mep.esa.int/ and in the future as well derived indicators for vegetation and environmental monitoring (Fraction applications/geo-viewer. of Absorbed Photosynthetically Active Radiation (FAPAR), Fraction of Vegetation Cover (FCOVER), Leaf Area Index (LAI), etc.) e.g., as provided by the Copernicus Global Land Service, as illustrated in 3.2.2. Time Figure 4. Series Viewer The Time Series Viewer application allows the users to explore and view PROBA-V time series and in the future as well derived indicators for vegetation and environmental monitoring (Fraction of Absorbed Photosynthetically Active Radiation (FAPAR), Fraction of Vegetation Cover (FCOVER), Leaf Area Index (LAI), etc.) e.g., as provided by the Copernicus Global Land Service, as illustrated in Figure 4. Since the pre-release in January 2016 the application is available on the PROBA-V ten-daily synthesis (S10) Top of Canopy (TOC) Normalized Difference Vegetation Index (NDVI) and rainfall data from Climate Hazards Group InfraRed Precipitation with Station data (CHIRPS) (http://chg.geog. ucsb.edu/data/chirps/) averaged over pre-defined geographical regions. Soon derived parameters from the Copernicus Global Land Service will be available as well in the application. In future releases, more data collections will be added, e.g., all radiometric bands from PROBA-V S10 both averaged over the set of predefined regional areas and at pixel level. The functionality of the application will be extended allowing a user to draw a polygon as Area of Interest (AOI) for which the time series will be calculated on-the-fly in a few seconds. Furthermore Web services are developed to integrate this service as a data feed into a user application.
Remote Sens. 2016, 8, 564 Remote Sens. 2016, 8, 564
8 of 15 8 of 16
Figure 4. Time Series Series Viewer, Viewer, showing and CHIRPS rainfall data data Figure 4. Time showing the the evolution evolution of of PROBA-V PROBA-V NDVI NDVI and CHIRPS rainfall for the Italian region Lombardia and for a single Climate Change Initiative (CCI) Land Cover value for the Italian region Lombardia and for a single Climate Change Initiative (CCI) Land Cover value ‘cropland ‘cropland rainfed’. rainfed’.
3.2.3.Since N-Daily the Compositor pre-release in January 2016 the application is available on the PROBA-V ten-daily synthesis (S10) Top of Canopy (TOC) Normalized Difference Vegetation Index (NDVI) and rainfall Temporal compositing is a general technique used in optical remote sensing. Daily observations data from Climate Hazards Group InfraRed Precipitation with Station data (CHIRPS) are composited into the temporal domain to generate proper images, e.g., to acquire cloud-free (http://chg.geog.ucsb.edu/data/chirps/) averaged over pre-defined geographical regions. Soon images. With this application you can generate ‘on-demand’ composites starting from PROBA-V derived parameters from the Copernicus Global Land Service will be available as well in the daily composite images (S1 products) defining the compositing period and choosing amongst a set of application. predefined algorithms. You can start the batch processing of a large number of composites and can In future releases, more data collections will be added, e.g., all radiometric bands from schedule this processing in the future on the arrival of more recent data. The results are distributed via PROBA-V S10 both averaged over the set of predefined regional areas and at pixel level. The the PDF, from which you can download the composite products. functionality of the application will be extended allowing a user to draw a polygon as Area of In the current pre-release from January 2016 the application is available on the full archive of Interest (AOI) for which the time series will be calculated on-the-fly in a few seconds. Furthermore PROBA-V 1 km data and the most recent year of PROBA-V 300 m data in GeoTIFF [22] format. After Web services are developed to integrate this service as a data feed into a user application. the summer 2016 the complete PROBA-V archive (including 100 m data) will be available and the functionality will be extended, e.g., to support HDF-5 [23] as file format as well. 3.2.3. N-Daily Compositor The N-daily compositor is only a first example of a ‘pre-defined on-demand processing service’. is a general technique used in optical sensing. Daily observations This Temporal illustrates compositing that an application or processing workflow from aremote third party can be deployed on the are composited into the temporal domain to generate images, to acquire cloud-free PROBA-V MEP distributed processing platform and can proper be released as ane.g., operational service to the images. With this application can generate ‘on-demand’ compositestostarting from PROBA-V wider community. If necessary,you authorisation rules can be implemented restrict the usage of the daily composite images (S1 of products) service to a limited number users. defining the compositing period and choosing amongst a set of predefined algorithms. You can start the batch processing of a large number of composites and 3.2.4.schedule Cloud Toolbox can this processing in the future on the arrival of more recent data. The results are distributed via the PDF, from which you can products. with access to the With the Cloud Toolbox, a developer ordownload researcherthe cancomposite get an environment In the data current pre-release from January is available onSNAP the full archive of PROBA-V archive and a powerful set of2016 toolsthe to application work with the data (e.g., toolbox [24], PROBA-V 1 km data and the most recent year of PROBA-V 300 m data in GeoTIFF [22] format. After GRASS GIS [25], QGIS) or to develop and test applications (using R, Python or Java). Also different the summer the[26]) complete PROBA-V archive 100 mifdata) will available libraries (e.g.,2016 GDAL and auxiliary data can be(including made available needed bybe the users. and the functionality will be extended, e.g., to support HDF-5 [23] as file format as well.
service to a limited number of users. 3.2.4. Cloud Toolbox With the Cloud Toolbox, a developer or researcher can get an environment with access to the PROBA-V data8,archive and a powerful set of tools to work with the data (e.g., SNAP toolbox9[24], Remote Sens. 2016, 564 of 15 GRASS GIS [25], QGIS) or to develop and test applications (using R, Python or Java). Also different libraries (e.g., GDAL [26]) and auxiliary data can be made available if needed by the users. In the the pre-release pre-release from from January January 2016 2016 the the Cloud Cloud Toolbox Toolbox is is released released with with sample sample PROBA-V PROBA-V data. data. In A Virtual Machine (VM) with the complete environment can be initiated via the ESA RSS Cloud A Virtual Machine (VM) with the complete environment can be initiated via the ESA RSS Cloud Toolbox service. Toolbox service. From autumn autumn 2016 2016 the theCloud CloudToolbox Toolboxcan canbebeinstantiated instantiatedatatthe the private cloud environment From private cloud environment at at VITO giving access to the complete PROBA-V data archive and complementary data needed by VITO giving access to the complete PROBA-V data archive and complementary data needed by the the users. users. The users users get get aa graphical graphical environment environment as as shown shown in in Figure Figure 55 with with access access to to all all the the PROBA-V PROBA-V The data in in aa simple simple directory directory structure. structure. Web Web services services are are available available within within the the Cloud Cloud Toolbox Toolbox providing providing data additional functionalities, e.g., for extracting a region of interest from a time series of data. additional functionalities, e.g., for extracting a region of interest from a time series of data.
Figure 5. Cloud Toolbox, offering a Virtual Research Environment to researchers and application Figure 5. Cloud Toolbox, offering a Virtual Research Environment to researchers and developers. application developers.
3.2.5. Interactive Notebooks 3.2.5. Interactive Notebooks In the future, interactive Notebooks will be provided using the Jupyter Notebook [27] In the future, interactive Notebooks will be provided using the Jupyter Notebook [27] technology, technology, providing to the users a means for interactive data analytics using Python and R via any providing to the users a means for interactive data analytics using Python and R via any Web browser. Web browser. Users can type Python commands in the Web browser and get the output Users can type Python commands in the Web browser and get the output immediately, possibly as rich immediately, possibly as rich media output. The backend of the application is powered by Spark and media output. The backend of the application is powered by Spark and ElasticSearch [28], to provide a ElasticSearch [28], to provide a fast response. fast response. Today this functionality is not yet released to the general public, but a preview is already Today this functionality is not yet released to the general public, but a preview is already available available here: http://proba-v-mep.esa.int/blog/ipython-notebooks-preview. here: http://proba-v-mep.esa.int/blog/ipython-notebooks-preview. 4. Users Since the PROBA-V user community is wide and diverse, it is important that the project addresses a wide range of users with appropriate tools ranging from tools to ‘explore time series of data’ to an agile development environment and reliable batch processing environment with flexible resource management.
Remote Sens. 2016, 8, 564
‚
‚
‚
10 of 15
The Geo Viewer and Time Series Viewer are easy to use and, therefore, targeted to the widest range of users, including those without any programming knowledge or remote sensing expertise. Both applications offer a Web client and a Web service interface. The pre-defined on-demand processing applications, of which the N-daily compositor is one example, allow users to process customised EO-products, i.e., tailored to their needs. Since a user needs to be able to use the results, the target user here is the remote sensing expert. If this expert is capable of working with Python or R, the Interactive Notebooks are suited to perform interactive data analytics. Towards researchers and application developers, the Cloud Toolbox is offered as a Virtual Research Environment with complex tools and libraries from a Virtual Machine. In this application the complexity is high, but the flexibility is maximal i.e., the user can even install additional tools or download additional data to the platform. Using the Cloud Toolbox, the user can reproduce within the MEP his own working environment, as if he/she was working at his premises, but having access to all available data archives.
To be able to address additional scenarios and user requirements in the next years and to adopt new technologies and software components, the PROBA-V MEP is developed in multiple iterations. In January 2016 a first pre-release was launched allowing the users to provide feedback on early prototypes. After the summer of 2016 a first full operational release will be deployed and two more iterations are planned roughly every nine months. Within the iterations, the development is done in bi-weekly development cycles, which allows us to adopt priorities depending on the input and feedback from users. The roadmap of the platform is explained in detail at https://proba-v-mep.esa.int/about-mep-proba-v/mep-proba-v-roadmap. Already in this pre-operational phase several beta users are involved. Some perform R and D activities on the platform and develop a prototype of a processing workflow using PROBA-V and complementary data. Others develop an operational data analytics or processing service, which runs on the PROBA-V MEP platform and connects to a front-end application running at the premises of the partner. Others develop a post-processing tool, which will be offered to other end-users on the platform to ease their work. Additionally, several cal/val activities, which are detailed in the subsection below, will be supported by the platform. This early involvement of beta users is important as their feedback and suggestions for further extensions drive the development of the platform. Calibration and Validation Applications The need of a user-driven exploitation platform for calibration and validation (cal/val) activities was already identified and consolidated in the frame of various ESA projects. Examples of cal/val users platforms were defined and implemented for MERIS Ocean Color users, the Meris Matchup In-Situ Database (MERMAID) project [29], for Land Products Validation in the frame of Committee on Earth Observation Satellites (CEOS), the On-line Validation Exercise (OLIVE) [30], as well as for the MERIS level 2 prototype processor exploitation platform, the Optical Data Processor of the European Space Agency (ODESA) system, which was successfully used for a number of research studies and cal/val activities, e.g., [31]. A set of requirements was identified and consolidated during these projects, which can be reused, as a baseline for shaping the PROBA-V MEP to the cal/val users’ community needs. The following prerequisites can be in particular recalled here, which should be fulfilled within the PROBA-V MEP: ‚
The possibility to extract area of interest (AOI) from the archive, at the polygon level or at the pixel level and to have easy access to time series of calibrated measurements over this AOI. This is typically the case for geographical areas around cal/val in situ validation sites or corresponding to the location of fiducial reference measurements (FRM). Note that FRM are defined as the suite of independent ground-measurements that provide the maximum return on investment (ROI) by
Remote Sens. 2016, 8, 564
‚
‚
11 of 15
delivering to users the required confidence in data products, in the form of independent validation results over the entire end-to-end duration of a satellite mission [32]. The possibility to systematically inter-compare Level 2 geo-physical products retrieved from satellite measurements with collocated in-situ measurements or FRM. This includes the capability to define the settings for match-up collocation, the application of basic quality filtering to the satellite data, the post-processing of the results using statistical tools, and the systematic generation of standardized scatterplots and time series plots with associated statistical metrics (e.g., mean, standard deviation). Note that for some of the geo-physical parameters of interest, validation protocols, and best practices already exist, which should be followed for performing the comparison between satellite data and ground truth; see, for instance, the example of the Leaf Area Index (LAI) best practice protocol for validation, defined in the frame of CEOS Working Ground on cal/val [33]. The possibility to plug in new user modules into the core processor, namely new Level 2 (or higher level) processing algorithms or part of the algorithm, or to tune the processing parameters and to systematically compare the new products’ outputs against the “operational” ones and with respect to the in situ data or FRM. This feature is essential during the algorithm improvement cycle, since it provides the required evidence of validity of the new algorithm and it allows measuring the improvements with respect to the current operational processor.
In the case of the PROBA-V MEP these requirements are already partially covered, e.g., the extraction of AOI, the integration of user module, and predefined processing on-demand. The requisites, which are currently not yet supported, will be progressively included during the iterative development cycles of the MEP. The final goal is to be able to sustain within the MEP a set of well-identified cal/val user scenarios. We mention here below some cal/val use cases, which are relevant specifically for PROBA-V products and applications. ‚
‚
Validation of surface reflectances. The PROBA-V higher-level products consist of atmospherically-corrected TOC reflectances, provided as daily, 5-day (only for 100 m), and 10-day synthesis products. The validation of surface reflectances is a rather complex topic, since no real “ground truth” data is available at the medium spatial resolution scale. Note that, for high-resolution sensors such as Sentinel-2 and Landsat-8, the ESA-CNES RadCalNET [34] prototype network is now defining a set of FRM, for the systematic validation of surface reflectances at the decametric scale. One of the approaches for validating surface reflectance at the hectometric scale is to use the AERONET ground-based network [35], which can be considered as a FRM. The process consists in using Radiative Transfer Model (RTM), such as LibRadtran, and the input atmospheric data retrieved from the AERONET measurements, i.e., the aerosol optical thickness (AOT) and the column water vapour content (WV), to compute “ground-truth” surface reflectances from TOA satellite measurements. These “ground-truth” surface reflectances can then be compared against the collocated operational TOC products in order to estimate their precision and accuracy. This process should be systematically available within the PROBA-V MEP as a predefined workflow, so that a typical Cal/Val or expert user can estimate the accuracy of the current processor and can also implement new algorithms (e.g., for aerosol retrieval) and see how they improve the results with respect to the current approach. Validation of Aerosol Retrieval. Another potential cal/val scenario for the PROBA-V MEP is the validation of AOT retrieval, using the AERONET network as FRM. The AOT estimation is performed within the PROBA-V processing chain using a semi-empirical approach, inherited from SPOT-VEGETATION and described in [4]. This semi-empirical approach works only for vegetated areas (NDVI > 0.2) and it lacks for intensive validation, despite the importance of aerosol correction for land applications. In order to address this need, one user scenario within the PROBA-V MEP, will be to test and validate new methods for AOT estimation, using AERONET as a “ground-truth” reference. The goal is to stimulate advances in AOT retrieval algorithms and to
Remote Sens. 2016, 8, 564
‚
12 of 15
improve the overall quality of PROBA-V operational TOC products. The typical workflow in such case consists of extracting PROBA-V TOA data over the in situ locations, apply the new aerosol algorithm, and systematically compare the AOT estimated from the satellite with the one retrieved from the ground-based AERONET measurements. Systematic production of standardized output should be considered within the workflow, such as scatterplots and temporal series of AOT for the relevant locations. Validation of Biophysical variables. The current baseline for the PROBA-V ESA products does not include biophysical variables which are, instead, nominally generated within the Copernicus Global Land Service. On the other hand, scientific users within the PROBA-V MEP can propose, develop, test, and validate new algorithms for retrieving specific biophysical products, e.g., leaf area index (LAI) and phenology from PROBA-V data. This is actually one of the major objectives of the MEP, i.e., to foster data exploitation enlarging the current products’ portfolio. These research results could potentially be taken up and qualified into the Copernicus Global Land Service at a later stage. Within this context, the new algorithm needs to be validated against reference ground-truth data in order to assess precision and accuracy. A cal/val scenario is the automatic validation of the new products using a predefined workflow within the PROBA-V MEP and a set of relevant ground-truth input data. The BELMANIP network [36], which is also used in the frame of the Copernicus Global Land Service, could be used as a validation network for this purpose. The typical workflow scenario, for such a use case, consists of the automatic extraction of the satellite derived biophysical variables over the in situ network locations, the comparison of the results with in situ data, and the provision of a standardized output in the form of scatterplots, temporal plots, and associated statistical indicators.
5. Discussion The impact of the PROBA-V MEP on the user community will be high and has the potential to completely change the way of working with the data and, hence, open the large time series to a larger community of users. A pre-release of the platform was launched in January 2016 at the PROBA-V conference in Ghent, Belgium. Three further iterations are planned to gradually expand the capabilities of the system, add access to more data and provide new features, in close collaboration with the first third party projects working on the platform. The first iteration will be released in autumn 2016 where the OpenStack and Hadoop platform with access to the full PROBA-V data archive will be opened for any user. Furthermore existing applications will be upgraded, based on early feedback from users. In the next iteration the support of Sentinel and Landsat data is ensured. The operational platform is based on recent R and D activities and is in line with the new ESA strategy on the ‘EO Ground Segment Evolution’. Hence, as future work, the integration of the platform within a federation needs to be addressed to establish links with similar platforms with complementary data and services. In the second iteration we will therefore focus on standardised interfaces to allow seamless machine-to-machine communication with applications outside the platform. Additionally, more applications and users will be integrated in the platform to enrich the content and enlarge the user community. We will not only enrich the content (data, software, tools, documentation, etc.) on the platform as requested by our users, but we can also integrate the derived products or R and D results from our users, i.e., the platform can drive partnerships between multiple actors. This is possible thanks to the scalable and open architecture. Furthermore the evolutions in Big Data analytics and processing will be followed closely and integrated in the platform where relevant, to adopt novel techniques on big data analytics and geo-spatial services continuously. An example is the integration of Jupyter notebooks as discussed earlier. The PROBA-V MEP offers a clear benefit for users of PROBA-V and SPOT-VEGETATION data compared to other platforms (e.g., Google Earth Engine) since it brings all aspects (data, tools, software,
Remote Sens. 2016, 8, 564
13 of 15
documentation) to one single platform and a researcher/developer is not forced to use a specific API or programming language which is often mandated by other platforms, but he/she can work with the tools which he/she is used to work with. Furthermore, in the future, the platform has the potential to be linked or extended with e.g., a thematic focus. 6. Conclusions The PROBA-V MEP adds a new and innovative capability to the PROBA-V user segment as an operational service, being an answer to the challenges involved in the ever increasing data volumes. Furthermore, users do not need to search tools, libraries, auxiliary data, or documentation, since the platform will gradually build this ecosystem for them. The platform has the potential to significantly enforce the collaboration between the different stakeholders and offers innovative ways to share research. By developing and offering pre-defined on-demand processing chains, users of PROBA-V data can increase the impact of their work by translating research and prototype development with limited effort into an operational processing workflow, which is published on the platform and can be used by other users. The MEP team, composed of system operators, main users and service providers are mission ambassadors, even “missionaries”. They could have a representative role in fora and international associations, committees, advisory boards and interest groups. As such, the MEP strengthens the link between “mission”, “exploitation by user”, and “service providers”. The comprehensive user support on the MEP widens opportunities for service providers by the integration of processes dedicated to downstream service exploitation, educates new generations to advanced forms of data exploitation, scales up science potential, and empowers community-building and networking. More information on the Mission Exploitation Platform PROBA-V is available online at http: //www.proba-v-mep.esa.int. Please use the contact link to request further information or work more close with us on the platform. Acknowledgments: The development and operations within the PROBA-V MEP project are sponsored by ESA under the Earthwatch programme with the support of the Belgian Science Policy (BELSPO). It builds further on previous R&D activities in ESA/GSTP and EC/FP-7 projects. Author Contributions: The project is executed by VITO as prime contractor and TRASYS and Spacebel as subcontractors. Erwin Goor (VITO) acts as project manager and Jeroen Dries (VITO) takes the technical lead, supervising the technical work from the different partners. Philippe Mougnaud (ESA), supported by Andrea Della Vecchia (ESA), acts as technical officer for the project and Fabrizio Niro (ESA) provides support for the definition of the MEP Cal/Val requirements. Conflicts of Interest: The authors declare no conflict of interest.
Abbreviations The following abbreviations are used in this manuscript: AERONET AOI AOT APEX BELMANIP BELSPO Cal/Val CCI CEOS CHIRPS CNES EC EO EP ESA
Aerosol Robotic Network Area Of Interest Aerosol Optical Thickness Airborne Prism Experiment Benchmark Land Multisite Analysis and Intercomparison of Products Belgian Science Policy Calibration and Validation Climate Change Initiative Committee on Earth Observation Satellites Climate Hazards Group InfraRed Precipitation with Station data Centre National d’Etudes Spatiales (France) European Commission Earth Observation Exploitation Platform European Space Agency
Remote Sens. 2016, 8, 564
ESE FAPAR FCOVER FRM GIS GSTP GUI HDF HDFS ICT IDE IPR LAI MEP NASA NDVI NFS OBEOS OGC OS PDF PROBA-V R&D REST ROI RSS RTM S1 S10 SNAP SOAP TOA TOC VITO VM WCS WMS WMTS WPS
14 of 15
Enhanced Service Support Environment Fraction of Absorbed Photosynthetically Active Radiation Fraction of Vegetation Cover Fiducial Reference Measurements Geographic Information System General Support Technology Programme Graphical User Interface Hierarchical Data Format Hadoop Distributed File System Information and Communication Technology Integrated Development Environment Intellectual Property Rights Leaf Area Index Mission Exploitation Platform National Aeronautics and Space Administration (U.S.A.) Normalized Difference Vegetation Index Network File System Ontology Based EO Search Open Geospatial Consortium Operating System Product Distribution Facility PROBA Vegetation–Project for On-Board Autonomy-Vegetation Research and Development Representational State Transfer Return on Investment Research and Service Support Radiative Transfer Model Daily Synthesis ten-daily Synthesis Sentinel Application Platform Simple Object Access Protocol Top of Atmosphere Top of Canopy Vlaamse Instelling voor Technologisch Onderzoek Virtual Machine Web Coverage Service Web Map Service Web Map Tile Service Web Processing Service
References 1. 2. 3.
4. 5. 6. 7. 8. 9. 10. 11. 12. 13.
PROBA-V Mission Exploitation Platform. Available online: http://proba-v-mep.esa.int/ (accessed on 29 June 2016). PROBA-V Web Site. Available online: http://proba-v.vgt.vito.be (accessed on 29 June 2016). Dierckx, W.; Sterckx, S.; Benhadj, I.; Livens, S.; Duhoux, G.; Van Achteren, T.; Francois, M.; Mellab, K.; Saint, G. PROBA-V mission for global vegetation monitoring: Standard products and image quality. Int. J. Remote Sens. 2014, 35, 2589–2614. [CrossRef] Maisongrande, P.; Duchemin, B.; Dedieu, G. VEGETATION/SPOT: An operational mission for the Earth monitoring; presentation of new standard products. Int. J. Remote Sens. 2004, 25, 9–14. [CrossRef] OpenSearch. Available online: http://www.opensearch.org/Home (accessed on 29 June 2016). VITO Product Distribution Facility. Available online: http://www.vito-eodata.be (accessed on 29 June 2016). APEX. Available online: http://www.apex-esa.org/ (accessed on 29 June 2016). Hadoop. Available online: http://hadoop.apache.org/ (accessed on 29 June 2016). Hortonworks. Available online: http://hortonworks.com/ (accessed on 29 June 2016). Spark. Available online: http://spark.apache.org/ (accessed on 29 June 2016). CentOS 7. Available online: https://www.centos.org/ (accessed on 29 June 2016). NFS. Available online: https://en.wikipedia.org/wiki/Network_File_System (accessed on 29 June 2016). HDFS. Available online: https://hadoop.apache.org/docs/r1.2.1/hdfs_design.html (accessed on 29 June 2016).
Remote Sens. 2016, 8, 564
14. 15. 16. 17. 18. 19. 20. 21. 22. 23. 24. 25. 26. 27. 28. 29.
30.
31.
32.
33.
34.
35.
36.
15 of 15
OpenStack. Available online: https://www.openstack.org/ (accessed on 29 June 2016). ESA RSS Cloud Toolbox. Available online: http://eogrid.esrin.esa.int/cloudtoolbox (accessed on 29 June 2016). OGC. Available online: http://www.opengeospatial.org/ (accessed on 29 June 2016). WMTS. Available online: http://www.opengeospatial.org/standards/wmts (accessed on 29 June 2016). WCS. Available online: http://www.opengeospatial.org/standards/wcs (accessed on 29 June 2016). WPS. Available online: http://www.opengeospatial.org/standards/wps (accessed on 29 June 2016). Copernicus Global Land Service Web Site. Available online: http://land.copernicus.eu/global (accessed on 29 June 2016). QGIS. Available online: http://www.qgis.org (accessed on 29 June 2016). GeoTIFF. Available online: https://trac.osgeo.org/geotiff/ (accessed on 29 June 2016). HDF-5. Available online: https://www.hdfgroup.org/HDF5/ (accessed on 29 June 2016). SNAP Toolbox. Available online: http://step.esa.int/main/toolboxes/snap/ (accessed on 29 June 2016). GRASS GIS. Available online: https://grass.osgeo.org/ (accessed on 29 June 2016). GDAL. Available online: http://www.gdal.org/ (accessed on 29 June 2016). Jupyter Notebook. Available online: http://jupyter.org/ (accessed on 29 June 2016). ElasticSearch. Available online: https://www.elastic.co/ (accessed on 29 June 2016). Barker, K.; Mazeran, C.; Lerebourg, C.; Bouvet, M.; Antoine, D.; Ondrusek, M.; Zibordi, G.; Lavender, S. MERMAID: The MERis MAtchup in-situ Database. In Proceedings of the 2nd MERIS (A) ATSR Users Workshop, Frascati, Italy, 22–26 September 2008. Weiss, M.; Baret, F.; Block, T.; Koetz, B.; Burini, A.; Scholze, B.; Lecharpentier, P.; Brockmann, C.; Fernandes, R.; Plummer, S.; et al. On Line Validation Exercise (OLIVE): A web based service for the validation of medium resolution land products. Application to FAPAR products. Remote Sens. 2014, 6, 4190–4216. [CrossRef] Blondeau-Patissier, D.; Schroeder, T.; Brando, V.E.; Maier, S.W.; Dekker, A.G.; Phinn, S. ESA-MERIS 10-year mission reveals contrasting phytoplankton bloom dynamics in two tropical regions of Northern Australia. Remote Sens. 2014, 6, 2963–2988. [CrossRef] Theocharous, E.; Fox, N.P. Fiducial Reference Measurements for Validation of Surface Temperature from Satellites (FRM4STS)-Laboratory Calibration of Participants Radiometers and Blackbodies; Protocol for the FRM4STS LCE (LCE-IP), ESA Contract No. 4000113848_15I-LG, NPL report OFE-D-90A-V1-Iss-1-Ver-1; National Physical Laboratory: Teddington, Middlesex, UK, 2015. Morisette, J.T.; Baret, F.; Privette, J.L.; Myneni, R.B.; Nickeson, J.E.; Garrigues, S.; Shabanov, N.V.; Weiss, M.; Fernandes, R.A.; Leblanc, S.G.; et al. Validation of global moderate-resolution LAI products: A framework proposed within the CEOS land product validation subgroup. IEEE Trans. Geosci. Remote Sens. 2006, 44, 1804–1817. [CrossRef] Main-Knorn, M.; Pflug, B.; Debaecker, V.; Louis, J. Calibration and Validation Plan for the L2A Processor and Products of the Sentinel-2 Mission. Int. Arch. Photogramm. Remote Sens. Spat. Inf. Sci. 2015, 40, 1249–1255. [CrossRef] Holben, B.N.; Eck, T.F.; Slutsker, I.; Tanre, D.; Buis, J.P.; Setzer, A.; Vermote, E.; Reagan, J.A.; Kaufman, Y.J.; Nakajima, T.; et al. AERONET—A federated instrument network and data archive for aerosol characterization. Remote Sens. Environ. 1998, 66, 1–16. [CrossRef] Baret, F.; Morissette, J.T.; Fernandes, R.A.; Champeaux, J.L.; Myneni, R.B.; Chen, J.; Plummer, S.; Weiss, M.; Bacour, C.; Garrigues, S.; et al. Evaluation of the representativeness of networks of sites for the global validation and intercomparison of land biophysical products: Proposition of the CEOS-BELMANIP. IEEE Trans. Geosci. Remote Sens. 2006, 44, 1794–1803. [CrossRef] © 2016 by the authors; licensee MDPI, Basel, Switzerland. This article is an open access article distributed under the terms and conditions of the Creative Commons Attribution (CC-BY) license (http://creativecommons.org/licenses/by/4.0/).