126
IEEE TRANSACTIONS ON EDUCATION, VOL. 55, NO. 1, FEBRUARY 2012
Problem-Based Learning in Wind Energy Using Virtual and Real Setups David Santos-Martin, Jaime Alonso-Martínez, Joaquin Eloy-Garcia Carrasco, and Santiago Arnaltes, Member, IEEE
Abstract—The use of wind energy is now an established fact, and many educational institutions are introducing this topic into their engineering studies. Problem-based learning (PBL), as a student-centered instructional approach, has contributed to important developments in engineering education over the last few years. This paper presents the experience of a problem-based learning approach within the context of teaching wind energy conversion systems for electricity generation at an Electrical and Electronic Master’s degree level. Students were given the problem of finding the response of a wind turbine to a grid fault. Groups of three students worked on a cooperative learning project for 15 weeks, with the instructor providing resource assistance and information at all stages of the work. Two tools were designed to help the students: a virtual wind turbine simulator and a real wind turbine setup. Both experimental tools are described, and the results obtained by the students are discussed. The results show that the students valued both tools and were able to address problems at a high cognitive level. Index Terms—Grid fault, laboratory setup, problem-based learning (PBL), simulator, wind turbine.
L
I. INTRODUCTION
ARGE-SCALE wind energy integration is becoming an established technology as social concerns for clean and sustainable energy increase. In many countries, such as Germany, Spain, and Denmark, new grid codes have been established [1]. These new rules are continuously evolving and conditioning wind turbine and wind farm design. The wind energy industry is boosting the demand for qualified electrical, electronic, and control engineers who can understand and cope with the difficulties inherent in the wide range of disciplines involved. This demand is motivating universities to provide courses that enable engineers and researchers to meet the challenges they will face in their professional careers. Traditional lectures and laboratory teaching do not seem to be an optimal approach for such a dynamic and complex field, where the ability to engage in self-directed lifelong learning is considered a need [2]. Inductive teaching methods suggest that deep (meaning-oriented) methods of learning are more likely to achieve understanding and assist learning than are surface (memorization-intensive and mechanical substitution) approaches [2].
Manuscript received October 25, 2010; revised February 04, 2011; accepted April 17, 2011. Date of publication May 19, 2011; date of current version February 03, 2012. The authors are with the Department of Electrical Engineering, University Carlos III, Leganés, Madrid 28911, Spain (e-mail:
[email protected]). Color versions of one or more of the figures in this paper are available online at http://ieeexplore.ieee.org. Digital Object Identifier 10.1109/TE.2011.2151195
Students who use deep approaches get higher grades retain the information in their long-term memory and are able to apply their knowledge to multiple subjects. Although conventional lectures cannot offer these deep approaches to learning, small groups working in a cooperative learning mode encourage student autonomy and provide high-learning outcomes. A very effective mode of implementing the constructivist methodology consists of using the problem-based learning (PBL) paradigm to guide the search for knowledge [3]. PBL is a student-centered instructional strategy; the approach employs a problem situation to guide the learning activities on a need-to-know basis. The problem situation must be new to the student and require, for a satisfactory resolution, more information than his/her current knowledge can provide. The student is stimulated to search the available sources of knowledge to acquire the necessary elements to solve the problem; the responsibility for learning and solving is therefore placed on the student. This approach integrates the learning of contents and skills and focuses on a “learning-to-learn” strategy. In PBL, teachers do not instill knowledge in the students—they act as a guide, resource provider, and evaluator. PBL was first introduced at Maastricht University, Maastricht, The Netherlands, in 1974 as an educational approach used for the medical program [4]. Since then, this model has been applied to the engineering field in many academic institutions, such as Aalborg University, Aalborg, Denmark [5]. Students are organized in small groups and use a systematic approach, the so-called seven steps [6], [7], [36], which can be described as the following: clarifying concepts, defining the problem, analyzing the problem (brainstorming and systematic classification), formulating learning objectives, self-study, and reporting. Engineers are trained to become professionals whose main task is to offer practical and innovative solutions to problems in their field of professional work. The main idea behind this approach is to build the required skills by allowing future engineers to undergo problem-solving experiences in controlled environments. PBL has been used successfully in teaching electronic, electrical, and control engineering courses [8]–[14]. Some works recognize the effort needed to motivate students in laboratory work, particularly in the fields of machines, drives, and renewable energy [15]–[19]. More research has been carried out to include virtual laboratories that aim to enhance learning [20], [21] or as an alternative to real laboratories [22]–[26]. Although much work has been done, the impact of PBL in renewable energy courses, for wind energy in particular, can still be increased and improved.
0018-9359/$26.00 © 2011 IEEE
SANTOS-MARTIN et al.: PBL IN WIND ENERGY USING VIRTUAL AND REAL SETUPS
127
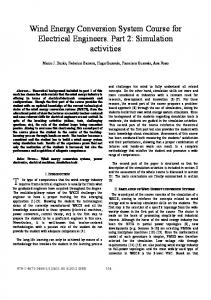
The objectives of PBL are the following: to allow students to analyze a complex key problem in wind energy; to defend their solutions with coherent arguments; to practice their criticism; to connect the proposed problem to the theories of all the disciplines involved, and to discover the usefulness and limits of simulation versus the outcomes and difficulties of real experiments. PBL is inherently a student-centered approach that provides exactly the type of problems that students should be trained to address throughout their careers. This study was designated to assess the problem-based learning approach when applied in a high-level education course such as “Wind Energy Conversion Systems for Electricity Generation.” To achieve the desired objectives, both a virtual and a real setup were provided to the students. II. MATERIAL AND METHODS Wind Energy Conversion Systems for Electricity Generation is a first-year course in the Master’s degree in Electrical, Electronics, and Control Engineering at the University Carlos III of Madrid, Spain. Conducted over 15 weeks, the course consists of a weekly 2-h supporting lecture and a 1-h tutorial. The topics covered in the course include wind resource, a technology overview, control systems, wind farms, and grid codes. For the four years from 2006 to 2010, the traditional approach was based on lectures and some practical laboratory sessions, but some basic knowledge gaps were always identified. In the scenario presented here, some of the students enrolled during the last year (2010) followed a PBL-based approach, where the lectures were limited to explaining the theoretical basis of the subject and the PBL module was substituted for the practical work. A wind turbine is characterized by being a complex multidisciplinary problem [27]. In this case, two complementary work environments were chosen: virtual and real platforms. The students were divided into groups of three. Both platforms, as well as the course design and assessment method, are described in detail. A. Virtual Platform Dealing with complex systems such as wind turbines is not an easy task. The complete model of a wind turbine [28], [29] was developed (Fig. 1) and implemented in MATLAB/Simulink to allow the students to study the basic concepts of wind energy conversion systems. The wind turbine model included a 3-D mechanical model of the tower, nacelle, and blades, the hydraulic pitch actuators, electrical yaw actuators, a doubly fed induction generator (DFIG), and the electrical grid model. The level of complexity of each part of the model (aerodynamics, blades, drive train, gearbox, yaw system, generator, and power converters) can be defined in order to find a proper balance between the simulation time and the information sought. In Fig. 1, from the given wind input, the aerodynamic model of the blade will produce the lift and drag forces, providing the driving torque of the wind turbine rotor at the hub. This torque is then transmitted through the gearbox to the generator shaft. In turn, the generator will provide the rotational speed to the whole mechanical train.
Fig. 1. Block diagram of the wind turbine model.
The wind input is also used by the controller to control the wind turbine rotor orientation through the yaw controller, the wind turbine output through the pitch controller, and the rotor speed through the electrical generator. By simply placing the mouse on the different blocks and clicking on the right button, a “block choice” menu is displayed with various available options, shown in Table I. The options are the following. — For “Turbine input wind,” when “Commands” is selected, the torque, yaw, and pitch are fixed to a constant value. For “Wind” or “High wind” selections, the wind speed and direction become a time-varying function. — For “Blade load,” when “Lift-drag” is selected, a singleelement blade provides the lift and the drag forces. For the “Segments” option, the blade is discretized into multiple parts, and the aerodynamics loads are calculated locally. For the “Torque” option, a constant torque value is assumed. — For “Main Controller,” when “Direct input” is selected, the pitch and yaw commands are constant values. For the “Wind input” option, the controller defines the turbine state and commands the pitch and turbine brakes with the wind and generator speed as data. — For “Nacelle: Pitch,” the blades pitch system can be selected with various dynamics such as “Hydraulic,” “Ideal,” or “Locked.” — For “Nacelle: Gear train,” a constant torque can be transmitted with “Empty” or a three-stage gearbox selected with “Ideal.” — For “Nacelle: Generator,” an “Asynchronous” (squirrel cage) or a “DFIG” can be selected. — For “Nacelle: Yaw,” various options can be selected to drive the four yaw gears: “Ideal actuator” with a nonlimited amount of torque and speed; “Ideal motor” with a four-stage planetary gearbox that allows the application
128
IEEE TRANSACTIONS ON EDUCATION, VOL. 55, NO. 1, FEBRUARY 2012
TABLE I SIMULATION MODEL: OPTIONS AVAILABLE
Fig. 3. Electrical diagram of the experimental workbench.
Fig. 2. Wind turbine model: 3-D motion graphics and variables plots.
of the necessary torque at the specified rotating speed; “Locked” with no rotation of the nacelle; and “Servomotor” with a real servomotor coupled to the four-stage planetary gearbox, adding more dynamics to the overall system. All these options allow students to compare different configurations or focus on component dynamics while disregarding others. The programming tool SimMechanics visualizes the mechanic elements on a 3-D motion model, shown in Fig. 2, so students have a better understanding of the general operation. B. Real Setup Although a simulation allows students to study the problem and evaluate possible solutions without risk and very quickly, it cannot replace experience on a real setup. Therefore, to supplement the virtual platform, the students had a real workbench at their disposal, shown in Fig. 3, as well as guidance from an instructor. The workbench, shown in Fig. 4, consists of the following elements: — a 20-kW DFIG driven by an ac motor drive emulating a wind turbine;
Fig. 4. Experimental workbench.
— a control cabinet consisting of a control board, power electronics converters, measuring probes, and electrical switchgear; — a voltage dip generator; — a supervisory control and data acquisition system. 1) Control and Power Cabinet: As shown in Fig. 4, a control cabinet with associated power electronic modules was designed, which complied with the usual security standards applied for industrial products. The control board used was the Dspace1006 [30] with modular I/O hardware. The programming environment allows the automatic download of Simulink models. The time cycle for the control process and the pulse width modulation (PWM) generation was set to 100 s.
SANTOS-MARTIN et al.: PBL IN WIND ENERGY USING VIRTUAL AND REAL SETUPS
129
TABLE II DFIG (MW) MAIN TYPICAL CHARACTERISTICS
Fig. 5. Power coefficient versus
Fig. 6. Turbine torque versus rotational speed characteristic.
at various .
The power electronics consists of two back-to-back threephase IGBTs inverters (Semikube-Semikron) including drivers and all the needed elements. The dc link voltage level was set at 550 V . The measuring probes for currents and voltages are Hall effect-based (LEM) with DC-100 kHz bandwidth to allow the students to analyze all types of transients. 2) Motor-Generator Bench: To emulate the torque developed by a variable-speed wind turbine with a DFIG, an electrical ac drive was used to drive a DFIG. The electrical drive is controlled in “torque mode” and is capable of tracking the torque command generated by the SCADA system and obtained from a wind temporal data. From wind data, the wind turbine power is obtained from (1) where is the air density, is the rotor area, is the wind veis the wind turbine power coefficient. is oblocity, and tained from a lookup graph, shown in Fig. 5, as a function of the pitch angle and the tip speed ratio defined as (2) where is the rotational speed and the turbine radius. The rotational speed is obtained from a differential encoder with 5000 pulses/revolution mounted in the generator shaft. Finally, the torque command for the drive is obtained as (3) The resulting torque-speed characteristic of the wind turbine is shown in Fig. 6 with the maximum power characteristic (4)
TABLE III DFIG (MW) EQUIVALENT CIRCUIT PARAMETER VALUES
This optimal characteristic, Fig. 6, is calculated and used to implement the maximum power point tracking (MPPT) control strategy. MPPT is then achieved through the generator torque control by setting the torque command obtained from (1). The three-phase 20-kW DFIG was specifically designed for this workbench to have similar characteristics to those of a typical MW unit, shown in Table II. These characteristics are the following [31]: stator and rotor time constant, no-load reactive power, stator-rotor turn ratio, and finally the typical generator parameters, shown in Table III. It is important to note from the experience that using small-scale generators with no specifications may lead to results for the rotor and stator current ratio, load consumptions, and current dynamics that are very different from real-scale results, which might lead to confusion when faced with real-world situations. The typical generator parameter, resistance ( ) and inductance ( ) values are listed in Table III. According to these specifications, the generator designed and built has the characteristics shown in Table IV. 3) Voltage Dip Generator: To generate balanced and unbalanced voltage dips, a voltage dip generator was developed consisting of three autotransformers and one delta-wye transformer to eliminate the zero sequence component. With the three autotransformers, the voltage during the dip can be set independently at each phase. Power electronic switches are used to switch from the grid supply to the autotransformer output and, in this way, to generate voltage dips at each phase. The voltage dip duration
130
IEEE TRANSACTIONS ON EDUCATION, VOL. 55, NO. 1, FEBRUARY 2012
TABLE IV 20 kW DFIG MAIN PARAMETERS
Fig. 7. Supervisory control and data acquisition (SCADA) system based on Labview.
can be controlled by means of a timer relay and the SCADA system that commands the IGBT drivers. 4) Supervisory Control and Data Acquisition (SCADA): To allow students to work in a user-friendly and secure environment, a SCADA was created based on National Instruments (NI) acquisition boards [32] and Labview software, shown in Fig. 7. As seen in Fig. 6, current and voltage transducers were installed in the control cabinet at every point of interest. These signals are plugged into an NI board (PCI-6254, M-Series) with 32 analog inputs and 48 digital I/O. The board was mounted in a conventional PC. This software provided the students with the control, acquisition, and supervisory functions and allowed them to perform some basic calculations, such as power or signal filtering. Fig. 8 shows an example of the plot results that the students can see during a voltage dip test. This figure shows how students can select the voltage depth or the unbalance factor and study the consequences in the electrical variables. They can also select whether to apply the ready-developed control strategy and whether to compare its influence. All these analyses are key objectives during the real setup work. C. Course Design and Assessment The course was designed to achieve specific outcomes that fall in three domains: 1) planning and definition of the learning
objectives; 2) instruction method to deliver the specific content; and 3) assessment and evaluation. The desired outcomes that students are expected to acquire by applying PBL in the program were formulated to meet the requirements of the ABET [33] engineering criteria and can be resumed as the ability to do the following: 1) apply knowledge of engineering; 2) conduct experiments, analyze and interpret data; 3) design systems that match specific needs; 4) function on multidisciplinary teams; 5) identify, formulate, and solve engineering problems; 6) communicate effectively; 7) use the techniques, skills, and modern engineering tools necessary for engineering practice; 8) recognize the need to engage in lifelong learning. 1) Course Learning Objectives: At the end of the course, the students are expected to have done the following: • know and understand all the electrical, mechanical, and aerodynamic subsystems and components of a wind turbine; • learned about the current grid code influence on wind turbine designs, analyzing voltage dips as an example; • simulated wind turbine behavior with MATLAB/Simulink and reported the results; • understand the pros and cons of designing and carrying out an experiment in virtual and real setups; • learned the stages of team functioning and be able to outline the responsibilities of a team. 2) Instruction Method: Conducted over 15 weeks, the 6-ECTS-credit course consists of a weekly 2-h support lecture and a 1-h tutorial. Students are also expected to perform another 105 h of personal work as part of the PBL course. The total workload is therefore 150 h, listed in Table V, directly related to the desired outcomes. The topics covered in the lectures include wind resource, technology overview, control systems, wind farms, and grid codes. In the scenario described here, the lectures focused on the theoretical basis, and the practical work was replaced by the PBL module, which started at the beginning of the semester and consisted of 105 h of personal work. The students had to define and solve their wind-turbine-related problem within the virtual and laboratory setup and within these 105 h, although the 1-h tutorial was used for the laboratory work in most cases. It was mandatory to use both platforms. The instructor gave close guidance during the laboratory sessions because of the complexity of the test bench. Although the problem topic was multidisciplinary, each group had to detail whether the analysis was predominantly electrical, mechanical, or aerodynamic. The instructor had to approve the specific objectives and ensure that all groups had different challenges. The virtual platform was mainly used to customize the subsystem choices and vary parameters or to include scopes where needed. The laboratory work consisted of a demonstration by the instructor to achieve task 3 (Table V), and the provision of guidance as requested to solve problems.
SANTOS-MARTIN et al.: PBL IN WIND ENERGY USING VIRTUAL AND REAL SETUPS
131
Fig. 8. DFIG response during a voltage dip (from top to bottom): (a) stator voltage, (b) stator current, (c) rotor current, (d) stator active power, (e) stator reactive power, and (f) air-gap power.
TABLE V INSTRUCTION METHOD. THE ESTIMATED HOURS OF THE PBL TASKS ARE PER STUDENT. WHEN SHARING THE WORK AMONG THE HOURS DEDICATED TO SOLVING THE PROBLEM ARE MULTIPLIED BY THE NUMBER OF STUDENTS
3) Assessment and Evaluation: An evaluation of the written report was carried out. Then, the student’s observations, participation, and interest during the lessons were taken into account. Several tools were used to assess the course work in order to make sure that the evaluation method was both valid and reliable. These tools were the following: • student assessment during lecture and tutorial hours (extra 20%); • assessment of the written report (40%); • assessment of the oral presentation (60%). The first assessment tool, on an individual student basis, considered the day-by-day contribution in the classroom with questions and answers. The assessment of the written report, deliv-
THE
GROUP,
ered before the last lecture, was common to all group members and took into account the quality of the results and the complexity of the objectives. The oral assessment, at the end of the course, consisted of each individual student of each group presenting his/her contribution to the joint project. All students and groups had to answer any questions and/or clarify any concerns that were raised by the instructor or other students. The oral knowledge shown in the exam became the driving force behind student learning. Finally, the students were asked to rate, in an anonymous questionnaire shown in Table VI, their understanding of what they think PBL involves, keeping the same format applied to the traditional method.
132
IEEE TRANSACTIONS ON EDUCATION, VOL. 55, NO. 1, FEBRUARY 2012
TABLE VI ANONYMOUS QUESTIONNAIRE
TABLE VII FINAL GRADES WITH THE TRADITIONAL AND PBL APPROACH
III. RESULTS AND DISCUSSION Some researchers emphasize that PBL should involve openended problems that are not clearly defined, as those usually encountered by engineers and designers. In this course, the chosen topic was voltage dips in wind turbines, but the specific problem was open and had to be defined by the students, with a virtual and a real setup being available as resources for their research. All the students rated, in an anonymous questionnaire, their understanding of what they think PBL involves. Although the questions were designed for the traditional method, see Table VI, it can be seen that the students value the level of acquired knowledge and express their overall satisfaction with this course. The final grades obtained by the 12 students, in four groups, who followed the PBL approach were better than those obtained by the 15 students following the traditional teaching approach, shown in Table VII. It is necessary to note that the assessment was split in the traditional approach, with 90% being for the written report and 10% for the laboratory. The PBL approach aroused great interest in the students, as they had to define and achieve a specific goal; and their discussions were frequent and deep as they started to discover new concepts and information. The most common opinions were the following. — The idea of defining the problem for themselves caused some anxiety during the first weeks. However, as soon as they accepted the responsibility, and with the help and support of their teacher, they started to feel more confident.
— The difficulty of working with the virtual setup was a handicap to those students less skilled in Simulink software, but in the end all of them achieved the knowledge needed to use this basic tool not only to solve the problem, but also to define it. A lack of prior knowledge seemed to limit the students’ understanding of why the simulation responds in the way it does. — There was less interactivity with the real setup due to the effort required in terms of time from the students and the supporting staff. However, students became very aware of the advantages and disadvantages of virtual and real systems. — As the groups were small, with only three students in each, the sharing of tasks was not a challenge. — Compared to the traditional approach, the interest of students in wind energy increased considerably, as shown in the questionnaire in Table V, and in the large number of questions discussed with the teacher. — Although the course is within an Electrical and Electronic Engineering degree program, it was surprising to see the interest shown by the students in other fields, such as mechanics or aerodynamics, as they discovered they could interact with the simulation model. — Although the students were generally very satisfied, they considered that they had to dedicate a lot of hours of working in PBL and that the real setup was very time-consuming. Most of the students avoided the use of the laboratory setup due to its complexity and dependence on a schedule. Therefore, it would be advantageous to simplify this by improving the SCADA interface. — The virtual platform should be improved by including new options such as full-converter-based wind turbines. The idea of developing a virtual laboratory to complement, but not replace, existing physical laboratories is not new. References [34] and [35] evaluate both options and indicate that no significant difference in student learning results from using virtual versus physical laboratories, although the feedback from students indicates that the complete removal of physical laboratories would not be welcome. As a recent example, in [20] and [21] the authors claim that the combination of these two tools allows students to engage more fully in aspects such as
SANTOS-MARTIN et al.: PBL IN WIND ENERGY USING VIRTUAL AND REAL SETUPS
experimental strategy, analysis, and interpretation of data and the iterative process of redesign. Although more data should be collected on the use of PBL in wind energy education, and the assessment questionnaires should be improved, this work supports the idea that the combination of both virtual and real laboratories is valuable for teaching about wind turbines. One question that remains open is how to facilitate the use of such a complicated system as a real wind turbine laboratory, as PBL students tend to use the virtual laboratory due to its ease of use. In some studies such as [19], miniature motors and drives were used so that students could safely experiment in the laboratory, but the authors believe that a minimum size is desirable in order to warn students about the real challenges and risks found in the real world. The positive results of this work are also found in another project-based learning experience applied to renewable energy, [15], although in this case only the virtual laboratory achieved the proposed outcomes. To strengthen the analysis of PBL experiences, more detailed student questionnaires need to be implemented; good examples are [14], [15], [18], [22], and [25]. IV. CONCLUSION The difficulty of carrying out a conclusive comparison between the traditional and PBL approach to learning has been generally accepted, and therefore this paper aims to strengthen an inferred generalization. With the PBL approach, the students become actively engaged in deep learning. This proves the assumption that the learner is a responsive, active agent in the process of knowledge construction. Students felt increasingly confident as the outcomes confirmed their hypothesis, and they therefore developed a situational interest that motivated them to continue with their tasks. In terms of learning outcomes, the students have confirmed that the real and virtual laboratories successfully lead to an engagement in deep cognitive processing, although they considered the real setup excessively time-consuming. Students have shown in this project that it is possible to learn about wind turbines as self-directed, independent, and interdependent learners, motivated in problem solving. When using a virtual setup, the students can focus their entire processing cognitive load while minimizing the extraneous cognitive load, usually related to experimental tasks. The virtual model makes it easier for students to revisit specific parts, explore in depth, test ideas, and receive feedback. All of the choices for every subsystem oblige students to customize the simulation while questioning the differences. The grades and student evaluation for this type of learning strategy have been considerably better with the PBL than with the conventional approach, although it must be taken into account that the assessment methods were different. It is interesting to remember that the former approach achieves the described program outcomes, while the conventional approach basically aims to apply engineering knowledge and to conduct experiments through conventional lectures and laboratory work. This learning approach could be applied to any other disciplines related to wind turbines by simply redefining the problem to be solved and the virtual and real setup tools.
133
REFERENCES [1] C. Jauch, J. Matevosyan, T. Ackerman, and S. Bolik, “International comparison of requirements for connection of wind turbines to power systems,” Wind Energy, vol. 8, no. 3, pp. 295–306, Jul. 2005. [2] M. Prince and R. M. Felder, “Inductive teaching and learning methods: Definitions, comparisons, and research bases,” J. Eng. Educ., vol. 95, no. 2, pp. 123–138, 2006. [3] J. C. Perrenet, P. A. J. Bouhuijs, and J. G. M. M. Smits, “The suitability of problem-based learning for engineering education: Theory and practice,” Teach. Higher Educ., vol. 5, no. 3, pp. 345–358, 2000. [4] H. S. Barrows and R. Tamblyn, Problem-Based Learning: An Approach to Medical Education. New York: Springer, 1980. [5] F. Kjersdam and S. Enemark, The Aalborg Experiment: Project innovation in university education. Aalborg, Denmark: Aalborg Univ. Press, 1994. [6] H. G. Schmidt, “Problem-based learning: Rationale and description,” Med. Educ., vol. 17, pp. 11–16, 1983. [7] P. A. J. Bouhuijs and W. H. Gijselaers, Course Construction in Problem-Based Learning, in Educational Strategy. Maastricht, The Netherlands: Network, 1993, pp. 79–90. [8] E. Montero and M. J. González, “Student engagement in a structured problem-based approach to learning: A first-year electronic engineering study module on heat transfer,” IEEE Trans. Educ., vol. 52, no. 2, pp. 214–221, May 2009. [9] A. Nonclercq, A. V. Biest, K. D. Cuyper, E. Leroy, D. L. Martinez, and F. Robert, “Problem-based learning in instrumentation: Synergism of real and virtual modular acquisition chains,” IEEE Trans. Educ., vol. 53, no. 2, pp. 234–242, May 2010. [10] L. R. J. Costa, M. Honkala, and A. Lehtovuori, “Applying the problembased learning approach to teach elementary circuit analysis,” IEEE Trans. Educ., vol. 50, no. 1, pp. 41–48, Feb. 2007. [11] M. M. T. Valdez, C. I. F. Agreira, C. M. Ferreira, and F. P. M. Barbosa, “Lighting design course in an electrical engineering program using problem-based learning,” in Proc. EAEEIE Annu. Conf., Valencia, Spain, Nov. 2009, pp. 1–6. [12] A. Mantri, S. Dutt, J. P. Gupta, and M. Chitkara, “Design and evaluation of a PBL-based course in analog electronics,” IEEE Trans. Educ., vol. 51, no. 4, pp. 432–438, Nov. 2008. [13] R. H. Chu, D. D. Lu, and S. Sathiakumar, “Project-based lab teaching for power electronics and drives,” IEEE Trans. Educ., vol. 51, no. 1, pp. 108–113, Feb. 2008. [14] J. E. Mitchell, B. Canavan, and J. Smith, “Problem-based learning in communication systems: Student perceptions and achievement,” Development, vol. 53, pp. 587–594, 2010. [15] F. Martinez, L. C. Herrero, and S. de Pablo, “Project-based learning and rubrics in the teaching of power supplies and photovoltaic electricity,” IEEE Trans. Educ., vol. 54, no. 1, pp. 87–96, Feb. 2011. [16] A. J. Saavedra Montes, H. A. Botero Castro, and J. A. Hernandez Riveros, “How to motivate students to work in the laboratory: A new approach for an electrical machines laboratory,” IEEE Trans. Educ., vol. 53, no. 3, pp. 490–496, Aug. 2010. [17] S. Li and A. Khan, “Applying IT tools to a laboratory course for measurement, analysis, and design of electric and electronic circuits,” IEEE Trans. Educ., vol. 48, no. 3, pp. 520–530, Aug. 2005. [18] C. Ferrater-Simon, L. Molas-Balada, O. Gomis-Bellmunt, N. LorenzoMartinez, O. Bayo-Puxan, and R. Villafafila-Robles, “A remote laboratory platform for electrical drive control using programmable logic controllers,” IEEE Trans. Educ., vol. 52, no. 3, pp. 425–435, Aug. 2009. [19] S. A. Shirsavar, B. A. Potter, and I. M. L. Ridge, “Three-phase machines and drives—Equipment for a laboratory-based course,” IEEE Trans. Educ., vol. 49, no. 3, pp. 383–388, Aug. 2006. [20] A. Bentounsi, H. Djeghloud, H. Benalla, T. Birem, and H. Amiar, “Computer-aided teaching using MATLAB/Simulink for enhancing an IM course with laboratory tests,” IEEE Trans. Educ., vol. 54, no. 3, Aug. 2011, to be published. [21] M. D. Koretsky, D. Amatore, C. Barnes, and S. Kimura, “Enhancement of student learning in experimental design using a virtual laboratory,” IEEE Trans. Educ., vol. 51, no. 1, pp. 76–85, Feb. 2008. [22] M. H. Knudsen, “Experimental modeling of dynamic systems: An educational approach,” IEEE Trans. Educ., vol. 49, no. 1, pp. 29–38, Feb. 2006.
134
IEEE TRANSACTIONS ON EDUCATION, VOL. 55, NO. 1, FEBRUARY 2012
[23] G. C. Goodwin, A. M. Medioli, W. Sher, L. Vlacic, S. Member, and J. S. Welsh, “Emulation-based virtual laboratories: A low-cost alternative to physical experiments in control engineering education,” IEEE Trans. Educ., vol. 54, no. 1, pp. 48–55, Feb. 2011. [24] E. Allen, N. LaWhite, Y. Yoon, J. Chapman, and M. Ilic, “Interactive object-oriented simulation of interconnected power systems using SIMULINK,” IEEE Trans. Educ., vol. 44, no. 1, pp. 87–94, Feb. 2001. [25] G. K. W. K. Chung, T. C. Harmon, and E. L. Baker, “The impact of a simulation-based learning design project on student learning,” IEEE Trans. Educ., vol. 44, no. 4, pp. 390–398, Nov. 2001. [26] J. Kocijan, J. O’Reilly, and W. E. Leithead, “An integrated undergraduate teaching laboratory approach to multivariable control,” IEEE Trans. Educ., vol. 40, no. 4, pp. 266–272, Nov. 1997. [27] S. Heier, Grid Integration of Wind Energy Conversion Systems. Chichester, U.K.: Wiley, 1998. [28] S. Miller, “Wind turbine model,” The MathWorks, Inc., Nov. 2009 [Online]. Available: www.mathworks.com/ matlabcentral/fileexchange/25752-wind-turbine-model [29] L. Xu and Y. Wang, “Dynamic modeling and control of DFIG-based wind turbines under unbalanced network conditions,” IEEE Trans. Power Electron., vol. 22, no. 1, pp. 314–323, Feb. 2007. [30] “DS1006 processor board with 2.6 GHz processor clock,” dSPACE GmbH, Paderborn, Germany, May 2005 [Online]. Available: www.dspace.de/ftp/patches/SfC/DS1006/ds1006_2. 6GHz_Update/DS1006_Update_26.pdf [31] I. Boldea and S. A. Nasar, The Induction Machine Handbook. Boca Raton, FL: CRC Press, 2002. [32] “LabVIEW. User Manual,” National Instruments, Austin, TX, Apr. 2003. [33] R. Felder and R. Brent, “Designing and teaching courses to satisfy the ABET Engineering Curricula,” J. Eng. Educ., vol. 91, no. 1, pp. 7–25, Jan. 2003. [34] J. Campbell, J. Bourne, P. Mosterman, and A. Brodersen, “The effectiveness of learning simulations for electronic laboratories,” J. Eng. Educ., vol. 91, pp. 81–87, Jan. 2002. [35] T. Wiesner and W. Lan, “Comparison of student learning in physical and simulated unit operations experiments,” J. Eng. Educ., vol. 93, pp. 195–204, Jul. 2004. [36] H. G. Schmidt, “Foundations of problem-based learning: Explanatory notes,” Med. Educ., vol. 27, p. 422, 1993.
David Santos-Martin was born in Madrid, Spain. He received the M.Sc. degree in electrical and electronic engineering from the Escuela Técnica Superior de Ingenieros Industriales, Universidad Politénica de Madrid (ETSII-UPM), Madrid, Spain, in 1997, the M.Sc. degree in control engineering from the École Supérieure d’Électricité (SUPÉLEC-Paris), Paris, France, in 2008, and the Ph.D. degree in electrical engineering from the University Carlos III of Madrid, Madrid, Spain, in 2008. Currently, he is an Associate Professor with the Department of Electrical Engineering, University Carlos III of Madrid. Prior to this, he was with Iberdrola, Madrid, Spain, from 2001 to 2007 and with Ecotecnia-Alsthom, Barcelona, Spain, from 2000 to 2001. His research interests are power electronics, application of power electronics to power systems, and advanced control techniques applied to renewable energy.
Jaime Alonso-Martínez was born in Madrid, Spain. He received the M.Sc. degree in industrial engineering from the Polythechnic University of Madrid, Madrid, Spain, in 2001, and the Ph.D. degree in electrical engineering from the University Carlos III of Madrid, Madrid, Spain, in 2010. Since 2005, he has been an Assistant Professor with the Department of Electrical Engineering, University Carlos III of Madrid. His research interests include power electronics applied to renewable energies, mainly focused on photovoltaic applications.
Joaquin Eloy-Garcia Carrasco was born in Malaga, Spain. He received the M.Sc. degree in automation and electronics engineering from the University of Malaga, Malaga, Spain, in 2002, and the Ph.D. degree in electrical engineering from the University Carlos III of Madrid, Madrid, Spain, in 2007. Since 2005, he has been an Assistant Professor with the Department of Electrical Engineering, University Carlos III of Madrid. His research interests include control of electric drives and power electronics applied to renewable energies, mainly focused on wind and photovoltaic applications.
Santiago Arnaltes (M’02) received the Ph.D. degree in electrical engineering from the Polytechnic University of Madrid, Madrid, Spain, in 1993. Since 1997, he has been an Associate Professor with the Department of Electrical Engineering, University Carlos III of Madrid. His main research interests are grid integration of wind energy and control of electrical drives and FACTS, mainly for wind energy applications.