A Data Management Approach for Enhancing Business Process Intelligence. Josef Schiefer .... process analysts, business users, and software agents to continuously monitor and .... Data model. Many organizations use BPMS and WFMS for.
Process Information Factory: A Data Management Approach for Enhancing Business Process Intelligence Josef Schiefer, Jun-jang Jeng, Shubir Kapoor, Pawan Chowdhary IBM Watson Research Center 19 Skyline Drive Hawthorne, NY, 10606 Email: {josef.schiefer,jjjeng,shubirk,chowdhar}@us.ibm.com Abstract With access to critical performance indicators of business processes, executives, business managers and staff members can play a crucial role in improving the speed and effectiveness of an organization's business operations. The monitoring and analysis of business processes are complicated by the variety of organizational units and information systems involved in the execution of these processes. In this paper, we present a Process Information Factory as a solution for managing performance data of business processes. The purpose of the Process Information Factory is to provide a data foundation for a process-driven decision support system to monitor and improve business processes continuously.
1. Introduction As businesses are being forced to become much more operationally efficient and responsive to customers, the continuous supervision of business process performance is of increasing importance to business users and managers, process designers, and system architects. The access to critical performance indicators of business processes with minimal latency is nowadays a prerequisite for improving the speed and effectiveness of an organization's business operations. For the execution and monitoring of business processes, many organizations are increasingly using Business Process Management Systems (BPMSs) and Workflow Management Systems (WFMSs) to improve the efficiency of their processes and reduce costs. During the execution of the business process, WFMSs record many types of events, such as the start and completion time of each activity, the assigned resources, and the outcome of the execution. Major BPMSs and WFMSs provide comprehensive support for the early stages of the business process lifecycle but often lack capabilities for providing feedback and transparency about the performance of business processes. Although WFMSs often log detailed information during the process execution, they have difficulties in accumulating and
condensing audit trails of business processes and using this information for monitoring and analysis purposes. A variety of architectural frameworks – such as Active Data Warehousing [1], the Corporate Information Factory [4], and Zero-Latency Enterprises [2] – have emerged recognizing the importance of tactical decision support as an extension of traditional data warehouse capabilities. While the investments in data warehouse technologies have resulted in considerable information processing efficiencies for the organizations, these systems have been built completely separate from operational systems and focus on applications for strategic planning and decison-making. As these applications have matured over time, it has become apparent that the information and analysis methods they provide are also vital for tactical day-to-day decision making processes, and many organizations can no longer operate their businesses effectively without them. Consequently, there is a trend towards integrating decision processing into business processes in an organization. The monitoring of business activities requires focused, yet incremental Enterprise Application Integration (EAI) efforts and balancing information requirements in real-time with historical perspectives. The remainder of this paper is structured as follows: Section 2 reviews related work and positions the proposed infrastructure among existing approaches for monitoring and analyzing business processes. Section 3 introduces the Process Information Factory (PIF) architecture for managing process performance data. Sections 4 - 7 describe the internal structure of the PIF components in detail. In section 8, we present an example that illustrates the PIF in context of a transportation management scenario. Finally, in section 9 we present our conclusion.
2. Related work Although monitoring and analysis are considered important tasks of the workflow management system and business process management (e.g. [5]), and the Workflow Management Coalition has already drafted a standard for process definitions and workflow logs [11], little work has been done in developing a solution for
integrating and analyzing the workflow audit trail information. Some approaches emphasize the need for integrating audit trail into data warehouse systems (e.g. the process data warehouse in [9]), others are limited to a smaller set of workflow history that is managed within a workflow management system. Sayal et al. present in [9] a set of integrated tools that support business and IT users in managing process execution quality. These tools are able to understand and process the workflow audit trail from the HP Process Manager (HPPM), and can load via a loader component into the process data warehouse. Sayal et al. provide a high-level architecture and a data model for the process data warehouse, but they do not address the problem of integrating and analyzing the workflow audit trail in near real-time. An approach for history management of audit trail data from a distributed workflow system is also discussed in [8]. Koksal et. al describe the structure of the history objects determined according to the nature of the data and the processing needs, and the possible query processing strategies on these objects. These strategies show how to write queries for retrieving audit trail information. Unlike our approach, neither the transformation and aggregation of audit trail data, nor the analytical processing of this data are considered. Geppert and Tombros introduce in [3] an approach for the logging and post-mortem analysis of workflow executions that uses active database technology. The post-mortem analysis is accomplished through querying the event history which is stored in an active database system which supports Event-Condition-Action (ECA) rules. Various types of events (e.g., database transitions, time events, and external signals) can trigger in the event history the evaluation of a condition and if the condition evaluates to true, the action is executed.
3. Architecture for managing process data The PIF enables process-driven decision support for process analysts, business users, and software agents to continuously monitor and improve the business process. It is a data repository with comprehensive information on business processes, at different aggregation levels (process abstraction levels), from different and multidimensional points of view, using a huge historic data basis prepared for analyzing purposes to effectively support the management of business processes. The PIF includes detailed information about the execution paths and bottlenecks of business processes and thereby, it enables a fast detection of weak spots in the process and organizational structures.
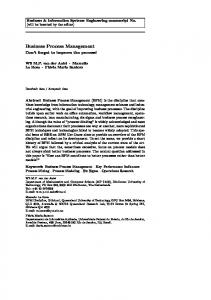
Workflow Data
Business Data Integrated data foundation for a process-oriented monitoring and analysis
Figure 1. Merging business data with workflow data The PIF adds a process perspective to an analytical environment. By infusing process-related data into existing business data, the PIF enriches existing business data in data warehouse systems with process context or process metrics (see Figure 1). We can distinguish the following cases: Adding additional process-context to existing data warehouse facts. Many existing fact tables of data warehouse systems capture facts about real-world events. Examples are POS (Point-Of-Sale) or banking transactions. However, these events occur in a certain stage of running business processes and traditional data warehouse solutions often fail to capture the processcontext. For instance, in a telesales process we might be interested in breaking down existing facts (e.g. costs) by process activities such as “Customer Requirements Capture”, “Price Negotiation”, “Shipping Options and Availability Review” etc. Part of the process-context is also information about the resources consumed during the execution of the process. For the telesales process example, we might be interested in breaking down existing facts by telesales representative. Adding new process metrics to existing data warehouse tables. Process-context for existing facts can improve the visibility of business process situations or irregularities. Also, new process metrics that are computed for workflow audit trails can be very valuable business indicators for analysts. Typical examples for process metrics are process cycle times, waiting times, deviations from process targets, rework and approvals, or various types for processing costs. An interesting process metric for the above mentioned telesales process might be a drop out rate for sales activities which indicates the percentage of unsuccessful sales that stopped at a certain stage of the business process (e.g. most sales might be dropped out at the “Price Negotiation” stage). New process metrics can be added to existing data warehouse solutions by inserting new columns to existing fact tables or by creating new fact tables for the process metrics that reference existing dimension tables.
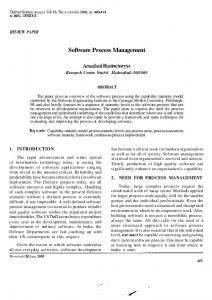
Figure 2. Process information factory - architecture Please note that the combination of business context and metrics available in a traditional data warehouse system with process context and process metrics available in the PIF will provide the analysts a more complete picture of business situations. Since PIF data originate from operational systems for the enactment of business processes, it also facilitates the integration of the decision making processes into the business processes. The PIF consists of four main components (see Figure 2): 1) the process warehouse (PWH) which is part of the enterprise data warehouse system and which is used for storing a rich set of historical process data for the strategic decision support, 2) the process data store (PDS) which includes very detailed up-to-date process data of current running processes and also allows real-time access for the tactical and operational decision support, 3) the Event Processing Container (EPC) which transforms and loads workflow events in near real-time into the PDS or PWH, and 4) the PIF Builder which prepares and manages the schema for the PWH and PDS and accordingly, also configures the EPC. In the following sections, we will discuss the PIF components in detail. The PWH and PDS are conceptually equivalent to traditional data warehouses and operational data stores (ODSs) with the major difference being that they are used to store process and workflow data.
4. Process warehouse The PWH component provides the data foundation for all strategic process-oriented DSS processing. In many
cases, the data warehouse is the first place where integration of business data is achieved and much historical processing is done. The PWH is a part of a data warehouse and its architectural structure is equivalent to traditional data warehouses. For that reason, it supports data that is 1) subject-oriented, 2) integrated, 3) timevariant, 4) non-volatile and 5) comprised of both summary and detailed data. Since the PWH exists to support process-related management decisions which in turn support the strategic planning processes of an organization, it also adds a process perspective to the data warehouse environments. Data flows into the PWH from the PDS and the ETL layer. The subject orientation of the PWH implies that it is organized along the lines of the major entities of a process. These entities define the context for the business process analysis. The business process context defines various perspectives of the business process and can be divided into 5 major categories: 1) process definition context (e.g. process model, process attributes, process targets), 2) resource context (e.g. organizational context, demographic information about workflow participants, resource history), 3) business object context (e.g. business object attributes, measures, process inputs/outputs), 4) runtime environment context (e.g. information about source systems, workflow environment, applications), and 5) causal (= not casual) context (e.g. promotion, incentive programs, weather). Integration of PWH data refers to the physical unification and cohesiveness of the data as it is stored in the warehouse. Integration covers many aspects,
including key structures, encoding and decoding structures, definitions of data, data layouts, data relationships, naming conventions etc. Data integration in the PWH is not achieved by merely copying data from the WFMSs or from the operational environment. Instead, as raw data passes through the ETL layer, a fundamental alteration is done to the data to achieve an integrated foundation that resides in the PWH. Major challenges for integrating data from WFMSs into the PWH are the transformation of workflow audit trail data into valuable business metrics and the representation of the process model as a dimensional table. Another characteristic of the PWH is that of time variancy. Simply stated, any record in the PWH is accurate relative to some moment in time. One way time variancy is accomplished is through the creation of fact records. Each fact has one moment in time when the event occurred within the business process. Any implication about the fact recorded before or beyond the moment in time when the event occurred is misleading and may be inaccurate. Because the PWH is made up of a massive series of workflow events, it can contain data over a lengthy period of time. It is common for a PWH (and also for data warehouses) to hold detailed data (active or archival) that is up to 5 years old. Yet another characteristic of a PWH is that of nonvolatility. This refers to the fact that an update (in its purest sense – that of finding a record and making changes to the record) does not normally occur in a PWH. If an update occurs at all, it occurs on an exception basis. The same holds true for traditional DWH systems. The PWH contains both detailed and summary data. Detailed data reflects the atomic-level transactions of a business process. Two kinds of summary data are found in the PWH: the profile records and public summaries. Profile records are created by combining event data from WFMSs. The resulting record is an aggregate or profile record that contains summary data of the events representing the lowest level of granularity for the PWH. This form of summary event data – an event summary record – is very common for the PWH, for instance when activity data is aggregated and consolidated for process instance data. Public summary data reflect data that is calculated for the process and has a wide corporate outreach. An example of a public summary is the calculation made each week, month or quarter by process analysts stating the process performance status. Public summary data is often used as benchmark information that is used across the corporation by many departments and managers and is utilized for the development of a balanced set of metrics for measuring the business (e.g. process scorecard, balanced scorecard, Baldrige Award model, etc.). The main difference between the PWH and traditional data warehouses is the inclusion of information about the
business process model within the data warehouse environment in order to drive the DSS. Traditional DWHs lack in providing facts that measure the performance of certain parts of a business process, such as metrics about activities, sub processes or the entire process. For the computation of these facts often multiple workflow events have to be processed. The PWH captures a history of these facts including their context information.
Data model Many organizations use BPMS and WFMS for modeling business processes and defining the target KPIs (key performance indicators). During execution, these KPIs have to be continuously generated as soon as sufficient workflow events are available.
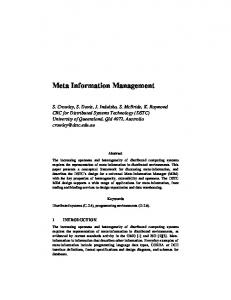
Figure 3. PWH - activity star schema Also deviations between the actual business performance and the target values are computed. Figure 3 shows an example of a detailed logical data model for a star schema [7] that supports the analysis of activity facts. The model includes various dimensions that form the context of activity instances. The dimensions are used to show the activity facts at various levels of granularity. Analysts can use these dimensions for drill-downs. Please note the activity-level data model has some common dimensions with the process-level data model. These common dimensions can be used for drill-cross operations. For instance, if an analyst is investigating the duration of a process instance (process-level), they can drill-across to all activity instances that belong to the process instance. The data model shown in Figure 3 is generic and is used to capture activity metrics about business processes. However, it is unable to provide facts that are specific for the certain business process type. For instance, an order
process will also comprise metrics that apply only to orders such as order volume, order costs, or on time delivery. Furthermore, there are also dimensions that only apply to order processes such as customer, fulfillment agent, order type, promotion program, and so forth. These additional metrics and dimensions are typically available in traditional data warehouse systems. The PIF tries to link this existing data by shared process dimensions. Figure 4 shows a fact table with facts of an order process. The fact table includes dimensions of the previously shown data model, and additional dimension tables that are available in the data warehouse and specific for order processes. Since the data model in Figure 3 uses a different set of dimensions, it also defines a different granularity level for the facts. The shared process dimensions are crucial in order to implement drill-across operations between both data models. The PIF manages the process-related fact and dimension tables and maintains their references to and from existing data warehouse tables. In section 7 we discuss the PIF Builder component which performs this task.
Figure 4. Order process - activity star schema
5. Process data store The main rationale of a PDS is to provide real-time information about business processes that can be used for monitoring purposes. It is conceptually equivalent to traditional operational data stores (ODSs) with the only difference being that it is used to store process and workflow data. It includes very detailed up-to-date workflow data on currently running processes and also allows real-time access for the tactical and operational decision support. A PDS is a collection of detailed data that satisfies the collective, integrated, and operational needs of the organization. Generally, these needs arise in the following situations: 1) as integrated operational monitoring and tactical decision support is needed for WFMSs and also
across multiple but related operational systems, 2) as strategic decisions are made using the PWH and action is required. A PDS is 1) subject-oriented, 2) integrated, 3) volatile, 4) current-valued, 5) detailed, 6) process oriented, and 7) adaptive to workflow changes. The PDS and the PWH are identical when it comes to being subject oriented, integrated and process oriented. There are no discernible differences between the two constructs with regard to those characteristics. However, when it comes to transaction support, level of integration with source systems, volatility, currency of information, history and detail, the PDS and the PWH differ significantly. In contrast to a PWH that is rich in history, a PDS generally does not maintain a rich history of process data, because it can be used within WFMSs and operational environments, and often has tight requirements for query response times. Consequently, a PDS is highly volatile in order to reflect the current status and information of business processes. Data in a PDS is subject to change every time one of its underlying details changes. An advantage of the PDS is that it is integrated and that is can support both decision support and operational transaction processing. A PDS often requires a physical organization which is optimal for updates and flexible processing of data (e.g. “close” to a WFMS) while the PWH is not interwoven with the WFMS or other operational systems and requires a physical organization which is optimal for strategic analyses of processes. Changes of the workflow or settings in the WFMS must not disrupt the interoperability with the PDS. The PDS must be able to adapt to such changes. Therefore, the schema and data propagation components for the PDS must stay in sync with the operational environment. This requires the PDS to be very adaptive to changes of the workflow models and settings in the WFMS. The PDS manages two types of data: 1) very detailed event data, which is stored as events stream from the WFMS and 2) detailed up-to-date process metrics at various granularity levels. The data model for capturing process metric looks very similar to the PWH with the only difference being that they capture values of current running process instances. Therefore, the records of the fact table are updated if there is a status change in the business process. Furthermore, the data models for the PDS include a process status dimension which allows easy filtering or sorting of the process or activity instances by their current state. When a process instance completes, all performance data about the process instance (e.g. process metrics, activity metrics) is moved to the PWH on a scheduled basis. Moving the data to the PWH avoids high data volumes in the PDS and thereby improves the response time to client applications.
6. Event processing container The EPC is able to accept real-time feeds of workflow events, which are pushed from the WFMS to the PIF. The integration of workflow events entails several challenges that are addressed by the EPC: Real-time data propagation. Delays in propagating workflow events from WFMSs to the PIF can significantly decrease the value of the event data for the users. In fact, the ultimate goal would be a zero-latency between the time the moment the workflow has been recorded and the moment it is required for monitoring and analytical purposes. When workflow audit trail information is available in near real-time in the PIF, it gives business users and process analysts accurate and detailed information about current business situations and allows them to identify weaknesses and bottlenecks in the process handling earlier. It further enables automated intelligent business operations that make use of the information from the PIF. Adding business process context. The calculation of process metrics often requires additional information from other data sources. For instance, in the case of an order process, the workflow events do not include detailed information about the orders and customers. Nevertheless, order and customer information might be needed for the calculation of workflow metrics about the order transactions. The EPC is able to merge the workflow audit trail with additional information from other data sources. Automated response mechanisms. The monitoring or analysis of workflow audit trails often entails a direct or indirect feedback into the WFMS or the operational systems. This response can be done manually or automatically and enhances the operational system with business intelligence. This is usually referred to as closed loop analysis. In the case where an automatic response is required, the EPC evaluates calculated metrics on-the-fly and triggers business operations based on the results of the evaluation. The availability of current workflow metrics makes notification applications much more appealing, as users can be alerted to near real-time conditions as they occur, not just e.g. on a nightly basis. This does not necessarily imply an operational decision, but it informs decision makers that something very important is happening which needs to be investigated in further detail. Notifications are appropriate where it is not possible to fully automate the decision processes because of their complexity or the need for human supervision and decision-making (e.g. semi-routine decision tasks). The EPC is a robust, scalable, and high-performance data staging environment, which provides services for the integration of a large number of workflow events. It takes responsibility for system-level services (such as threading, resource management, transactions,
persistence, and so on) which are important for the event processing. The core services are responsible for creating, initializing, executing and destroying the managed components that are responsible for the processing of event data. Figure 5 shows the internal event processing of the EPC. A detailed discussion of the EPC components can be found in [10].
Figure 5. Multithreaded event processing
7. Data schema and configuration management with the PIF Builder The PIF Builder prepares the schema for the PDS and PWH and also automatically generates and configures the components in the EPC. It is responsible for 1) defining/composing the data schema in the PDS and PWH, 2) generating/deploying the schema in the PDS and PWH, and 3) generating or updating the configuration of components for the data propagation (see Figure 6). The data schemas for the PDS and PWH can be mainly derived from the process or workflow definitions. The process or workflow definitions provide sufficient information that is required to generate the core structures for the database tables and fill some of the process dimension tables. The data schema and configuration management includes the following three stages: 1. Data Schema Definition / Composition. In this stage, a data modeler designs the tables for the PDS and PWH. The data schema is derived from the process or workflow definitions and can be extended with userdefined entities and attributes. The deliverable of this stage is the DDL (Data Definition Language) for the PDS and PWH which is used for the data schema generation and deployment. 2. Data Schema Generation / Deployment. A deployment expert uses the generated DDL and creates the tables in the target databases. After creating the tables, the deployment expert can further optimize and refine the table structures (e.g. creating indices). 3. Generating / Configuring Components for the Event Processing. After generating the schema for the PDS
and PWH, the PIF Builder component creates or configures the components in the EPC for the event data propagation. By generating new EPC components or configuring existing ones, the EPC will be able to propagate workflow events into the generated tables.
Figure 6. Schema and configuration management
8. Real-world example: Monitoring of a transportation management system In this section we report on our on-demand outsourced supply chain management system, which we call SaRTM (Sense-and-Respond for Transportation Management) [6]. The SaRTM system provides visibility as well as proactive monitoring and notification across the entire transportation life cycle – load planning, tendering, carrier load and dispatch, in-transit execution, postdelivery accounting and financial processing. Events received from planning and execution systems are intelligently broken down in near real time by the SaRTM system to retrieve key details, correlate and aggregate data into KPI’s and determine if any out-of-threshold situations have occurred or might occur in the near future. This data is stored in a PIF and users are alerted to situations in Dashboard portlets and have the ability to analyze the data in order to make important business decisions. Benefits of this initiative include: 1) improved visibility of end-to-end supply chain performance that leads to proactive problem identification and resolution, 2) notification of potential bottlenecks and interruptions to the supply chain such as a supplier’s inability to fill an order in a timely fashion, 3) reduction of inventory costs as a result of extended visibility of current shipment information, order fulfillment and carrier performance analysis, 4) elimination of disparate uses of information though standardization and alignment of performance measures and targets, and 5) continuous supply chain
performance improvement through scorecards, measurement accountability, and event notification of pending problem situations. The transportation management process is instrumented by modeling the business process and inserting probes at the right process steps. Each probe contains data attributes that are necessary to generate events that are published to a message queue and consumed by the SaRTM system. While monitoring events is important, the key to event monitoring is the ability to link the events to business entities. Business entities include, but are not limited to: Purchase Orders, Invoices, Bills of Lading (for all types of transportation), Sales Orders, Shipments, Equipment (for all types of transportation), Pallets, and Line Items (SKUs). The raw events that are received by the system include: Tender Rejected, Shipment Ready for Execution, Shipment Dispatched, Shipment Delivered, Manual Freight Bill Audited, and Freight Pay Complete. Each event contains information correlating the event to a particular context. For example, the Tender Rejected event contains details of a shipment that was tendered and the carrier who rejected the tender. The Freight Pay Complete event contains shipment details including actual costs, quantities, carrier etc. This event needs to be correlated with the Shipment Ready for Execution events in order to aggregate the information correctly.
SaRTM – Process Information Factory The purpose of the SaRTM PIF is to provide a data foundation for a process-driven decision support system to monitor and improve the transportation processes continuously and in near real-time. Sense-and-Respond systems assess business situations by monitoring KPIs. A data model for the PDS and PWH has been designed which captures the KPIs with context information about shipments. The data model has been divided into two parts: 1) an industry specific part which is modeled as a star schema and therefore includes fact tables and dimension tables, and 2) generic dimensional data for Sense and Respond that stores information about the process model, commitment profiles, situation, and user definitions. The table structures that capture this type of data is the same for all Sense-and-Respond solutions. We captured metrics for shipments such as average in transit time, expedite ratio, on time delivery, transportation cost variance, and average cost per mile. The context for these metrics includes process, time, shipment, carrier and reason, which are defined in the dimension tables. Role players receive personalized dashboards for viewing KPIs, situations, alerts and actions that are directly relevant to their line of business. These users receive alerts in ‘near real time’ if exceptions occur in
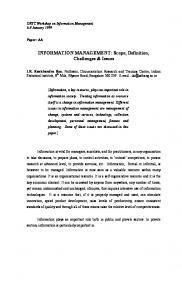
their business (see Figure 7). For example, if a carrier rejects a tender, the transportation planner is notified. If more than 10% of overall tenders are rejected across all carriers in the previous month, the transportation analyst/manager is notified to take corrective action to resolve the problem. As part of this corrective action, the analyst might need to drill down and determine which carrier(s) have the most tenders rejected. Trends can sometimes be determined from the historical data available. For example, there may be a pattern of tender rejection when the shipment destination is Minnesota during the last 2 months of the year.
visualization techniques, OLAP helps users perform root cause analysis and identify trends.
9. Conclusion Traditional data warehouse solutions focus on strategic decision support. A well-developed strategy is vital, but its ultimate value to an organization is only as good as its execution. As a result, deployment of data warehouse solutions for process-aware decision-making is becoming increasingly important. In this paper we have discussed the PIF for enhancing traditional data warehouse solutions with process information. A PIF has to be well integrated within a data warehouse environment and the operational environment for business processes and is a data foundation that supports these processes with near real-time business intelligence. We described all components that are required for the implementation of a PIF.
References
Figure 7. Dashboard alerts in SaRTM The dashboard also provides a snapshot of the business for visibility purposes. As part of this snapshot, it indicates the value of the KPIs across time windows. KPIs that have crossed their thresholds are indicated in a separate color. Figure 8 shows an example of dashboard visibility.
Figure 8. Dashboard visibility in SaRTM Drill-down information is provided by creating OLAP cubes from the PWH. Coupled with advanced
[1] Brobst, S. A., Ballinger, C., Active Data Warehousing, Whitepaper EB–1327, NCR, 2000. [2] Gartner Group, Introducing the Zero-Latency Enterprise, Research Note COM-04-3770, 1998. [3] Geppert, A. and Tombros, D., Logging and Post-Mortem Analysis of Workflow Executions based on Event Histories. Proc. 3rd Intl. Conf. on Rules in Database Systems (RIDS), LNCS 1312, Springer Verlag, Heidelberg, Germany, pages 67-82, 1997. [4] Inmon, W. H, Imhoff, C., Sousa, R., Corporate Information Factory, Second Edition, J.Wiley and Sons, New York, 2001. [5] Jablonski, S., Bussler, C., Workflow Management. Modeling Concepts, Architecture, and Implementation. Intl. Thomson Computer Press, London, 1996. [6] Kapoor, S., Gresh, D., Schiefer, J., Chowdhary, P., Buckley, S., “Visual Analysis for a Sense-and-Respond Enterprise”, IASTED International Conference on Software Engineering 2004, Innsbruck, Austria. [7] Kimball, R., Reeves, L., Ross, M., Thornthwaite, W. The Data Warehouse Lifecycle Toolkit, John Wiley & Sons, 1998. [8] Koksal, P., Alpinar, S. N., Dogac, A. Workflow History Management, ACM Sigmod Record 27(1): 67-75, 1998. [9] Sayal, M., Casati, F., Dayal, U., Shan M., Business Process Cockpit, VLDB 2002, Peking, 2002. [10] Schiefer, J., Jeng, J. J., and Bruckner, R. M. Real-Time Workflow Audit Data Integration into Data Warehouse Systems, in Proceedings of the Eleventh European Conference on Information Systems, Naples, September 2003. [11] Workflow Management Coalition Audit Data Specification, Document Number WFMC-TC-1015, 1998.