Recently, using the indirect processing route, 3D honeycomb porous .... the pore shape becomes more elliptical in the ... By varying the road width (length a in.
Processing, Characterization and Modeling of Non-Random Porous Ceramic Structures Ashwin Hattiangadi and Amit Bandyopadhyay School of Mechanical and Materials Engineering, Washington State University, Pulln1an, WA 99164 Abstract Processing of non-random porous ceramic structures via fused deposition process is discussed. structures are characterized experimentally and statistically based on their compressive strength. Finite element modeling is used to understand the effect of stress concentration leading to the strength degradation ofthese brittle elastic solids. Introduction Porous ceramic materials are of significant technological interest due to their applications in molten metal filters, light weight core for sandwich panels, radiant burners, catalyst supports, sensors and bone grafts [1-2]. The porosity may be needed in the structures to reduce the weight of the structure at the non-critical areas, to increase the activity of the ceramics by increasing surface area or to separate the wanted from the unwanted materials during filtering. But in all the cases, a better control of the pore geometry and improvements of the mechanical properties ofthe porous structures are important to improve the reliability ofthe structures. Various processing techniques have been utilized to fabricate porous ceramic materials. Replamineform process was utilized to fabricate porous bioceramic implants to duplicate the macroporous microstructures of corals that have interconnected pores [3]. Porous alumina ceramics have been fabricated using pore former or foaming agent that evolves gases during sintering at elevated temperatures [4]. Porous Hydroxyapatite (HAp) ceramic blocks were also fabricated using HAp slurry mixed with foaming agent followed by sintering at elevated temperature [5]. Shrout et al. and Rittenmyer et al. [6-7] reported fabrication of 3-3 piezocomposites using a mixture of volatilizable plastic spheres and PZT powder, in a process known as BURPS (BURned-out Plastic Spheres). Unfortunately, all of these processes form structures with randotnly arranged pores with a wide variety of sizes and have limited flexibility to control pore volumes and porosity distribution in the final structure. In this paper, we discuss about porous ceramics with non-random pore volumes, shapes and sizes, which have been processed using solid freeform fabrication (SFF) methods. SFF offers tremendous flexibility in varying the porosity parameters which controls the strength ofthese ceramic structures as well. Theoretical and experimental characterization of porous materials is not new and several theories have already been postulated to characterize the mechanical strength of polyct:ystalline porous ceramics. These theories to characterize the mechanical strength can be classified into three broad categories: (1) reduction in cross-section area approach, (2) stress concentration approach and (3) effective flaw size approach. Most of these studies in predicting the porositystrength relationship have been limited to the fitting capability of the equations towards the available experimental data and no attempt has been made to quantitatively access the effects of porosity parameters on the strength degradation ofthe porous ceramic structures.
319
The effects of porosity parameters such as size, shape, and pore •. interaction on the strengtbdegradation of porous ceramics. under. uniaxial. cOmpression loading are presented. Finite element method· (FEM) is. ·used to study the effects based on stress concentration. Statistic.alanalysis·oftheexperimetltalresults shows the main factors and the interaction among them that affect compressive strength.
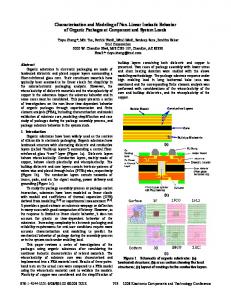
Processwe Solid freeform fabrication (SFF) is an approach to directly build three-dimensional components layer-by-layer from a computer data description or a CAD file of a component. SFF techniques can be used in two ways to fabricate functional metaJ/ceramic prototypes: (a) direct and (b) indirect. In the direct route, green metaJ/ceramic components are directly fabricated using SFF. Recently, researchers modified the Fused Deposition process [8] to manufacture direct ceramic parts via it. process known as FDC (Fused Deposition ofCeramics) [9, 10]. In the indirect route, the negative or the mold of the desired structure is fabricated via SFF. The positive is then cast using metaJ/ceramic powder based slurry via a lost mold technique. Recently, using the indirect processing route, 3D honeycomb porous ceramic preforms have been fabricated [11]. Commercially available Fused Deposition Modeling (model FDM 1650, Stratasys Inc., MN) process was used for making the molds. The indirect processing route is schematically shown in Fig. 1 and the schematics ofthe wax mold is shown in Fig. 2a and b.
Slurry Infiltration
CAD
Sinter.c:a Structure
Fig.l: .Schematic of the indirect processing ofceramic structures via rapid prototyping processes. Thermoplastic polymeric molds were built usingFDM 1650 machine. The raster gap (X and Y gap), road width (length a} and slice thickness(Z gap) were varied with respect to each other, to obtain desired pore size, pore shape and volume fraction porosity.
320
Fig.3: Microstructures 3D honeycomb porous ceramic structures. (a) Schematic; (b) Side view structure with uniform porosity 6.0l5
r""""'"'
-......
0.03
0.005
100
Pore dianUer (pm) ~~~l ....' .
Hg-porosimetry plots show the porosity honeycomb porous mullite
ceramics
321
......
Fig. 3a shows the schematic of the porous structures and Fig. 3b is photomicrograph of the side view of porous 3D honeycomb ceramic preforms. In both the cases, it can be observed that pores are uniformly distributed and interconnected in all three directions. Fig. 4a shows the mercury porosimeter (model Autopore III, Micromeritrics, GA) plot of incremental intrusion of mercury in the porous structures. It can be seen from this plot that the maximum volume of the mercury, that intrudes the porous ceramic, occupies the macropores in the vicinity of 150 to 300 J!m, which was actually the designed pore sizes for these structures. Fig. 4b shows the porous ceramic structures where the pore sizes and their distribution are varied. Experimental Testing: Experimental result for strength degradation of mullite ceramics subjected to compressive loads is discussed in this section. Some of the trends were observed that follow the exponential equation proposed first by Ryshekewitch [12]. The equation was expressed as 0' = 0'0 (exp.)"bP
where, 0', is the stress ofthe porous structure in compression. 0'0, is the stress of non-porous structure. b, empirical constant. Ryshekewitch (1953) determined the value of "b" from the slope ofthe curve as 6 to 9, for different loading conditions. and P, is the volume fraction porosity for zirconia and alumina. Cylindrical samples of I-inch length and 0.6-inch diameter were fabricated having a nonrandom porous structure with predetermined pore size and pore volume. Uniaxial compressive tests were done on a servo-hydraulic load frame (MTS 4 post (44KN) under displacement control at a stroke rate of 1.27 mm/min 55 . . . - - - - - - - - - - - - - - - - - ,
-
.Cune 1 ACune2
50
60 . . . - - - - - - - - - - - - - - - - ,
CCf
~
-
45
= 252.7 exp-(5.28) P
«I)
«1)40
f
';) G>
>
35
'iii
«1)30
f
Q.
S25 Cf 1
(.)
20
= 274.6 exp -(5.61) P
I-_....-......._.J.-.__--.__.J.------I
0.30
0.35
0.40
0.45
•
31 % Vol. Frac. Porosity
•
40% Vol. Frac. Porosity
O L - - - - - -.......- - - - -.........- -... 15 13 11 9 7 5
Slice ThickneS$/lnteraetionDistance between pores x 0.001 inch
Volume fraction Porosity
Fig. 6: Variation of Slice ThickneSS
. Fig. 5: Variation ofRaster Gap
322
By varying the raster gap (.X and Y-gap in Fig. 2b) between the filaments in the wax mold, the interaction between pores in the horizontal plane of the ceramic structure was varied. This variation for different volume fraction porosities shows a failure trend in Fig. 5 for which the exponential equation is a good fit. The Curve 1 and 2 in Fig. 5 show the failure trend for two different pore heights which is achieved by varying the slice thickness (Z- gap in Fig.2b). The strength is slightly lesser when a smaller slice thickriess is used,shown as curve 1 compared to curve 2, where a higher values of slice thickriess was used. The 0'0 based on the above Ryshekewitch equation for curve 1 and 2 are 274.6 MFa and 252.7 MFa, respectively. The variation of the slice thickriess or pore shape in the vertical direction is shown in detail in Fig. 6 for 31% and 40% volume fraction porosities. It can be observed from Fig. 6 that as the 55.0 r----.,.....~====~=~ vertical interaction between the pores increase • Pore Height 0.01 inch the strength decreases. It also suggests that as l50.0 III Pore Height 0.014 inch the pore shape becomes more elliptical in the :E ';' 45.0 vertical direction, the compressive strength decreases. 40.0
!
=
.~ 35.0
~ 30.0
E
8
25.0 20.0
1..-_-......- -.........- - - ' - - - - . . . . 1 15
20
25
30
35
Pore Width ( Road Width x 0.001 inch)
By varying the road width (length a in Fig. 2b) in the wax mold, the pore shape can also be changed along the horizontal direction as shown in Fig. 7 for two slice thickriess of .01 and .014 inch. The strength of the ceramic decreases as the pore width increases. In other words as the shape of the pore becomes more elliptical the strength decreases.
Fig. 7 : Variation of Road Width Statistical ana Analysis of Variance for the Compressive Source of variation (
Road Width (RVY) Raster Gap (RG) Road Width-5lice Th. (RW-ST) Slice Thickness (ST) Raster Gap - Slice Th. (RG -5T) RG-RW-ST RasterGa Sum
Sum Std. Stan Estimates
au
A :- Sum of B :C :- Mean F-Value = P-Value C I Error Squares of the Degrees of Square Compressive Freedom AI B data (Sq. MPa)
=
894.26 1 370.52 1 30.60 1 16.17 1 6.51 1 0.26 1 0.03 1 259.4 8 1577.7 15 1.16 (plus I minus) 4.65
894.26 370.52 30.60 16.17 6.51 0.26 0.03 32.4
27.585 11.429 0.944 0.499 0.201 0.008 0.001
Table 1: Two level-three factorial experimental analysis of variance
323
A two~level three factorial design of experiment w~carried out on the basis of analysis ofvariance (ANQVA). The Table 1 shows statisticaLanalYsis for the three main factors, raster gap(RG), road width (RW)an(lslicehfuj.cimess(ST). The road width(RW)and raster gap (RG) are.the most important controllingparatnetersoftbe stren.gthof.pqrous>stnletures. Their Fvalues are very high indicating that· these· f~ctors havelllost significant effect. Theprobability that these factors will not control the strength{P-value) is also very low. Finite .ElementModeling Finite elementmodeling(~EM)ofporous cer~ics for increasing porosity and varying pore shapes was studied with respect to their effects on strength d.egradation of tbe structures under compressive loading. The FEM was carried out on ANSYS (ver.5.4). Representative cr()ss-sectional. scbem~tics of typicalpqrousceramic structures with uniform pore shapes and sizes are shown intwo dimensions in F'ig.i 8a. BoundarYcondjtions,plan~stressmethod>andmaterial properties: In Fig. 8a, the nodes along the bottom edge are fixed in the Y~direction but are allowed to move in the X-direction. A
node at one of the bottom corners is fixed in the X-direction to prevent rigid body motion. A load is applied to the mesh in the Y..,direction "oy" such that it is compressive in nature. In controlledporqsity ceramic structures,137.8GPa (2 x 10⁷ psi) and 0.1, respectively. The porous structure is represented by Fig. 8a and b in two,..dimensions and the porosity is evaluated as area fraction. Results and discussion ofthe·FEM: Allthe finite element analysis(FEA) results are shown asa variation ofstress·concentration factors (SCF) with respect to different porosity parameters. SCF is calculated as 0"6/0' along the perltneterofthe pore, where the anglee defines the location, 0" is the applied stress and 0"6 is the stress at that specific location. The angle e is zero for all the cases at the perimeter which intersects the y-axis (e = 0) and increases along the clockwise direction as shown in Fig. 8a.
h h
x w
(a) (b) Fig. 8: (a) Finite plate with one pore (b) Plate with elliptical pore.
Effect of increasing porosity: The variation of tensile and compressive component of the SCF with volume fraction porosity is shown in Fig. 9a. This is a very ideal case and it may be difficult to manufacture porous structures withpetfectly circular pores. The exponential increase ofthe tensile component does indicate that the strengthis affected by the increasing porosity. The experimental plotof Fig. 5 obtained by varying the raster gap shows similar effect as the increase in porosity modeled using finite elements. In the experimental study we observed an exponential decrease in strength as the volume fraction porosity.or the raster gap increased. In the FEM study, we observe an exponential increase in SCF as the volume fraction porosity increases.
Effect of pore. shapes: The above structure was considered for circular/spherical pores. But in reality, all pores are seldom spherical. Fi~.8c shows a sc~ematic diagram where the pore has an elliptical shape. The ellipticity of pores will vary as the ratio of the major and the minor··axis (a and b respectively) changes. Fig. 9b shows the effect of pore shapes on SCF. With the increase in ellipticity of the pores, more severe stress concentration effects are observed. The cross sectional solid area decreases in one direction compared to the other andit has been shown that minimum solid area mone of the critical parameters that predicts the strength of the porous structures [14]. The effect of change in pore shape through this FEM study matches well with the experimental results shown by Figs. 6. and 7. Varying the slice thickness and road width has experimentally sl10wn that by decreasing the pore ellipticity controlled porous structures with higher compressive strengths can be designed and this may be caused due to a decrease in stress concentration effects. 6.00 5.50
r------------.. . . - -_ SCFcon1p = 2.08 exp
5.00 4.50 4.00
10.0
1.89 P
SCFcomp
9.0
11II a:
8.0
.. a: b ratio 1.25:1
=2.82 e\p
(2.59)P
b ratio 2:1
7.0
3.50
u.. en 3.00
"
SCFten
2.50
=0.18 exp 6.65 P
2.00 1.50 1.00
6.0
fJ)
5.0
0
SCFTen = 0.48 exp
4.0
10-_ _........
0.25
0.3
.. Tensile Compo........ of Stress 0.35
0.4
0.45
(4.56) P
3.0
.a. Compress. Compo of Stress
0.50
0.00
I.L
2.0
---1
1.0 0.25
0.5
Volume fraction porosity
0.3
0.35
0.4
0.45
Volume fraction porosity
Fig.. 9: (a) Effect of increasing porosity on the SCF fOf.constant number of pores. of SCF with increasing porosity for constant pore shapes
325
(b) Variation
0.5
Conclusions Non-random porous ceramic structure can be processed indirectly from SFF process. Experimental results and statistical analysis show that the main parameters that affect the compressive strength of non-random porous ceramics are pore shape and distance between the pores in the horizontal plane. Since SFF process can control these parameters by changing the raster gap and road width, stronger porous structures can be produced via design optimization. Stress concentration effects by finite element modeling show similar behaviour as the failure strength trends obtained experimentally. Acknowledcments The authors ",ould like. tOiaCknowl~dge theflmtncial support from .the Otllceof Naval ResearcP:J.lIlder grant numberN-00014-98-1·.o5S.o.• The. authors would alsO like to acknowledge the experimental help ofRaj Atisivan, Susmita Boseatld Sudarshan Rangaraj. References 1. D.Hardy andD. lGreen, J. Eur. Ceram. Soc., 15 (1995)769. 2. R M.. deSouza, a.N. Yoshimura, C. Xavi¢rand H.Goldenstein, Key Engineering Materials Vols.l27-131 (1997) 439. 3. E. W. White, J. N. Webber, n.M. Roy, E. L. Owen, R. T. Chiroff and R. A White, J. Biomed..Mater. R.~s.· Symp., 6, (1975) 23-7. 4. S. F. Hulbert, S. 1 Morrison andJ. J.Klawitter,J. Biomed Mater. Res. Symp., 6, (1975) 34774. 5. C. P. A. T. Klein, alld P.. Patka, Handbook of Bioactive Ceramics II: Calcium Phosphate and Hydroxylapatite Ceramics,.edited by T. Yamamura, L. L. Hench and J. Wilson, CRC Press, Boca Raton, FL, (1990) 53-60. 6. T. Shrout, T., W. A Schulze, andJ. V. Biggers, Mat. Res. Bull. 14,(1979) 1553-1559. 7. K. Rittenmyer, T. RShrout, W. A Schulze, and R E. NewIlham, Ferroelectrics 41, (1982) 189-J95. 8. .._;..,"Rapid Prototyping Using FDM:AFast,precise,$afe Technology"; in Solid Freeform FabricationSymposiumProceedings,Edit~dbyH. L. Marcus, J. J. Beamen, J. W. Barlow, D L. Bouren, andR H. Crawford. University ofTexas at Austin, (1992) 1'1'.301-308. 9. A Bandyopadhyay, R K. Panda, V. F. Janas, M. K. Agarwala, S. C. Danforth and ~ SafarL "Processing ofPiezoelectric Ceramics by Fused D~osition Technique," J. Am. Ceram. Soc., 80 1366-·72 (1997). 10. M. K. Agarwala,A. Bandyopadhyay, RvanWeeren, P. Whalen, Ahmad Safari and Stephen C. Danforth, "Fused peposition of Ceramics: Rapid Fabrication of Structural Ceramic Components," Ceram. Bull., 1160--65 (1996). 11. S.. Bose, S·· SnguiraandA Bandyopadhyay, " Processing of Controlled Porosity Ceramic Structures via Fused Deposition," Scripta Materialia, Accepted forPllblication. 12. RRyshkewitch, "Compression Strength of Porous Sintered Alumina and Zirconia," J. Am. Ceram... So.c., 36[2].6$·-68 (1953). B.A. R Boccaccini, G.OndracekandE.Mombello, "Determination of Stress Concentration Factors inPorous.Materials," J.lvfater.. Sci. Letters, 14534-.536(1995). 14. RW. Rice, "Comparison of Physical Property·Porosity Behavior with Minimum Solid Area Models," J. Mater. Sci., 311509·-1528(1996).