International Journal on Advances in Software, vol 8 no 1 & 2, year 2015, http://www.iariajournals.org/software/
103
Productivity-Based Software Estimation Models and Process Improvement: an Empirical Study Alain Abran, Jean-Marc Desharnais
Mohammad Zarour
Onur Demirörs
Department of Software Engineering & IT École de technologie supérieure, University of Québec, Montreal, Canada
[email protected],
[email protected]
College of Computer and Information Sciences Prince Sultan University, Riyadh, Saudi Arabia
[email protected]
Middle East Technical University, Ankara, Turkey
[email protected]
Abstract—This paper proposes an approach to software estimation based on productivity models with fixed/variable costs and economies/diseconomies of scale. The paper looks first at productivity alone as a single variable model, and then discusses multi-variable models for estimation in specific contexts. An empirical study in a Canadian organization that illustrates the contribution of these concepts from economics in developing tailor-made estimation models based on the performance of the organization studied is presented, as well as the use of the SWEBOK Guide for the identification of process improvements areas. Keywords-Software economics; productivity models; fixed variable cost; estimation models; Function Point.
I.
INTRODUCTION
Over the past 40 years researchers have approached software effort estimation using different mixes of cost drivers as well as various techniques that combine costs drivers with either expert opinion or mathematical models. The main goal is to produce ‘accurate estimates’, either intuitively based on expert opinion, or through mathematical models. In contrast to traditional approaches and strategies in software engineering that focus strictly on estimation, this paper examines an approach common in economics that looks first at productivity alone as a single variable model, before moving on to multi-variable models for estimation in specific contexts. The paper expands on these concepts and reports on an empirical study that illustrates the contribution of these concepts from economics to develop tailor-made estimation models based on the performance of the organization studied. This paper reports in more detail on the empirical study presented briefly in [1], including data quality controls, functional size measurement and the identification of process improvement based on the SWEBOK Guide [2]. Some of the concepts introduced in this paper have been explored initially in [3] that identified a new approach to software benchmarking and estimation. The mathematical estimation models from the literature are broadly derived from two distinct strategies
that take into account information from completed projects: Strategy 1: Statistical analyses represented by multivariable models with as many independent variables as the cost drivers taken into account. Some examples are linear and nonlinear regressions techniques, neural network models, and genetic algorithms [4, 5]. For an adequate statistical analysis, it is generally accepted that there should be 20 to 30 observations for each independent quantitative variable. Strategy 2: Statistical analyses with a unique independent variable (typically size) combined with a single adjustment that combines the impact of multiple cost drivers, individual values of which come from fixed pre-determined step-functions for each cost driver. This can be observed, for instance, in COCOMO-like models [6, 7]. Multi variables models built with insufficient data points (as in strategy 1) or with models with an adjustment factor bundling multiple categorical variables (strategy 2) do not necessarily reduce the risks inherent in estimation. They may lead managers to believe that the majority of important cost drivers have been duly taken into account by the models whereas, in practice, even more uncertainty may have been created [8, 9]. Numerous other mathematical techniques exist in software engineering, such as analogy-based reasoning and machine learning estimation models, which differ from the above in their mathematical peculiarities, but which similarly use a multi-variable approach [10, 11]. Although accurate estimation of a single project is important, estimation is not the unique management concern, nor the most important one for a specific project or for a set of projects for an organization or a customer. For example, greater productivity, profitability, and high quality have often greater management relevance than accuracy of estimation. Many current estimation models are built without reference to productivity issues, frequently taking into account a large number of variables (at times over too small data sets) in an attempt to predict the better fit of data points, and then evaluating these models by how
2015, © Copyright by authors, Published under agreement with IARIA - www.iaria.org
International Journal on Advances in Software, vol 8 no 1 & 2, year 2015, http://www.iariajournals.org/software/
104 close the models ‘estimates’ are to ‘actual data’. However, when actual (internal or external) data come from highly unproductive projects (and uncompetitive ones) plagued with numerous quality issues, that an estimation model estimate ‘accurately’ is of limited value to customers. Similarly, how relevant are estimation models built from external data when a software organization cannot compare its own productivity with the productivity of the organizations the data is coming from? If its own productivity is lower, an external-based estimation technique will under estimate: without insights into its own productivity, use of external-based estimation tools is an inadequate approach. The rest of the paper is organized as follows. Section II presents the productivity concept as defined in economics to represent the performance of a production process, including fixed/variable costs and economies/diseconomies of scale. This section also illustrates how to recognize these concepts in software engineering data sets. Section III presents how these concepts are used in a Canadian organization to address management requests for information on the productivity of their development process. Section IV presents the productivity analysis and the estimation models developed for the organization on the basis of economic concepts. Section V presents the usage of the SWEBOK Guide to identify process improvement opportunities for the organization. Section VI presents a summary and implications for estimation effort. II.
PRODUCTIVITY MODELS AND ECONOMICS CONCEPTS
A. A productivity model represents a ‘production’ process A project is typically set up to plan and manage a unique event, with a start date, an end date, and a unique outcome that typically has not been produced before. Building a house is a project, building a road is a project, as is developing a software application A for customer B for a specific deadline. To improve the odds of meeting the project targets a project process is implemented to plan activities, monitor project progress and take remedial action when something goes off track. Similarly, even though each piece of software is different, its delivery is organized in a structured manner and not left to randomness and individual moods and intuitions of the day. To deliver the right outcome on time and within the expected cost and level of quality, a ‘development process’ is implemented to meet the target taking into account the set of priorities within a reasonable range of predictability. A project, including software projects, is a process and each process corresponds to a level of performance aligned with its own specificities in terms of activities,
structure of activities, constraints and resources involved in the process. The question is: How can the performance of a process be estimated in the future if its current and past performance and any variations in performance are not known? What are the economic concepts at work in software projects? And, when this is understood and quantified, how can these economics insights be used for estimation purposes? A software development project can be modeled as a production process, in its simplest form using three main components: 1) Inputs: to calculate productivity, the people involved in the production process are considered as the inputs from an economics perspective. In a software project, the inputs are typically measured in work-hours (or person-days/-weeks/-months). 2) Activities within the process itself: for calculating productivity, all of the activities and constraints of the process are considered as a black-box and are not taken into account: they are, therefore, implicit variables, not explicit variables in productivity calculations. 3) Outputs: the outputs are represented by the number of functional units produced by the process. The output of the software development process is the set of functions delivered to the users, which functions can now be quantified with international standards of measurements, such as with any of the relevant ISO standards on software functional size [12-15]. The productivity of a process is its ratio of outputs over the inputs used to produce such output. In software, the productivity of a software project can be represented, for example, as 10 Function Points per work-month. It is to be observed as well that, by convention, the productivity ratio ignores all process characteristics: it is process and technology independent and, therefore, allows objective comparison of the productivity of a process across technologies, organizations and time. Productivity describes this single concept, and does not explain why the productivity has varied and may vary over time within the same process, or across distinct processes. To explain productivity variability (within and across processes) additional variables are necessary. Multi-variable models are useful to investigate which variable impacts productivity (in a positive or negative manner), and to what extent. The investigation of why the productivity of a process varies is the realm of efficiency studies, not productivity studies. B. Productivity models with fixed and variable costs The use of productivity models has a long history that can be traced back to a large body of knowledge developed in the domains of economics and engineering. This section introduces some of these concepts, which may also be useful in modeling, analyzing and estimating the performance of software projects.
2015, © Copyright by authors, Published under agreement with IARIA - www.iaria.org
International Journal on Advances in Software, vol 8 no 1 & 2, year 2015, http://www.iariajournals.org/software/
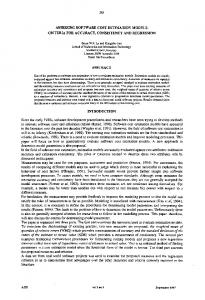
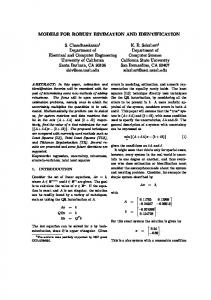
105 A productivity model is typically built with data from completed projects, that is, it uses the information of a project for which there is no more uncertainty: The outputs: i.e., all the software functions have been delivered; and, The hours worked on the project: i.e., they have been accurately entered into a time reporting system. This is illustrated in Fig. 1 where: The x axis represents the functional size of the software projects completed; The y axis represents the effort in number of hours that it took to deliver a software project. The straight line across Fig. 1 represents a statistical model of the productivity of the software projects. More specifically, this single independent variable linear regression model represents the relationship between effort and size, and is represented by the following formula: Y (effort in hours) = f(size) = a x Size + b where: Size = number of Function Points (FP) a = variable cost = number of hours per function point (hours/FP) b = constant representing fixed cost in hours In terms of units, this equation gives: Y (hours) = (hours/FP) x FP + hours = hours
Figure 1: Fixed & variable cost in a productivity model Insights from economics have identified two distinct types of costs incurred to produce different quantities of the same types of outputs: Fixed costs: the portion of the resources expended (i.e., inputs) that does not vary with an increase in the number of outputs. In Fig. 1, this corresponds to b, the constant in hours at the origin when size = 0. Example of a fixed cost: a cost of b hours of project effort is required for mandatory project management activities, whatever the size of the software to be developed. Variable costs: the portion of the resources expended (i.e., inputs) that depends directly on the number of outputs produced. In Fig. 1, this corresponds to the slope of the model, that is: slope = a in terms of hours/FP (i.e., the
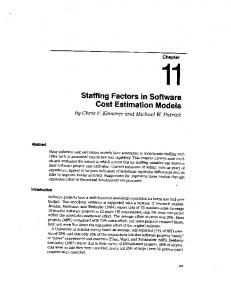
number of work hours required to produce an additional unit of output). It is to be observed that in productivity models, the constant b does not represent the errors in the estimates as in multi-variable estimation models. In productivity models, b has a practical interpretation corresponding to the economic concepts explained above, that is: the portion of the cost that does not vary with increases in the production outputs. C. Wedge-shaped datasets in software engineering Often, a graphical representation of projects in large datasets has the wedge-shaped distribution illustrated in Fig. 2 with the software size as the single independent variable. It can be observed in Fig. 2 that, as the project size increases on the x axis, there is a correspondingly larger dispersion of the data points across the vertical axi. In other words, there are increasingly wide variations in project effort on the y axis as the project size increases, that is, large productivity differences across software of similar size delivered. Such wedge-shaped datasets have initially been observed by [16, 17] and are representative of datasets collected from multiple organizations, each with their own distinct development processes using a variety of technologies and corresponding distinct abilities to exploit them. Looked at from a control process view point within a single organization, a wedge-shape data set could represent: A. A process ‘out of control,’ that is, a process with a large variation in productivity across increases in the size of the outputs is due to a lack of repeatability in a process, i.e., an ad-hoc process dependent on individual actions and expertise and unknown quality, rather than repeatable and ‘under control,’ as happens when a development methodology is enforced, leading to repeatability However, a process ‘under control’ may be highly repeatable, predictable and with high quality, but it may concurrently be highly inefficient and expensive; or, B. Data originating from various distinct processes, each with their distinct productivity ratios, thereby ‘only appearing as out of control’ because the singlevariable model does not take into account the presence of the distinct processes of each organization, each with their distinct productivity ratios; or C. A process where each project has large variations in unit-effort due to factors other than size, that is a multi-variable dependent process. Adequate modeling of such factors in multi-variable models is only feasible when there are enough data points (i.e., the sample size should increase by 20 to 30 projects for each additional variable introduced in the model). Models introducing multi-variables without sufficient data points will provide mathematical models with
2015, © Copyright by authors, Published under agreement with IARIA - www.iaria.org
International Journal on Advances in Software, vol 8 no 1 & 2, year 2015, http://www.iariajournals.org/software/
106 quantitative parameters, but will have no generalization power for future usage, including in similar contexts.
Figure 2: Example of a wedge-shaped productivity dataset It is obvious from Fig. 2 that a single-variable productivity model built from this data set is not directly useful for estimation purposes in this context. All other process and product variables combined together have a large impact on the total variation of the dependent variable (i.e., here, Effort). Therefore, for estimation purposes, multi-variable models would be necessary. However, such multi-variable models, while useful for estimation purposes, do not allow productivity comparisons and evaluation. The next question is: what causes these different behaviors? Of course, the answers cannot be found by graphical analysis alone, since in the productivity model there is only a single independent quantitative variable in a two-dimensional graph. This single independent variable does not provide, by itself, any information about the other variables, or about similar or distinct characteristics of the completed projects for which data are available. Efficiency investigation with additional independent variable can help identify which other variables cause variations in productivity and to what extent for each. When a data set is large enough (that is 20 to 30 data points for each independent variable), the impact of the other variables can be analyzed by statistical methods. In practice, most software organizations do not have data set large enough for valid multi-variable statistical analysis. However, within a single organization the projects included within a data set can be identified nominally by the organizations that collected the data [3, 16]. Each project in each subset should be subsequently analyzed to determine: Which of their characteristics (or cost drivers) have similar values within the same subset; and Which characteristics have very dissimilar values across the two (or three) subsets. Of course, some of these values can be descriptive variables with categories (i.e., on a ‘nominal’ scale type: for example, a specific Data Base Management System (DBMS) has been used for a subset of projects, etc.). It
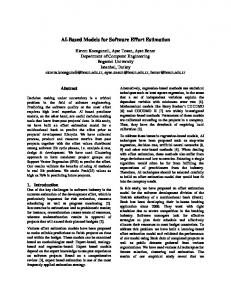
then becomes necessary to discover which additional independent variables have the most impact on the relationship with project effort. The different values of such characteristics can then be used to characterize such datasets, and set the parameters for selecting which of these productivity models to use later on for estimation purposes. D. Homogeneous datasets in software engineering Another type of project distribution is represented in Fig. 3, which illustrates a strong consistency in the dispersion of the effort as size increases. This would represent more homogeneous data sets in which the increase in software size explains well the increase in effort. Such a homogeneous distribution of software projects data appears as well in the literature [18-21]. In these datasets, the increase in functional size explains 80% to 90% of the increase in effort, while all of the other factors together explain at most 10% to 20% of the increase in effort. Such datasets would be considered homogeneous with respect to the dependent and independent variables being investigated. This low dispersion in project productivity would typically have one or a mix of the following causes: The project data comes from a single organization with well implemented development standards. The project data is representing the development of software products with very similar characteristics in terms of software domains, non-functional requirements and other characteristics. The development process is under control with a predictable productivity performance. Data collected in an organization based on an inprocess sound measurement program, and where standardized measurement definitions have been adopted by all projects participants, leading to high data integrity.
Figure 3: A homogeneous productivity dataset It is obvious from Fig. 3 that the one-variable productivity model built from this data set is directly useful for estimation purposes. All other process variables combined together have a very small impact on the total variation of the dependent variable (i.e., here, Effort). Looked at from a control process view point, this data set represents a process ‘under control’, that is a process with
2015, © Copyright by authors, Published under agreement with IARIA - www.iaria.org
International Journal on Advances in Software, vol 8 no 1 & 2, year 2015, http://www.iariajournals.org/software/
107 a predictable performance, both in terms of productivity and efficiency. III.
A PRACTICAL USE OF THESE ECONOMIC CONCEPTS: AN EMPIRICAL STUDY
A. Context A Canadian organization interested in determining its own productivity, in understanding some of the key drivers behind its major productivity variations, and in using the findings to improve its organizational performance in general and its estimation process in particular was selected for the empirical study. This organization, a government agency, provides specialized financial services to the public, and its software applications are similar to those of banking and insurance providers. It has a software development methodology fully implemented across all of its projects. The main objectives of the empirical study were: 1. Internal benchmarking, i.e., compare the productivity of individual projects. 2. Develop estimation model(s) based on the data collected. 3. Identify and explain significant productivity variations across the organization’s projects. 4. Identify opportunities for process improvement. B. Data collection procedures The initial step was to identify projects that could be measured for the productivity and benchmarking analyses. The selection criteria were: Projects completed within the previous two years, and Project documentation available for functional size measurement. For this study, all data were recorded using the data field definitions of the data collection questionnaire of the International Software Benchmarking Standards Group [22]. C. Data Quality Controls Quality control of the data collection process is important for any productivity study. Here, two quantitative variables are critical: the effort reported for each project, and the project functional size: A- Effort data: in this organization, the time reporting system is considered highly reliable and is used for decision making, including payment of invoices when external resources are hired to complement project staffing. B- Measurement of functional size: the quality of the measurement results depends on the expertise of the measurers and on the quality of the documentation available for the measurement process. For this productivity study: all functional size measurements were
carried out by the same measurer with 20 years expertise in functional size measurement. Table I from [23] lists the criteria used to rank the quality of the documentation used for measuring functional size, on the basis of the documentation of the individual functional processes developed [23, 24]. Note that this is not a global subjective assessment of the documentation, but an assessment of the documentation of each of the functional processes based on the detailed documentation elements available for measurement. The individual rankings of each functional process were recorded by the measurer in parallel to the measurement of the functional size of each of the 16 projects. Table I: Criteria for ranking documentation quality [23] Rank Criteria A
Every function completely documented
B
Function documented, but without a precise data model Functions identified at a high level, but without any detail An approximation of the number of functions is available, with the individual functions not listed
C D
E
Some functions are not explicitly described in the documentation, but an expert measurer adds information based on his expertise, e.g., missing validation functions
Table II reports the documentation quality rankings of each project and specifies for each project what proportion of the project documentation met the various criteria listed in Table I. For this study, the documentation is considered ‘good’ when it meets criterion A or B in Table I. The following observations were made from Table II: - For 11 projects: the documentation of more than 95% of the functional processes measured was rated as being of good quality (equal to A or B). Considering the extended measurement expertise of the measurer and the high quality of documentation, the size measured for these 11 projects can be considered highly accurate. - For Projects 3 and 13: the documentation quality was rated as being of good quality for 62% and 71% of the functional processes respectively. - For project 10: the documentation was rated as being of average quality (criterion C). This could impact the accuracy of the size measured for this project, as it used less detailed documentation. - The documentation of Project 7 was rated as being of good quality for 31% of the functional processes. - For Project 8: most of the functions measured had to be derived from documentation at a very high level, that is criterion E = 100%. This means that the
2015, © Copyright by authors, Published under agreement with IARIA - www.iaria.org
International Journal on Advances in Software, vol 8 no 1 & 2, year 2015, http://www.iariajournals.org/software/
108 functional size for this project has been approximated rather than measured precisely, with an undetermined range of size variation. Overall, at the detailed level, 85% of all the processes measured for the 16 projects had a good level of documentation and provided a sound basis for the measurement of the functional size of the projects included in the productivity analysis reported in this paper. Table II: Quality of the documentation ranked at the functional process level
D. Descriptive Analysis 1) Projects characteristics For this study, the 16 software development and improvement projects were measured in terms of functional size, effort, and various environment qualifiers. The staff who developed these projects included both internal and external developers, distributed equally overall. In this dataset: Project size varied from a minimum of 111 FP to a maximum of 646 FP. Effort varied from 4,879 hours to 29,246 hours. Unit effort varies from 14 h/FP 12 to up to 98 h/FP, a factor of approximately eight between the least productive and the most productive within the same organization. Duration varied from 10 to 35 months. Maximum development team size for 12 of the 16 projects ranged from 6 to 35 employees. The descriptive statistics of this dataset are as follows, while details are reported in [8 – Table 12.2]: Average project effort = 12,033 hours (or, 1,718 person-days at 7 hours per day, or 82 person-months at 21 days per month).
Average unit effort = 41.5 h/FP Average project duration = 18 calendar months. One-third of the projects = newly developed software. Two-thirds of the projects = functional enhancements to existing software. 2) Project priorities Each project typically met four targets that are determined at project inception: Project scope (i.e., the functions to be delivered to the users) Project cost (or effort) Project deadline Quality of software delivered In a context of limited resources and a high level of uncertainty, it is extremely challenging to meet all these targets at the same time, and a number of compromises must be made during a project life cycle. To empower project managers to make such compromises, an organization will typically determine the priority targets for each project among those specific to any one project. The information on the priorities assigned to each of these four targets was collected through interviews of the project managers of these projects and recorded during the data collection process. A summary of project priorities is presented in Table III, where: For 8 of the 16 of the projects (i.e., 50%), the ‘deadline’ target was listed as priority 1. For 75% of the projects, the ‘scope’ target was listed as priority 1 or 2. For 50% of the projects, ‘quality’ was listed as priority 2 (and two projects listed it as priority 1). For none (0%) of the projects was the ‘cost’ target listed as priority 1 (and only one project listed cost as priority 2). Table III: Summary of project priorities Number of projects
Deadline Scope Quality Cost
Priority
Priority
Priority
Priority
1 8 6 2 0
2 1 6 8 1
3 1 4 2 9
4 6 0 4 6
These observations indicate that for this organization the project’s deadline is a high priority, while cost is a low priority. The reasons for favoring the deadline over the cost of the measured project were the following: The urgency to solve the problem for internal reasons; Obligations linked to current laws or future ones; The pressures of client managers for the reasons mentioned above or other reasons.
2015, © Copyright by authors, Published under agreement with IARIA - www.iaria.org
International Journal on Advances in Software, vol 8 no 1 & 2, year 2015, http://www.iariajournals.org/software/
109 IV.
PRODUCTIVITY ANALYSIS AND ESTIMATION MODELS
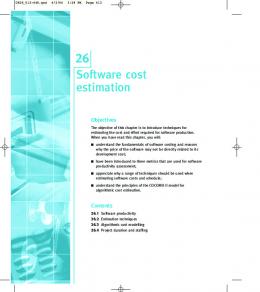
A. The overall productivity model for the organization The dispersion of points for the organization is illustrated in Fig. 4 for all 16 projects, with functional size on the x axis, and effort on the y axis: at first sight it appears somewhat like a wedge-shape data set rather than an homogeneous data set with respect to the functional size at the independent variable.
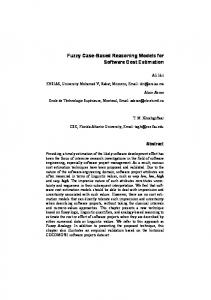
Figure 4: The dispersion of project productivity for the organization – N = 16 projects [8] Fig. 5 shows next the overall single-variable productivity model for the organization, using a single regression model: Effort = 30.7 h/FP x project size + 2,411 h (Fig. 5) The coefficient of determination (R2) of this model is relatively low, at 0.39.
Figure 5: The organization’s overall productivity model – N = 16 projects [1] The practical interpretation of the above equation is as follows: Fixed effort = 2,411 h Variable effort = 30.7 h/FP Possible reasons for the high fixed and high variable unit effort numbers discussed with the managers, and the
following observations provided in terms of the development methodology deployed in the organization: A. It is highly procedural and time-consuming. B. It included heavy documentation requirements. C. It required lengthy consensus building procedures across stakeholders and development staff. D. It required a relatively high number of inspections. This is the productivity model that should be used, across the 2-year time period, for later internal benchmarking as well as for external benchmarking. Productivity models based only on functional size allow independent comparisons across time periods and variations of technologies of processes used by others. From Fig.5, it can be observed that, for this organization, five projects had effort 100% higher than projects of comparable functional size: A project of approximately 100 FP required twice as much effort as two other projects of similar size. Four large projects (between 400 and 500 FP) required two or three times more effort than, projects only relatively smaller (between 350 and 400 FP). The effect of these four projects was to pull up the linear model (and corresponding slope) and considerably influence both the fixed and variable costs. Therefore, this data sample was split into two groups for further analysis. A. The group of 11 projects that have the best productivity (i.e., lower unit effort, and that are below or very close to the regression line in Fig. 5). B. The group of five projects that have a productivity much worse (i.e., a unit effort twice the unit effort of the 11 other projects, and that are largely above the regression line in Fig. 5). B. Organizational process capability: the most productive projects Fig. 6 presents the 11 projects with a much lower unit effort per project that is, those which were most productive. For these projects, the linear regression model is: Effort = 17.1 h/FP x size of the project + 3,208 h The coefficient of determination (R2) of this model is 0.589, higher, relatively, than that for the overall model. The practical interpretation of this equation is: Fixed costs = 3,208 h Variable Costs = 17.1 h/FP C. Productivity model of the least productive projects For the five least productive projects in group B, the productivity model in Fig. 7 is: Effort = 33.4 h/FP x project size + 8,257 h The coefficient of determination (R2) of this model is better, at 0.637. Of course, with a sample of only five projects, this number is not statistically significant, but is still interesting for the organization.
2015, © Copyright by authors, Published under agreement with IARIA - www.iaria.org
International Journal on Advances in Software, vol 8 no 1 & 2, year 2015, http://www.iariajournals.org/software/
110 identify the factors that caused this positive (or ‘negative’) impact? B. Could the organization avoid or, when avoidance is not possible, more effectively mitigate, the occurrence of the negative factors beyond the project manager’s control? Table IV: Fixed & variable efforts: Capability versus least productive projects [1] Figure 6: Most productive projects - N = 11 projects [8]
Figure 7: The productivity model of the least productive projects – N = 5 [8] The practical interpretation of the above equation is as follows: Fixed effort = 8.257 h Variable effort = 33.4 h/FP This group of the five least productive projects is characterized by a fixed cost that is almost four times higher than that of the full set of projects (8,257 hours vs. 2,411 hours), and a relatively similar variable effort unit (33.4 h/FP vs. 30.7 h/PF). The group of 11 most productive projects is characterized by a fixed cost approximately 40% lower than that of the least productive projects (3208 hours vs. 8257 hours), and a variable unit effort almost 50% lower (17.1 h/FP vs. 32.4 h/FP); that is, with interesting economies of scale and an R2 of 0.55. A summary of each group is presented in Table IV, where 11 projects represent what the organization is 'capable' of delivering in normal conditions and the other five projects illustrate how projects are significantly impacted by the presence of factors that have not yet been identified through the single independent variable (i.e., functional size) analysis. Exploration of these additional impact factors is discussed in the next sub-section D. The single variable productivity model still provides useful insights to the organization and allows it to monitor its own productivity models across time. For example: A. Would the fixed-variable cost improve over the next two-year period? A subsidiary question would be to
Most Least Samples/ All 16 productive: productive: Regression coefficients projects 11 projects 5 projects Fixed effort (hours)
2,411
3,208
8,257
Variable effort (h/FP)
30.7
17.1
34.4
D. Qualitative causal analysis The data collected has allowed us to identify the overall productivity of the organization, to observe the fixed and variable contributions of its process capability, as well as observing an 100% increase in both fixed and variable costs when there were factors negatively impacting on the productivity. Of course a single independent variable model cannot explain the causes of such variations. Furthermore, with a dataset of only 16 projects, there are not enough data points within a single organization (unless they have been collecting data for many years) to rely on quantitative analysis. Each additional independent typically requires 20 to 30 additional data points. In the absence of sample sizes large enough for quantitative analysis, qualitative analysis can help identify probable causes of increases. In the context here, qualitative analysis will not attempt to quantify precisely the impact of a cause (or cost drivers), but will attempt to identify qualitatively factors that could have the greatest negative impact on productivity. Firstly, in the causal analysis of the productivity variations in the organization, we eliminated two candidate cost drivers since they were considered constant in both groups of productivity performance: - Development methodology: in the organization the use of the industry-tailored development methodology was fully deployed across all software development projects: none of the activities and controls was bypassed. Therefore, there was no development methodology difference across all projects. - Project management expertise: some of the projects managers had, within this same two-year period, supervised projects that were both among the most productive and the least productive. Therefore, the expertise of specific project managers could not explain large project productivity differences.
2015, © Copyright by authors, Published under agreement with IARIA - www.iaria.org
International Journal on Advances in Software, vol 8 no 1 & 2, year 2015, http://www.iariajournals.org/software/
111 The question that arises: What are the factors that led to such large (i.e., +100%) increases in unit effort? What may be the major cause-effect relationships? To identify and investigate these relationships, available project managers were interviewed to obtain feedback as what they believed had contributed to either an increase or a decrease in the productivity of their respective projects. The project managers interviewed had managed seven of the 16 projects: A. Three projects with the lowest productivity (i.e., the highest unit effort); B. Two projects with average productivity; C. Two projects with the highest productivity (i.e., the lowest unit effort). The aim of the interviews was to obtain qualitative information from the project managers on the factors they believed had contributed, or not, to the increase in project effort compared to that of other projects of similar size developed in the organization’s environment or elsewhere during their project management practice. Their feedback is summarized as follows: A- The most productive projects had the following characteristics: 1. Users familiar were with both the business and software development processes; 2. Users were involved throughout the project; 3. Software developers working on the projects were experienced in the use of the development environment. B. The least productive projects had the following characteristics: B1. Customer related issues: 1. Customer requirements were poorly expressed, or a customer representative did not know his environment (business area), leading to frequent change requests during a project life cycle. 2. High turnover of users involved in the projects, leading to instability in the requirements and delays in decision making. 3. Customers not familiar with the software development process in the organization, including their required involvement in project activities, including activity reviews. B2. Project constraints: 1. Tight project deadlines for legal constraints or public face-saving leading to compressed scheduling and resources ‘piled up’ to make the problem disappear. 2. New technologies unknown to the developers. B3: Product constraints: Multiple links with other software applications of the organization. An example of a negative product constraint was reported for the project with the highest unit effort (98 h/FP). The software delivered by this project was of a small functional size, but required twice as much effort to develop as another of similar size as it interacted with
almost all the other software applications of the organization and was dependent on other organizational units. Another project had a very tight deadline, which led management to ‘throw’ resources at the problem to meet the deadline irrespective of the total effort required. It can be observed that although it was possible to identify ‘qualitatively’ some factors with major negative impact, the sample size was much too small for statistical tests to quantify such impact. V.
IDENTIFICATION OF PROCESS IMPROVEMENTS USING THE SWEBOK GUIDE
A. Implementation and coverage of best practices In previous years, the organization had invested considerably in designing and deploying improvements to its development methodology. For this empirical study, additional analyses were carried out to identify process strengths and weaknesses in order to identify improvement opportunities in development processes and techniques. The study included verification of the use of the recommended best software engineering practices in the participating organization. For this verification, the software engineering practices listed in the SWEBOK Guide [2] were used. This guide represents a broad international consensus on the concepts and practices of software engineering that are recognized as providing benefits to the majority of projects in most cases. All 10 knowledge areas of the 2004 version of the SWEBOK Guide were taken into account, with the exception of the maintenance knowledge area, which was not relevant for this empirical study – see Table V. To collect this information, the quality specialist participating in all project phases for each project was interviewed and asked to confirm whether or not each of the practices in the SWEBOK Guide was indeed being widely used across all projects in the organization. B. Coverage of best practices The percentages of software engineering practices in use in the organization for each knowledge area are presented in Table VI, in decreasing order of coverage. These percentages represent the ratio between the practices observed to be in general use in this organization, divided by the total number of practices listed in each of the SWEBOK knowledge areas. From all the knowledge areas related directly to the development life cycle, that is, from requirements engineering up to software testing, those with over 60% coverage indicates a very widespread use of organizational processes across the organization. In comparison to the capability level of the CMMI model, this would align with a number of Key Process Areas at Level 3, meaning that the software engineering processes
2015, © Copyright by authors, Published under agreement with IARIA - www.iaria.org
International Journal on Advances in Software, vol 8 no 1 & 2, year 2015, http://www.iariajournals.org/software/
112 in the organization have been deployed and are in use throughout the organization. Table V: SWEBOK 2004 Knowledge Areas SWEBOK Knowledge Areas Requirements Engineering Software Design Software Construction Software Testing Software Maintenance Software Engineering Management Configuration Management Software Engineering Process Software Quality Tools and Methods Table VI: Coverage of SWEBOK practices SWEBOK Knowledge Areas % coverage Software Design 89 Software Management 75 Configuration Management 74 Requirements Engineering 73 Software Construction 71 Software Testing 61 Tools & Methods 54 Software Engineering Process 44 Software Quality 38 However, coverage was much less extensive in support areas, such as Tools & Methods, Software Engineering Process, and Software Quality, where the product and process measures were not covered at all. For this reason, the organization had no measurable information on the effectiveness of the implementation of their practices and the benefits derived, that is, quantitative information to support the decision making process was lacking. This can be illustrated in the following way: while each project must use the corporate development process it generally lacked data for its evaluation and control functions. Therefore, the organization would not qualify for the fourth level of capability using the CMMI process evaluation model. VI.
SUMMARY AND IMPLICATIONS FOR MANAGEMENT
This paper has reported on productivity analysis of software projects developed by a governmental organization utilizing the productivity concepts from the field of economics, including fixed/variable costs modeling. For the organization studied, three productivity models were identified that represented respectively: - An overall productivity model of the organization that can be used for external benchmarking purposes. This overall productivity model can be used later
across other times periods to verify whether or not productivity of the organization is improving over time, and with respect to external similar organizations. - A productivity model built from the best productive projects representing a capability to deliver a software project with a lower fixed/variable effort structure, in the absence of major disruptive factors. - A productivity model based on the five projects with the highest unit effort: in this case, the presence of disruptive factors led to greater than 100% increase in project effort in comparison to the organization’s capability for process productivity. Of course, the limited number of projects available in these mathematical models does not permit generalization to other contexts, but does describe quantitatively and objectively many features of productivity in the organization. These models are representative of the organization studied where a unique software development methodology is widely implemented and represents well deployed, repeatable corporate software practices, rather than unpredictable individual and ad-hoc practices. For future project estimation, the organization should use the process capability model represented by the best performing projects, provided that a risk analysis has not detected the presence of any of the disruptive factors that have in the past increased effort twofold. Whenever such disruptive factors are identified with a high probability of occurrence the organization should estimate such projects using the productivity model derived from the least productive projects. The use of these two single-variable productivity models would be expected to provide more accurate estimates than the overall productivity model combining all previous projects. An organization such as the one studied having measured only a small set of projects is typical of many organizations without much historical data: there are not enough data points to build with high confidence multivariable estimation models representing local conditions and related organizational performance. The insights from productivity models developed from an economic perspective are important since relevant improvement activity may directly impact the productivity of the organization, by lowering either the fixed or variable project costs. Furthermore, the empirical study also identified opportunities for improvement in three areas, namely: 1. Early identification of project risks with a potentially twofold impact on project effort. 2. Increase in project management efficiency: Improvement in productivity analysis and current productivity models. Improvement in the estimation process. 3. Process improvement:
2015, © Copyright by authors, Published under agreement with IARIA - www.iaria.org
International Journal on Advances in Software, vol 8 no 1 & 2, year 2015, http://www.iariajournals.org/software/
113
Establishment of mechanisms for monitoring and evaluating processes. Reduction in fixed effort (establishment of predefined selection rules in the project context). Monitoring the impact of new technologies and new development processes. REFERENCES
[1]
[2]
[3]
[4]
[5]
[6] [7]
[8]
[9]
[10]
A. Abran, J. M. Desharnais, M. Zarour, and O. Demirors, "Productivity Based Software Estimation Model: An Economics Perspective and an Empirical Study," 9th International Conference on Software Engineering Advances ICSEA 2014, Nice (France), pp. 196-201, 2014. Abran A. and Moore, J. (co-executive editors), Bourque, P. and Dupuis, R. (co-editors), Tripp, L. (2005), "Guide to the Software Engineering Body of Knowledge - 2004 Version SWEBOK," IEEE-Computer Society Press, 200 pages. A. Abran and J. J. Cuadrado, "Software Estimation Models & Economies of Scale," presented at the 21st International Conference on Software Engineering and Knowledge Engineering - SEKE'2009, Boston (USA), July 1-3, 2009. M. Jørgensen and M. Shepperd, "A Systematic Review of Software Development Cost Estimation Studies," IEEE Transactions on Software Engineering, vol. 33 no. 1, pp. 33-53, 2007. M. Shepperd and M. and S. MacDonell, "Evaluating prediction systems in software project estimation," Information and Software Technology, Elsevier, vol. 54, pp. 820–827, 2012. B. Boehm, Software Engineering Economics: Englewood Cliffs, NJ, Prentice Hall, 1981. B. Boehm, C. Abts, A. W. Brown, S. Chulani, B. Clark, E. Horowitz, et al., Software Cost Estimation with COCOMO II: Prentice Hall, 2000. A. Abran, Software Project Estimation – The Fundamentals for Providing High Quality Information to Decision Makers: IEEE-CS Press & John Wiley & Sons – Hoboken, New Jersey, 2015. Barbara Kitchenham and E. Mendes, "Why comparative effort prediction studies may be invalid," in 5th International Conference on Predictor Models in Software Engineering, PROMISE, Vancouver, BC, Canada, 2009. F. A. Amazal, A. Idri, and A. Abran, "Analogybased Software Development Effort Estimation: A Systematic Mapping and Review,"
[11]
[12]
[13]
[14]
[15]
[16]
[17]
[18]
[19]
[20]
Information and Software Technology, vol. 58, pp. 206-230., 2014. J. Wen, S. Li, Z. Lin, Y. Hu, and C. Huang, "Systematic literature review of machine learning based software development effort estimation models," Information and Software Technology, Elsevier, vol. 54, pp. 41-59, 2012. International Organization for Standardization (ISO), "ISO/IEC 20968: Software Engineering Mk II Function Point Analysis - Counting Practices Manual," ed. International Organization for Standardization, Geneva, 2002. International Organization for Standardization (ISO), "ISO/IEC 24750: Software Engineering NESMA functional size measurement method version 2.1 - Definitions and counting guidelines for the application of Function Point Analysis," ed. International Organization for Standardization, Geneva, 2005. International Organization for Standardization (ISO), "ISO/IEC 20926: Software Engineering IFPUG 4.1 Unadjusted functional size measurement method - Counting Practices Manual," ed. International Organization for Standardization, Geneva, 2009. International Organization for Standardization (ISO), "ISO/IEC 19761: Software Engineering – COSMIC - A Functional Size Measurement Method," ed. International Organization for Standardization, Geneva, 2011. B. Kitchenham, "Empirical studies of assumptions that underlie software costestimation models," Information and Software Technology, vol. 34, pp. 211-218, 1992. B. Kitchenham and N. Taylor, "Software Cost Models," ICL Technical Journal, vol. 4, pp. 73102, 1984. K. Lind and R. Heldal, "Estimation of Real-Time Software Code Size using COSMIC FSM," presented at the IEEE Intl. Symposium on Object/component/service-oriented Real-time distributed Computing (ISORC), Tokyo, Japan, 2009. K. Lind and R. Heldal, "A Model-Based and Automated Approach to Size Estimation of Embedded Software Components," presented at the ACM/IEEE 14th International Conference on Model Driven Engineering Languages and Systems, Wellington, New Zealand, 2011. S. Stern and O. Guetta, "Manage the automotive embedded software development cost by using a Functional Size Measurement Method (COSMIC)," presented at the 5th International Congress and Exhibition: Embedded Real Time Software and Systems, ERTS, Toulouse, France, 2010.
2015, © Copyright by authors, Published under agreement with IARIA - www.iaria.org
International Journal on Advances in Software, vol 8 no 1 & 2, year 2015, http://www.iariajournals.org/software/
114 [21]
[22]
[23]
[24]
A. Abran and P. Robillard, "Function Points Analysis: An Empirical Study of its Measurement Processes," IEEE Transactions on Software Engineering, vol. 22, pp. 895-909, 1996. ISBSG R11. (2009, 2015.01.15). International Software Benchmarking Standard Group. Available: http://www.isbsg.org/ J. M. Desharnais and A. Abran, "Quality of Functional User Requirements documentation using COSMIC ISO 19761: verification process," presented at the International Workshop on Software Measurement – IWSM Stuttgart, Germany, 2010. J. M. Desharnais, B. Kocatürk, and A. Abran, "Using the COSMIC Method to Evaluate the Quality of the Documentation of Agile User Stories," presented at the 21st International Workshop on Software Measurement – 6th International Conference on Software Process and Product Measurement - IWSM-Mensura, Nara, Japan, 2011.
2015, © Copyright by authors, Published under agreement with IARIA - www.iaria.org