Programming Spatio-Temporal Data Streaming Applications with High-Level Specifications Shigeru Imai
Carlos A. Varela
Department of Computer Science Rensselaer Polytechnic Institute 110 Eighth Street Troy, NY 12180, USA
Department of Computer Science Rensselaer Polytechnic Institute 110 Eighth Street Troy, NY 12180, USA
[email protected]
[email protected]
ABSTRACT
Categories and Subject Descriptors
In this paper, we describe the design and implementation of PILOTS, a ProgrammIng Language for spatiO-Temporal data Streaming applications. Using PILOTS, application developers can easily program an application that handles spatio-temporal data streams by writing a high-level declarative program specification. Whereas spatio-temporal data is available with various spatial density and time frequency depending on data sources (e.g., weather forecast data can be given hourly/daily for a vast geographic area, while GPS data can be given every second or at a higher frequency for a specific geographic location), applications often need to process data at a constant frequency. To view such heterogeneous data streams as homogeneous data streams, PILOTS specifically provides first-class support for data selection and interpolation so that applications can get data consistently regardless of the data’s original spatio-temporal heterogeneity. To enable reasoning about errors in correlated spatiotemporal data streams, we introduce the notion of error signatures, patterns in output data streams that appear when input data is erroneous. These patterns are produced thanks to a mathematical model that explicitly specifies the redundancy exhibited in the input data. PILOTS applications readily produce error signatures, which can be an important tool to semi-automatically detect data error conditions and enable better decision support systems. As a motivating application, we illustrate a PILOTS program that receives as input data: the airspeed, the ground speed, and the wind speed for a flight. We then compute the error signatures exhibited by failing the airspeed data stream simulating a pitot tube icing scenario (such as the one occurring in Air France flight 447 in June 2009 ultimately killing all people onboard), and by failing the ground speed data stream simulating a GPS constellation shutdown.
D.3.3 [Programming Languages]: Language Constructs and Features—Frameworks
Permission to make digital or hard copies of all or part of this work for personal or classroom use is granted without fee provided that copies are not made or distributed for profit or commercial advantage and that copies bear this notice and the full citation on the first page. To copy otherwise, to republish, to post on servers or to redistribute to lists, requires prior specific permission and/or a fee. ACM SIGSPATIAL QUeST’12 November 6, 2012. Redondo Beach, CA, USA Copyright 2012 ACM 978-1-4503-1700-9/12/11 ...$15.00.
General Terms Languages
Keywords programming language, spatio-temporal, data streaming
1. MOTIVATION Operating an aircraft is known as a complicated task since there are a lot of complex correlations between the readings in a cockpit’s instruments. If a failure happens during a flight, it is not easy to find the cause of the failure by looking at the available (potentially partially erroneous) data, and also, a misinterpretation of instrument readings could even lead to an accident as the tragic crash of Air France flight 447, killing all 216 passengers and 12 aircrew [10]. The records from the crash have suggested that the pilots lost control of the airplane because they raised the nose of the airplane when it should not have been brought up. Many experts now understand that the airplane went into clouds with thunderstorms and its iced speed sensors provided inaccurate information to the autopilot, causing it to disengage. The pilots then incorrectly reacted to the emergency by raising the nose of the plane when in fact it needed to go down to avoid the stall. An active redundant data-driven flight system may help prevent crashes caused by malfunctioning sensors or other data errors. For example, by comparing the air speed data to the ground speed data, a flight system would be able to fact check a bad air speed reading, assuming reasonable constraints on the wind speed. If the (auto) pilot is only operating by air speed data, they would have no way of knowing that there is an error in the system and they would respond to the incorrect data, upsetting the balance of the plane. The ground speed data would instead provide a fact checking mechanism because if airspeed were swiftly changing, ground speed would be doing the same. If airspeed is changing, but ground speed remains unchanged, the more active flight system would be able to notify the pilot of the discrepancy, allowing for better informed decision making. Considering the development of such an active flight system, applications running on the flight system should deal
with (1) the airplane’s constantly changing location and potentially inaccurate and incomplete input data streams from various sensors and (2) reasoning about the input data streams to identify failures and their potential sources using redundancy among the input data streams. To provide a technological foundation towards the purpose of (1), we have defined a programming model for spatiotemporal data streaming applications [3], which is specifically designed for moving objects (e.g., airplanes, cars, trains, and so on) to take spatio-temporal data streams as inputs and output processed data streams. In this paper, we describe the design and implementation of a programming language following the model: PILOTS (ProgrammIng Language for spatiO-Temporal data Streaming applications). PILOTS provides first-class support for space and time specific operations including data selection and interpolation when no data is available for a certain location and time. We also show some experimental results of running PILOTS code on actual flight data with simulated error conditions to produce error signatures, an important step towards the realization of (2). The rest of the paper is organized as follows. Section 2 introduces the PILOTS programming language for spatiotemporal data streaming applications. Section 3 describes the implementation of the language in detail, and Section 4 presents experimental results of running PILOTS code. Section 5 shows related work, and finally we conclude the paper in Section 6 highlighting potential future work.
2.
SPATIO-TEMPORAL PROGRAMMING LANGUAGE
2.1 System Architecture Figure 1 shows the system architecture for applications implemented in the PILOTS programming language. In this architecture, the application gets data (d′1 , d′2 , . . . , d′n ) from the Data Selection module, which takes incoming data streams (d1 , d2 , . . . , dn ) as inputs, and then the application indefinitely generates outputs (o1 , o2 , . . . , om ) and data errors (e1 , e2 , . . . , el ) based on an Application Model. Each input data stream di (x, y, z, t) is a function of location and time. The number of arguments of di varies depending on dimensions of the location information, that is, di (t) for 0-D (i.e., no location support), di (x, t) for 1-D, di (x, y, t) for 2-D, and di (x, y, z, t) for 3-D. Some data streams are coming in real-time whereas some predicted information (e.g., weather forecasts) is associated with future time periods. The Data Selection module stores some amount of incoming data stream until it becomes out of date. The application acquires the selected or interpolated data (d′1 , d′2 , . . . , d′n ) from the Data Selection module at a certain rate specified in the Application Model and computes both outputs and data errors. The application continues this computing process in an infinite loop unless the user explicitly specifies the termination time. Whereas spatio-temporal data is available with various spatial density and time frequency depending on sources of data in general (e.g., weather forecast data can be given hourly/daily for a vast geographic area, GPS data can be given every second or at higher frequency for a specific geographic location), the application often needs to process data at a constant frequency. The Data Selection module
essentially allows an application to view a set of these heterogeneous data streams as a homogeneous data stream, and therefore enables a separation of concerns: application programmers can focus on their application model.
Figure 1: System architecture of PILOTS programs which handle spatio-temporal data streams
2.2 First Class Support for Data Selection PILOTS specifically implements first-class support for data selection and interpolation in the Data Selection module so that the application can get data consistently regardless of its heterogeneity. Here we explain three methods for data selection and interpolation: closest, euclidean, and interpolate and show an example use of these methods.
2.2.1 Data Selection/Interpolation Methods • closest This method takes a 1-D argument (i.e., t, x, y, or z) to find the data closest to a given location or time. Figure 2 shows examples of selecting closest data to the current time and location respectively. In Figure 2(a), when selecting the closest time to the current time tcurr , di (tcurr ) is not defined, but di (t) is defined for {t | t1 ≤ t ≤ t2 , t3 ≤ t ≤ t4 , t5 ≤ t ≤ t6 }. Since t4 is closest to tcurr , we define d′i (tcurr ) , di (t4 ). Similarly, we define d′i (xcurr ) , di (x3 ) for the example shown in Figure 2(b). • euclidean This method takes 2-D or 3-D arguments to find the data closest to a given location. Figure 3 shows an example for the 2-D case, where data is not defined for the current location lcurr = (xcurr , ycurr ), but are defined for l0 , and l1 . Since lcurr is closest to l0 = (x0 , y0 ) in Euclidean distance, we define d′i (xcurr , ycurr ) , di (x0 , y0 ). • interpolate This method takes 1-D, 2-D or 3-D arguments to linearly interpolate the defined data. It also takes another argument ninterp to select the closest ninterp data from a given location to interpolate. Suppose we have a situation shown in Figure 4, where data is not defined for the current location lcurr = (xcurr , ycurr ), but are defined for l0 , l1 , and l2 . Also, suppose that ninterp is
Table 1: Wind speed prediction information (ID:0-2 for Albany, ID:3-5 for Pittston, and ID:6-8 for JFK Airport ID
Figure 2: (a) Selecting the closest time (above); (b) Selecting the closest x value (below)
0 1 2 3 4 5 6 7 8
latitude(x), longitude(y) 42.73,-73.69 42.73,-73.69 42.73,-73.69 41.34,-75.72 41.34,-75.72 41.34,-75.72 40.64,-73.78 40.64,-73.78 40.64,-73.78
altitude(z) [ft.] 3000 6000 9000 3000 6000 9000 3000 6000 9000
time(t) 04/03/12 04/03/12 04/03/12 04/03/12 04/03/12 04/03/12 04/03/12 04/03/12 04/03/12
14:00 14:00 14:00 14:00 14:00 14:00 14:00 14:00 14:00
windspeed [knot] 20 32 40 17 31 41 18 33 43
2.2.2 Example Imagine you are flying in an airplane at the altitude of 7000 ft. in the middle of New York state as shown in Figure 5. Given the predicted wind speed information for Albany, Pittston, and JFK Airport in Table 1, how can we estimate a reasonable wind speed for the current location at the current time?
Figure 3: Selecting the closest 2D region in Euclidean distance 2, we select l0 and l1 since they are closer to lcurr than l2 . In such a case, we linearly interpolate the data defined for l0 and l1 by taking a weighted sum based on the Euclidean distance as follows:
d′i (xcurr , ycurr ) kl0 − lcurr k ) · di (x0 , y0 ) + , (1 − P1 j=0 klj − lcurr k kl1 − lcurr k (1 − P1 ) · di (x1 , y1 ) j=0 klj − lcurr k
Figure 5: Example geographical relationship between the current location and surrounding cities (1)
Note that the equation (1) can be easily extended to n data points.
Suppose the current location represented by (latitude, longitude, altitude) is (42.20, -74.18, 7000 ft.) and the current time is 04/03/12 15:34, we can get a wind speed by applying euclidean(x,y), closest(t), and interpolate(z,2) sequentially as follows. 1. Apply euclidean(x,y) to all the data. Looking at latitude(x) and longitude(y), the closest city to the current location is Albany as shown in Figure 5. Select the data from ID:0 to ID:2. 2. Apply closest(t) to data ID:0-2. Looking at time(t), the current time is equally close to the time of data ID:0-2. Select all three data.
Figure 4: Linear interpolation
3. Apply interpolate(z,2) to data ID:0-2. Since ninterp is 2, pick up the two closest data in altitude(z), which are ID:1 and 2. Finally, calculate the final wind speed value similar to the equation (1) as (1 − 1000/3000) ∗ 32+(1−2000/3000)∗40 = 13.33+21.33 = 34.66 [knot].
2.3 Example Program Specifications Here we show two example program specifications; one is very simple and the other is slightly more complex than the first one. See [3] for the detailed PILOTS grammar definition. We will see the experimental results of these programs later in Section 4.
2.3.1 Simple Example - Twice Figure 6 shows one of the simplest program specifications written in PILOTS, called twice. As the name says, it takes two input streams, a(t) and b(t), where b is supposed to be twice as large as a, and outputs an error defined by e = (b − 2 ∗ a) every 1 second. Note that these two input streams are not associated with any location information.
✬
program twice ; inputs a : ( t ) using closest ( t ); b : ( t ) using closest ( t ); outputs ; errors e : ( b - 2 * a ) at every 1 sec ; end ;
✫
✩
input data stream. In the case of the first input data stream, there are two functions, wind_speed(x,y,z,t) and wind_angle(x,y,z,t), that share the same arguments and information source (weather forecast). Data interpolation/selection methods used for these two functions are euclidean(x,y), closest(t), and interpolate(z,2). Just like we explain in Section 2.2.2, these methods apply in order: first, the closest x and y to xcurr and ycurr in Euclidean distance are selected; second, the closest t to the current time tcurr is selected; and finally, the final value is linearly interpolated on the z-axis using up to the two closest data points to zcurr as specified in the argument.
✬
program flightplan ; inputs wind_speed , wind_angle : (x ,y ,z , t ) using euclidean (x , y ) , closest ( t ) , interpola te (z ,2); air_speed , air_angle : (x ,y , t ) using euclidean (x , y ) , closest ( t );
✪
ground_speed , g r o u n d _ a n g l e : (x , y , t ) using euclidean (x , y ) , closest ( t ); outputs crab_angle : arcsin ( wind_speed * sin ( wind_angle - air_angle ) / sqrt ( air_speed ^2 + 2* air_speed * wind_speed * cos ( air_angle - wind_angl e ) + wind_speed ^2)) at every 1 min ;
Figure 6: A simple declarative specification of the twice application
2.3.2 More Complex Example - Flight Planning This is an example of a simplified flight planning system. Suppose that sensors in an airplane record airspeeds va during a given flight and GPS units record the airplane’s flight path over the ground including ground speeds vg at different locations. An aircraft’s airspeed and ground speed are related by the following mathematical formula (2), where va and αa are the aircraft airspeed and angle (heading), and vw and αw are the wind speed and direction acquired from the weather forecast: vg =
p
2 va2 + 2va · vw · cos(αa − αw ) + vw
(2)
Also, we can compute crosswind velocity: vx = vw · sin(αa − αw ). Therefore, given the aircraft desired course αd , it is possible to compute the crab angle δ by using the formula (3) so that the aircraft can use αa = αd + δ as the heading to maintain the desired direction under varying wind conditions. δ = arcsin(vx /vg ) = arcsin
✩
vw · sin(αa − αw ) p 2 2 va + 2va · vw · cos(αa − αw ) + vw
!
(3)
The above mentioned relationship can be brought into a program specification shown in Figure 7, which outputs the crab angle δ and error e that is the difference between the monitored ground speed vg from GPS and the calculated one with the equation (2). In this flight planning example, there are three input data streams in which each stream has two functions. Since each of these two functions has the same source of information and arguments, they are declared as a single
errors e: ground_speed sqrt ( air_speed ^2 + 2* air_speed * wind_speed * cos ( air_angle - wind_angle ) + wind_speed ^2) at every 1 min ;
✫ end ;
Figure 7: A declarative specification of the flight planning application
3. LANGUAGE IMPLEMENTATION When executing a PILOTS program, its high-level program specification needs to be compiled into Java code by the PILOTS compiler. The generated application program then uses the PILOTS runtime library to run the program.
3.1 Compiler The compiler consists of two parts: a parser and a code generator. The parser is developed using JavaCC [4]. Then the code generator uses the abstract syntax tree created from the parser and applies visitor pattern to generate Java code.
3.2 System Interaction Figure 8 shows how a PILOTS application interacts with the system. The interactions are based on a client-server model using Internet sockets in which the application works as a server and takes inputs from the clients on a single port.
✪
It outputs some values to the specified output ports as well as error values to the specified error ports.
Figure 8: System interaction of a PILOTS application When executing a compiled Java program, we specify input, output, and error ports as follows. In this example, the flightplan application illustrated in Section 2.3.2 takes an input data stream on the port 10001 and sends output and error streams to the hosts specified by 10.0.0.1:20001 and 10.0.0.2:30001 respectively. $ java pilots.tests.Flightplan -input 10001 -outputs 10.0.0.1:20001 -errors 10.0.0.2:30001
3.2.1 Data Format The input, output, and error data streams share the same format shown in Table 2. The first line is used to declare one or more variables (var0, var1,...) in a single data stream. The values of the declared variables start from the second line. The data stream can have multiple values (val0, val1,...) with various spatial and temporal combinations: ex1 is just defined for a 2-D region; ex2 is defined for a 3-D point and a time interval; ex3 is defined for a 1-D interval and a particular time; ex4 is defined for no location and a particular time. All lines have to end with an end-of-line marker (\n). Especially, the last line has to have only one end-of-line marker. Note that the data format for input is compatible with output and error, that is, we can connect either an output or error port to an input port of another PILOTS application. Table 2: The data stream format of input, output, and error first line after second line last line
#var0,var1,...\n ex1) x0,y0∼x1,y1::val0,val1,...\n ex2) x,y,z:t0∼t1:val0,val1,...\n ex3) x0∼x1:t:val0,val1,...\n ex4) :t:val0,val1,...\n \n
.
Here are some instances of spatio-temporal data for ex1· · · ex4 respectively. • ex1) 40.100,-76.300∼39.600,-76.300::166.0,215.0 • ex2) 42.749,-73.802,3000:2012-04-03 140000-0500 ∼2012-04-03 210000-0500:15.0,320.0 • ex3) 42.6886∼43.9258:2012-04-03 140900-0500 :112.0,222.0 • ex4) :2012-04-03 141400-0500:42.5486,-74.1142,8100.0
3.2.2 Running Mode Two modes are available for the user to run PILOTS applications as shown below. • real-time mode: This mode is default and is intended to be used for receiving data from sensors and processing it in real-time. If the frequency of an output is specified as “at every 1 min” in the program specification, the program actually outputs data once every 1 minute. Also, in this mode, the program finishes if one of input data streams sends the last line marker (\n) or certain amount of time has elapsed, which can be specified by the user in the command line as -DtimeSpan=30min. • simulation mode: This mode is used for simulations and is activated if the user gives a past time span in the command line as -DtimeSpan=t0∼t1. The PILOTS runtime sets its internal time as t0 and virtually progress the time as the program runs, and when the internal time reaches t1, the program finishes. The user can get outputs as fast as possible. This mode is intended to be used for processing recorded data in the past. In either mode, time stamp of input streams should match the internal time of the PILOTS runtime to get proper outputs.
3.3 Runtime Library The PILOTS runtime library is in charge of starting a data receiving server, storing received data, providing data selection/interpolation service to the application, and sending processed data to output/error hosts. Primary classes included in the PILOTS runtime library shown in Figure 9 are explained as follows. • PilotsRuntime class is extended by the application and provides all basic functions to run a PILOTS application other than application-specific processing. It starts DataReceiver to start receiving data, requests stored data from DataStore, and sends calculated outputs and errors to other hosts. • DataReceiver class receives data from data input clients from a port specified in the command-line arguments. Upon accepting data, it launches a new worker thread to receive data and the created thread requests to add these data to DataStore. • DataStore class accepts data from DataReceiver as a string, and then it asks SpatioTempoData to parse the string and stores the parsed data. It also implements getData() method supporting closest, euclidean, interpolate for data selection. When comparing locations and time for data selection/interpolation, it asks for the current time and location from CurrentLocationTimeService. Stored data are accessed from multiple threads (i.e., threads for adding data from DataReceiver vs. threads getting data from PilotsRuntime), so the data have to be protected from simultaneous data access. • CurrentLocationTimeService class is an interface class for providing the current time and location. Users have to implement this class for the system to work
4.1.2 Results
Figure 9: Class diagram of PILOTS runtime library (e.g., SimpleTimeService and SimulationService). The implemented class can either return the actual current time for the real-time mode or past time for the simulation mode.
4.
EXPERIMENTS
In this section, we report the results of two experiments. The first experiment has been done with the twice application to illustrate how error signatures exhibit different shapes depending on simulated input data streams. The second one has been conducted with the flightplan application to apply PILOTS to data sampled in the real world and see how PILOTS’ first-class support for data selection and interpolation work for real data.
4.1 Simulated Data Inputs - Twice
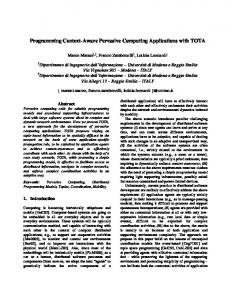
Figure 10 shows different types of errors generated with the four different scenarios. In Figure 10(a), most of the time the error stays at zero, but there are several spikes due to transient fluctuation of the data input timing. It happens occasionally since the use of closest(t) causes the Data Selection module to select data at one second earlier or one second later than it is supposed to select. This type of error is unavoidable without a special synchronization mechanism between multiple data streams. Figure 10(b) shows a signature of out-of-sync input data streams. As shown in the graph, the error becomes consistently large at around 30 seconds of the simulation time. This is because the variable a’s input data stream becomes consistently one second behind the variable b’s input data stream. Figure 10(c) suggests more critical failure of the variable a’s input data source. At around 50 seconds of the simulation time, the error starts growing linearly. This linear increase of the error explains that the input data stream of the variable a stops coming after 50 seconds of the simulation time, which potentially means that a critical failure occurred at the source of the variable a. Similarly, Figure 10(d) suggests that a critical failure occurred at the source of the variable b. 2.5
3 2
2
1
1.5
0 -1 0
1 20
40
60
80
100
120
-2
0.5 0 -0.5 0
-3
20
40
60
80
100
Time [sec]
Time [sec]
(a) Error signature for Scenario A
(b) Error signature for Scenario B
120
50
150 100
0
50
-50
0
0
20
40
60
80
100
120
-100 0
20
40
60
80
100
120
-50
-150
Time [sec]
(c) Error signature for Scenario C
Time [sec]
(d) Error signature for Scenario D
4.1.1 Experimental Setup As we present in Figure 6, the twice application takes two inputs, a and b, and we prepare an independent client for each input to test the following four different scenarios.
Figure 10: Error signatures generated by the twice application
• Scenario A: There are random timing jitters between one data and another on the data input clients. That is, every 1 ± ǫ seconds, the variable a’s input comes as 1, 2, 3, . . ., whereas the variable b’s input comes as 2, 4, 6, . . ..
As we can see from the graphs, errors behave differently depending on the input data streams, thus those error signatures could tell us valuable information about potential failures in the data sources.
• Scenario B: The variable a’s data stream becomes consistently one second behind the variable b’s input data stream at some point of time. • Scenario C: The variable a’s data stream stops providing data at some point of time. • Scenario D: The variable b’s data stream stops providing data at some point of time. In all the scenarios, the application runs in the real-time mode with SimpleTimeService that returns the current time only. We start the twice application followed by the data input clients, and then record the error output for 120 seconds once data from the clients reaches the PILOTS runtime.
4.2 Real Data Inputs - Flight Planning 4.2.1 Experimental Setup The second author is a general aviation private pilot and we conducted a simulation with the flightplan program based on his actual flight from Albany, New York to Tipton, Maryland (near Washington D.C.) on April 3rd, 2012. air_speed and air_angle were manually collected during the flight, whereas ground_speed and ground_angle were automatically collected from online data [2]. We have to use weather forecast information for wind_speed and wind_angle from [6] since we could not record the actual wind information during the flight. Note that air_speed and air_angle are sparsely given as shown in Figure 11 since they were manually recorded while
✜
✣
✢
# air_speed , air_angle 42.748 , -73.802~41.476 , -75.483::162 ,246 41.476 , -75.483~41.000 , -76.000::161 ,239 41.000 , -76.000~40.100 , -76.300::161 ,221 40.100 , -76.300~39.600 , -76.300::166 ,215 39.600 , -76.300~39.500 , -76.400::165 ,213 39.500 , -76.400~39.085 , -76.759::135 ,204
Figure 11: Formatted data for airspeed and air angle from the April 3rd flight
Just like the previous section with the twice application, we test the following four different scenarios including three simulated error conditions. • Scenario A: No error is added. Use the real data only. • Scenario B: Simulate an airspeed sensor (called pitot tube) icing failure. If the airspeed sensor is iced, typically the airspeed suddenly drops in a few seconds, and then it keeps reporting a constant value.
100 80 60 40 20 0 -20 0 -40 -60 -80 -100
10
20
30
40
50
60
70
80
90 100
error crab angle
0 -2 -4 -6 -8 -10 -12 -14 -16 -18 -20
Crab Angle [degree]
✤
since the relationship presented by the equation (2) holds well. In the case of Scenario B, Figure 13(b) shows that the error suddenly increases at around 40 minutes caused by a sudden drop of the airspeed (150 to 50 knots in two minutes). Unlike Scenario B, Scenario C shows a different error signature as shown in Figure 13(c). From the graph, we can see that the ground speed suddenly drops from 170 to 0 knot at around 40 minutes and that causes the error to drop accordingly. When we have both failures, we get an error signature as shown in Figure 13(d). This error signature tells us that the errors for Scenario B and C do not cancel out, but they are emerged as a combination of the individual error signatures. This result potentially means that we may be able to tell the causes of multiple errors from one combined error signature. As we can see from the graphs, there is a clear distinction between the error signatures. These results encourage us to pursue automated reasoning about data errors and recovery.
Error [knot]
operating the aircraft, and also the density of wind_speed and wind_angle is not very high as we have previously seen in Table 1. Unlike other data, ground_speed and ground_angle are given every minute.
Time [min]
• Scenario C: Simulate a GPS failure. GPS loses satellites and keeps reporting 0s as the values for both ground speed and ground angle.
Figure 12: Error and output generated by the flightplan application
• Scenario D: Simulate both an airspeed sensor icing failure and a GPS failure mentioned above. For all the scenarios, we run the program in the simulation mode with SimulationService that returns the location and time based on the actual flight path. To specify the start time and end time of the simulation, we run the program with the option -DtimeSpan="2012-04-03 1404∼2012-0403 1545" for the 1 hour and 41 minutes flight.
4.2.2 Results Figure 12 plots the error and crab angle from the flight planning application for Scenario A (no errors). Looking at the graph, we notice that the error is large at the beginning of the flight (around 0∼9 minutes) and also at the end of the flight (around 90∼100 minutes). The reason is inaccuracy of the airspeed, which is illustrated in Figure 13(a) in which we plot the airspeed, ground speed, calculated ground speed, and error separately from the outputs of the flightplan application to analyze the reasons of the error. In the graph, we see that the airspeed is almost constant whereas actual ground speed changes dynamically at the time of departure and landing. In general, airspeed is supposed to change a lot when departing and landing; however, since airspeed was manually recorded and these periods are the busiest for flying the airplane, it is not accurate. Consequently, inaccuracy in airspeed makes the calculated ground speed erroneous since it is directly related to the airspeed according to the equation (2). Despite the large error when departing and landing, the error stays relatively low around 10∼90 minutes, and that fact suggests PILOTS’ data selection/interpolation methods work well during this period
5. RELATED WORK Spatio-temporal constraint logic programming has been proposed. STACLP [7] offers first-class support for representing and reasoning about spatial and temporal data. A similar logic language to STACLP, MuTACLP [5][1], has been applied to GIS for spatio-temporal reasoning [8]. Both STACLP and MuTACLP are implemented based on a Prolog system. Programming languages that support probabilistic reasoning have also been proposed. PRISM[9] is a logic-based language that integrates logic programming and stochastic reasoning including parameter learning. PRISM is capable of parameter learning from a given set of data and estimates the probability to best explain the data. PRISM is also built on top of a Prolog system. Our programming language is also highly declarative and generates code to help understand and reason about spatio-temporal data streams.
6. CONCLUSIONS We presented the design and implementation of PILOTS, a programming language for spatio-temporal data streaming applications. The language enables to specify in a declarative (high-level) manner the mathematical relationship between data streams. We also illustrated different methods that can be combined to interpolate and select the data. These methods enable developers to declaratively specify how to convert potentially heterogeneous data streams—i.e., streams using different scales in space and time—into homogeneous data streams amenable to processing and analysis.
Speed & Error [knot]
200 150 100 50 0 -50 0 -100 -150 -200
10
20
30
40
50
60
70
80
90
Future work includes modeling more complex data relationships in aviation and navigation systems, discovering error signatures for common data error conditions, using error signatures as a means to semi-automate error recovery and reason about spatio-temporal data streams, and applying the programming model and language to other domains generalizing it as appropriate.
100
Time [min]
Speed & Error [knot]
(a) Error signature for Scenario A 200
ACKNOWLEDGMENTS
100
We would like to thank Jaemyeong Eo and Yazmin Feliz for their help on creating test data. This research is partially supported by Air Force Office of Scientific Research Grant No. FA9550-11-1-0332.
0 0
10
20
30
40
50
60
70
80
90
100
airspeed
-100 -200
ground speed
Time [min]
(b) Error signature for Scenario B calculated ground speed error
Speed & Error [knot]
200 100 0 0
10
20
30
40
50
60
70
80
90
100
-100 -200
Time [min]
(c) Error signature for Scenario C Speed & Error [knot]
200 100 0 0
10
20
30
40
50
60
70
80
90
100
-100 -200
Time [min]
(d) Error signature for Scenario D
Figure 13: Error signatures and speed information generated by the flightplan application
An important goal of this work is to enable spatiotemporal data analyses that detect errors in input data streams with high probability. This is accomplished by explicitly modeling redundancy in the input data streams allowing application developers to not only specify output data streams but also to specify mathematically the relationship between redundant data as error streams. These error streams can be seen as signatures that characterize different input data error conditions with high probability. We used PILOTS to uncover the error signatures of a trivial application (twice) illustrating clearly distinguishable patterns on different kinds of failure (out of synchronization and data stream loss failures). We subsequently used PILOTS to model the relationship between air speed, ground speed, and wind speed of an actual general aviation flight between Albany, NY and Washington, DC. We computed the error signatures for (i) normal conditions, (ii) a simulated pitot tube failure (affecting the airspeed data stream), (iii) a simulated GPS constellation failure (affecting the ground speed data and ground angle stream,) and (iv) a simultaneous failure of the pitot tube (ii) and GPS system (iii). These error signatures illustrate that patterns can be used to discover with high likelihood the source of potential data errors.
7. REFERENCES [1] P. Baldan, P. Mancarella, A. Raffaet` a, and F. Turini. MuTACLP: A language for temporal reasoning with multiple theories. In Computational Logic: Logic Programming and Beyond’02, pages 1–40, 2002. [2] FlightAware. Flight track log for N756VH on 03-Apr-2012 (KALB-KFME). http://flightaware.com/live/flight/N756VH/ history/20120403/1800Z/KALB/KFME/tracklog. [3] S. Imai and C. A. Varela. A programming model for spatio-temporal data streaming applications. In Dynamic Data-Driven Application Systems (DDDAS 2012), pages 1139–1148, Omaha, Nebraska, June 2012. [4] JavaCC Development Group (Open Source Project under BSD License). Java compiler compiler (javacc) the java parser generator. http://javacc.java.net/. [5] P. Mancarella, G. Nerbini, A. Raffaet` a, and F. Turini. MuTACLP: A language for declarative GIS analysis. In Computational Logic’00, pages 1002–1016, 2000. [6] NOAA’s National Weather Service. Forecast winds and temps aloft. http://aviationweather.gov/products/nws/winds/. [7] A. Raffaet` a and T. W. Fr¨ uhwirth. Spatio-temporal annotated constraint logic programming. In PADL’01, pages 259–273, 2001. [8] A. Raffaet` a, F. Turini, and C. Renso. Enhancing GISs for spatio-temporal reasoning. In Proceedings of the 10th ACM international symposium on Advances in geographic information systems, GIS ’02, pages 42–48, New York, NY, USA, 2002. ACM. [9] T. Sato and Y. Kameya. Parameter learning of logic programs for symbolic-statistical modeling. In Journal of Artificial Intelligence Research(JAIR), volume 15, pages 391–454, 2001. [10] Wikipedia. Air France Flight 447. http: //en.wikipedia.org/wiki/Air_France_Flight_447.