19th Symposium IMEKO TC 4 Symposium and 17th IWADC Workshop Advances in Instrumentation and Sensors Interoperability July 18-19, 2013, Barcelona, Spain
PSD estimation in Cognitive Radio systems: a performance analysis Leopoldo Angrisani1, Domenico Capriglione2, Luigi Ferrigno2, Gianfranco Miele2 1
Department of Computer Science and Control Systems, University of Naples “Federico II”, Via Claudio 21, 80125 Naples, Italy,
[email protected] 2 DIEI, University of Cassino and Southern Lazio, Via G. Di Biasio 43, 03043 Cassino (FR), Italy, {capriglione, ferrigno, g.miele}@unicas.it
Ab st ra c t -To meet the demanding expectations of the users, nowadays radio systems have to use the spectrum resource more intensely than in the past. Several studies have demonstrated that portions of radio spectrum are not in use for significant periods of time. Cognitive radios systems have been conceived to overcome this limit, enabling a flexible spectrum allocation, and making a more intensive and efficient spectrum use by the users sharing spectrum access. To meet this goal, cognitive radio terminals have to dynamically select the appropriate operating frequency based on the sensing of signals emitted by other transmitters. The paper focuses the attention on the performance analysis of a spectrum sensing based on the energy detection method. In particular, several power spectrum estimation methods are investigated in order to compare them mainly in terms of overall computational burden and algorithm performance. Ke ywo rd s -Power spectrum, PSD estimation, spectrum sensing, cognitive radio. I. Introduction Advances in communication technology, during the last years, have allowed the creation of new wireless devices able to meet the demanding expectations of the modern user. Unfortunately, to reach this goal, the radio systems have to use the spectrum more intensively and more efficiently than in the past. Starting from these considerations, several national commissions have started to study the spectral efficiency of the traditional frequency allocation policy. The conclusions that they obtained, indicate that portions of the radio spectrum are not in use for significant periods of time [1]. As a consequence, it is necessary to design a more flexible way to manage the radio spectrum resource. To this aim, a technical solution called Cognitive Radio (CR), which promises the improvement of the spectrum utilization has been introduced [2]. It has been conceived to enable a flexible spectrum allocation, making a more intensive and efficient spectrum use by spectrum users sharing spectrum access on a negotiated or an opportunistic basis [2]. The CR terminals have the ability to determine their location, sense spectrum use by neighboring devices, change dynamically their transmission parameters, such as carrier frequency, bandwidth, output power, and modulation scheme characteristics, in order to exploit various not busy spectrum portions. Among the capabilities, that a CR system should have, the frequency agility [3] is surely one of the most important. It is the ability of a radio to change its operating frequency, combined with a method to dynamically select the appropriate operating frequency based on the sensing of signals from other transmitters. As a consequence, the correct choice of the operating frequency to be adopted by a CR transmitter, that is working in an environment characterized by a crowded spectrum, is not a trivial task. In this framework, performing a careful spectrum sensing is a fundamental operation, which could affect the frequency agility capability of the transmitter. Even though several methods for spectrum sensing in CRs have been proposed in the literature [4], they do not seem to be suitable for satisfying the frequency agility capability because no information about the operating frequency to be chosen is usually given. Stemming from the past experience in developing innovative digital signal processing method for spectrum interference monitoring [5], and in measuring the power emitted by RF telecommunication transmitters [6]-[8], the authors have recently proposed a new measurement algorithm for frequency agility capability in CRs [9]. Main aim of the proposed algorithm is to select an operating frequency for the CR terminal, minimizing the possibility to interfere with a primary user (i.e. a user that has not cognitive capabilities), even in scenarios characterized by negative Signal to Noise Ratios (SNRs). The proposed algorithm is based on two sequential stages: the former performs the spectrum sensing, while the latter selects the operating frequency for the terminal. In this paper the attention is focused on the improvement of the former stage which is synthetically described in figure 1. In particular, the spectrum sensing stage belongs to the class of the energy-based detection method and carries out the PSD estimation of the incoming signal and the trace smoothing operation in order to reduce the noise. As shown in the following, this operation makes easier the threshold selection that will be used to detect the occupied bandwidths inside the frequency interval under analysis. The trace smoothing task is performed by
ISBN-10: 84-616-5438-2 | ISBN-13: 978-84-616-5438-3
543
19th Symposium IMEKO TC 4 Symposium and 17th IWADC Workshop Advances in Instrumentation and Sensors Interoperability July 18-19, 2013, Barcelona, Spain
Figure 1. Block diagram of the operations executed during the spectrum sensing stage.
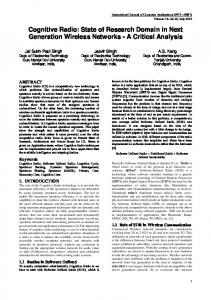
Figure 2. Effect of the trace smoothing. The original PSD has been acquired considering a SNR equal to 5 dB. applying a moving average filter to the incoming trace. The choice to use this kind of filter is due to its simple implementation and its ability to reduce random noise while retaining a sharp step response (see figure 2). In this paper two popular nonparametric power spectrum estimation methods (modified periodogram [10] and Welch’s method [11]) are investigated in order to simplify the spectrum sensing stage, especially in terms of overall computational burden, and at the same time without worsening the algorithm performance. II. A brief theoretical background Several PSD estimation methods are available in scientific literature. Usually they can be classified in two main categories: nonparametric and parametric estimation methods. In this paper only the former category has been taken into account and in particular two methods have been considered: modified periodogram [10] and Welch method [11], respectively. In the following a brief theoretical background of these methods is given. A. Modified periodogram method Considering a finite-length sample set of the acquired signal x(0),…, x(N-1), the original unmodified periodogram PSD estimate can be defined as 2
2
N 1 1 T N 1 (1) TS x n e j 2 fnTS S x n e j 2 fnTS NTS N n 0 n 0 , where TS is the sampling time, f stands for the frequency and N is the length of the set. Usually a finite-length sample set can be seen as the result of multiplying an infinite sample set with a N-length rectangular window wR(n). The multiplication in the time domain corresponds to convolution in frequency domain leading consequently in spectral leakage issues. To mitigate these effects the modified periodogram has been introduced in literature and it is defined in this way:
Sx f
2
2
N 1 1 T N 1 (2) Sx f TS w n x n e j 2 fnTS S w n x n e j 2 fnTS NTS N n 0 n 0 . It windows the time domain signal in order to smooth the edges of the signal with a N-length window w(n). This operation leads to a reduction of the spectral leakage. In literature several windows have been defined to reach this goal and they differ for their spectral characteristic especially in terms of side-lobe levels and main-lobe width [12],[13].
B. Welch’s method A known issue of the modified periodogram method consists that it is characterized by an high estimates variance. A classical way to reduce this variance consists in averaging different independent estimates. Starting from this consideration Welch in [11] proposed a new PSD estimation method based on the division of finitelength sample set of the acquired signal into smaller units called segments. They are composed by L samples and may be overlapped or disjoint. As in the modified periodogram method, the samples in a segment are weighted through a window function to reduce undesirable effects related to spectral leakage. For each segment a
ISBN-10: 84-616-5438-2 | ISBN-13: 978-84-616-5438-3
544
19th Symposium IMEKO TC 4 Symposium and 17th IWADC Workshop Advances in Instrumentation and Sensors Interoperability July 18-19, 2013, Barcelona, Spain
periodogram is evaluated following this formula: 2
TS L1 (3) w n xi n e j 2 fnTS , LU n 0 where xi(n) are the samples of the i-th segment and U is a coefficient used to remove the window effect from the total signal power and it is given by S xi f
1 L1 2 w n . L n 0 The PSD estimate Sx(f) is computed by averaging the periodogram estimates U
1 k 1 i Sx f k i 0 where k denotes the number of segments and it is given by Sx f
(4)
(5)
N L (6) 1 LM , M denotes the number of the overlapped samples between two successive segments. Overlap ratio r is defined as the ratio between the number of the overlapped samples and the number of samples in a segment, r=M/L*100%. It is worth noting that the performance of the modified periodogram method is influenced by the window w(n) used, and the performance of the Welch method depends by the window w(n) and the overlap ratio r considered. k
III. Measurement set-up In order to verify the applicability of the above-mentioned PSD estimation methods to the proposed spectrum sensing stage and assess their performance, a suitable experimental campaign, carried out in Matlab simulation environment, has been designed and set-up. A scenario in which a CR transceiver is scanning a frequency interval where a primary user (PU) occupies the 17% of the frequency interval under analysis has been taken into account. In particular, the carrier frequency of the PU is located in the center of the frequency interval under analysis. Seven different SNRs, ranging from 5 dB to -25 dB, with a step equal to -5 dB, have been considered and for each SNR, 1000 different realizations of the test signal have been simulated. As the modified periodogram method concerns, four different windows, w(n), have been considered: Flat top, Hamming, Blackman-Harris, Bartlett-Hanning. The same windows have been taken into account for the Welch method and, in this case, for each window, also 9 different overlap ratios r ranging from 10% to 90%, with a step of 10%, have been considered. Each configuration of the above-mentioned PSD estimation methods has been applied to all the simulated signals in order to evaluate the PSD of the incoming signal. Each estimated PSD is 2401 bins-length. Several figures of merit have been defined to analyse the applicability of the above-mentioned PSD estimation methods and assess their performance: i) No detection bandwidth rate () evaluated as the ratio between the number of times that the proposed method has not been able to detected an occupied bandwidth and the total number of test (i.e. 1000). It is expressed in percentage. This figure of merit has been designed to verify the ability of the proposed method to detect signals in very noisy environment. ii) False detection () calculated using the following relation:
1 Nd Bi (8) 100% , N d i 1 B free where Nd is the number of times that the proposed method has detected at least one occupied bandwidth, Bi is the sum of the frequency bins that overcome the selected threshold in the frequency interval, Bfree is the frequency interval that is not presently occupied by the PU. Bfree is evaluated as the frequency interval under analysis minus the PU bandwidth. This figure of merit has been designed to test the ability of the proposed method to detect only the bandwidth occupied by the PU. As an example, figure 3 reports two false detections provided by the method when it was applied to a signal characterized by a SNR equal to -15 dB is shown. iii) The difference between the mean value of the detected minimum frequency component of the PU signal and its imposed value, which are considered as reference, f1,mean, and the difference between the mean value of the detected maximum frequency component of the PU signal and its imposed value, which is considered as reference, f2,mean. In order to have a good evaluation of the position occupied by the PU in the frequency
ISBN-10: 84-616-5438-2 | ISBN-13: 978-84-616-5438-3
545
19th Symposium IMEKO TC 4 Symposium and 17th IWADC Workshop Advances in Instrumentation and Sensors Interoperability July 18-19, 2013, Barcelona, Spain
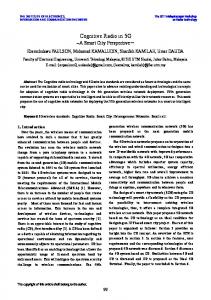
Figure 3. Output of the spectrum sensing stage showing two false detections. The SNR of the input signal was 15 dB. The modified periodogram estimator is involved.
Figure 4. Error committed during the estimation of PU bandwidth. The SNR of the input signal was 15 dB. The modified periodogram estimator is involved.
interval under analysis, it is very important to detect correctly the minimum (f1) and the maximum (f2) frequency components of PU. This figure of merit has been designed to test this feature. In figure 4 an example of f1 and f2 evaluation is shown. In particular f1,e and f2,e are the estimated PU minimum and maximum frequency component respectively. To analyse the suitability of the trace smoothing step (see figure 1) when the proposed PSD estimators are applied, all the above-mentioned figures of merit have been evaluated considering two cases. In the former the PSD trace smoothing operation has not been performed, in the latter it has been carried out. IV. Performance assessment Figures 5 (a) and (b) report the experienced values of for different windows w(n) and SNRs, for both cases in which the PSD trace smoothing is applied and without PSD trace smoothing, respectively. PSD are estimated by using the modified periodogram. Analyzing the obtained results it is possible to highlight: a) The trace smoothing operation greatly improves the performance of the proposed method. In fact when this operation is performed, it is possible to observe a significant decrement of values even at very lower SNRs. As a consequence a trace smoothng is necessary. b) A no detection rate equal to 0 is experienced down to SNR=-10 dB for all the considered windows. c) The Flat top window seems the best considering this figure of merit. As far as the Welch estimator, for a sake of brevity, only the results obtained considering an overlap ratio, r=50%, are reported in this paper (see figure 6). The obtained result considering different overlap ratios are very similar.
(a) (b) Figure 5. Miss detection rate analysis for different windows w(n) and SNRs, (a) PSD trace smoothing applied, (b) no PSD trace smoothing. The modified periodogram estimator has been applied.
ISBN-10: 84-616-5438-2 | ISBN-13: 978-84-616-5438-3
546
19th Symposium IMEKO TC 4 Symposium and 17th IWADC Workshop Advances in Instrumentation and Sensors Interoperability July 18-19, 2013, Barcelona, Spain
Figure 6. No detection rate analysis for different windows w(n) and SNRs. The Welch estimator and PSD trace smoothing have been applied. An overlap ratio r=50% has been considered. Analysing the results reported in figure 6 it is possible to highlight that they are very similar to that obtained with the modified periodogram and consequently all the above-mentioned consideration are still valid for this PSD estimator. Regarding the false detection figure of merit, the obtained results when the modified periodogram method and the Welch method are reported in table I and table II. Analysing them it is possible to highlight that: 1) Both the considered methods show good results. In particular the modified periodogram seems to show slightly better results with except for the lowest SNR. 2) The Flat top window shows the best performance for all the considered PSD estimation methods. Other overlap values considered for the Welch method have shown very similar results and as a consequence there are not reported in the paper. Figures 7 (a) and (b) depict the obtained values of f1,mean when the modified periodogram estimator and the Welch estimator are respectively involved. They show that both the estimators present a good behaviour, especially for SNR down to -15 dB, but the results obtained when the modified periodogram is involved are slightly better. The Flat top windows allows a good estimation of the minimum frequency component of the PU signal except at SNR=-20 dB where the best performance are given by the Hamming window. As expected, when the SNR of input signal decreases, f1,mean worsens. Similar results have been found made for f2,mean, therefore, for a sake of brevity, the corresponding analyses are not reported . V. Conclusion The paper has analysed the performance of two known non parametric PSD estimation methods (modified periodogram and Welch) applied for the spectrum sensing stage in CRs. To assess the performance of the above-mentioned PSD estimation methods, suitable figures of merit have been
w(n)
Table I. False detection analysis for different windows w(n) and SNRs. The modified periodogram and PSD trace smoothing have been applied. SNR 5 dB 0 dB -5 dB -10 dB -15 dB -20 dB -25 dB Flat top 0% 0% 0% 0.0056% 6.2% 13% 9.5% Hamming 0% 0% 0% 0.28% 9.7% 0.48% 0.039% Blackman-Harris 0% 0% 0% 0.039% 9.0% 6.4% 1.9% Bartlett-Hanning 0% 0% 0% 0.22% 10% 0.97% 0.20%
w(n)
Table II. False detection analysis for different windows w(n) and SNRs. The Welch PSD estimator with r=50% and PSD trace smoothing have been applied. SNR 5 dB 0 dB -5 dB -10 dB -15 dB -20 dB -25 dB Flat top 0% 0% 0% 0.013% 6.4% 14% 8.8% Hamming 0% 0% 0% 0.31% 9.6% 0.43% 0.043% Blackman-Harris 0% 0% 0% 0.053% 9.0% 6.0% 2.1% Bartlett-Hanning 0% 0% 0% 0.25% 10% 0.97% 0.085%
ISBN-10: 84-616-5438-2 | ISBN-13: 978-84-616-5438-3
547
19th Symposium IMEKO TC 4 Symposium and 17th IWADC Workshop Advances in Instrumentation and Sensors Interoperability July 18-19, 2013, Barcelona, Spain
(a) (b) Figure 7. f1,mean analysis for different windows w(n) and SNRs, (a) the modified periodogram estimator (b) Welch method have been applied. defined and analysed through a large experimental campaign performed in Matlab simulation environment. The obtained results show that both the considered PSD estimation methods have shown good performance, even if the modified periodogram behaviour seems slighter better that Welch method ones. In particular, it is possible to highlight that the flat top windows allows to get a good trade-off between a good detection of the minimum and the maximum frequency components of the PU and contemporary a limitation of the false alarm occurrences. References [1] Federal Communications Commission, “Spectrum Policy Task Force Report ET Docket No. 02-135”, Nov. 2002. [2] J. Mitola, G. Q. Maguire, “Cognitive radio: making software radio more personal,” IEEE Personal Communications, vol. 6, N. 4, pp. 13-18, Aug. 1999. [3] Federal Communications Commission, “NPRM and Order: Facilitating Opportunities for Flexible, Efficient, and Reliable Spectrum Use Employing Cognitive Radio Technologies, FCC-03-322”, Dec. 2003. [4] L. De Vito, “A review of wideband spectrum sensing methods for Cognitive Radios,” in proc. of I2MTC 2012, Graz, Austria, 13-16 May 2012, pp. 2257-2262. [5] L. Angrisani, D. Capriglione, L. Ferrigno, G. Miele, “A New Digital Signal Processing Method for Spectrum Interference Monitoring,” Measurement Science Review, vol. 11, N. 1/2011, pp. 1-8, Jan. 2011. [6] L. Angrisani, D. Capriglione, L. Ferrigno, G. Miele, “A FPGA-based Instrument for Power Measurement in DVB-T Systems,” Measurement, vol. 45, N. 5; pp. 1039-1050, Jun. 2012. [7] L. Angrisani, D. Capriglione, L. Ferrigno, G. Miele, “Power measurements in DVB–T systems: on the suitability of parametrical spectral estimation in DSP–based meters,” IEEE Transactions on Instrumentation and Measurement, vol. 58, N. 1, pp. 76-86, Jan. 2009. [8] L. Angrisani, D. Capriglione, L. Ferrigno, G. Miele, “Power measurements in DVB–T systems: new proposals for enhancing reliability and repeatability,” IEEE Transactions on Instrumentation and Measurement, vol. 57, no. 10, pp. 2108-2117, Oct. 2010. [9] L. Angrisani, D. Capriglione, L. Ferrigno, G. Miele, “A Measurement Algorithm for Frequency Agility in Cognitive Radio,” in proc. of IEEE International Instrumentation and Measurement Technology Conference 2013, Minneapolis, USA, 6-9 May 2013, pp. 371-376. [10] P. Stoica, R.L. Moses, “Introduction to Spectral Analysis”, Prentice-Hall, New Jersey, USA, 1997. [11] P. D. Welch, “The Use of Fast Fourier Transform for the Estimation of Power Spectra: A Method Based on Time Averaging Over Short, Modified Periodograms,” IEEE Trans. Audio Electroacoustics, vol. AU-15, pp.70-73, Jun. 1967. [12] F.J. Harris, “On the Use of Windows for Harmonic Analysis with the Discrete Fourier Transform.” Proceedings of the IEEE, vol. 66, pp. 51-83, Jan. 1978. [13] A.V. Oppenheim, R.W. Schafer, “Discrete-Time Signal Processing”, Pearson, New Jersey, USA, 2010.
ISBN-10: 84-616-5438-2 | ISBN-13: 978-84-616-5438-3
548