PTEP: The Parallel Telemetry Processor Jeffrey S. Norris, Paul G. Backes, Eric T. Baumgartner
[email protected],
[email protected],
[email protected] Jet Propulsion Laboratory California Institute of Technology 4800 Oak Grove Drive Pasadena, CA 91109 Abstract—The Parallel Telemetry Processor (PTEP), a highspeed, robust, and extensible telemetry processing system is discussed in this paper. The system, written in Java, provides a multithreaded task-dispatching framework for downlink processing that allows existing data processing applications to be easily integrated into the processing pipeline. The system provides users with a color-coded flowchart that indicates the progress of packets through the system and displays intermediate data products as they are generated. Packets that cause processing errors are stored in an error queue for later review while the system continues to process new packets. PTEP currently processes telemetry from 7 different instruments on the FIDO prototype Mars rover at JPL, including multiple stereo cameras, a spectrometer, and a microscope. PTEP generates 21 science data products (5 megabytes of data) for every stereo image pair taken by the rover. Throughput is approximately 2 packets per minute, making it possible to process an entire downlink from the rover in minutes. TABLE OF CONTENTS 1. 2. 3. 4. 5.
INTRODUCTION SPECIFICATION OF SYSTEM REQUIREMENTS DESIGN AND OPERATION OF PTEP SYSTEM PERFORMANCE RESULTS CONCLUSIONS
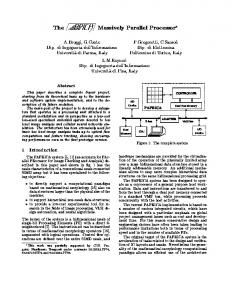
1. INTRODUCTION The speed at which data received from a planetary rover or lander can be processed into final science data products has a direct impact on the overall efficiency of robotic planetary exploration mission operations. An efficient and reliable downlink processing system effectively lengthens the amount of productive planning time that is available to the operations team for the design of each sequence sent to the spacecraft. Multithreaded and pipelined downlink processors greatly improve performance by minimizing the idle time of the processing platform’s slowest resources (typically the network and storage devices) and making use of additional CPU’s on multiprocessor computers. In addition, fault tolerant downlink processing systems minimize downtime in mission operations. PTEP, the Parallel Telemetry Processor, was designed and built to process all of the data received from the 7 instruments on the FIDO prototype Mars rover [1]. Several of the data products produced by PTEP are shown in figure
Figure 1 - A few of the data products that PTEP generates. From top, left to right: image with elevation overlay, overhead elevation view, color balanced image, stereo anaglyph image, color micro-imager image, infrared point spectrometer data plot. 1. PTEP is capable of processing an arbitrary number (typically 3-4) of downlink packets from the rover simultaneously, and automatically takes advantage of all of the physical processors available on the machine. PTEP provides its user with a graphical monitoring interface that illustrates the steps in the downlink processing pipeline and indicates the status of each packet currently being processed. When processing errors occur, the affected packets are moved into an error queue for later review while processing of arriving packets continues. At any time, a user can access detailed information about a processing error, correct the problem, and resume processing of the packet. Below, the requirements that were established for a reliable high-speed downlink processing system during the development of PTEP are outlined, followed by a detailed description of the design and operation of the system. System performance data is included in the fourth section,
and suggestions for further work are discussed at the end of the paper.
2. SPECIFICATION OF SYSTEM REQUIREMENTS During the design of PTEP, several requirements were generated. The goal of these requirements is to define standards for the evaluation of existing and future downlink processing system designs. The requirements fall into 4 categories: performance, fault tolerance, interactivity, and extensibility. Performance Simply put, the downlink system should process data quickly, and take advantage of all of the resources on the processing computer. Pipelining (starting a series of processing steps on a second packet before the last steps are complete for the first packet) and parallelization (taking advantage of multiple processor machines) are two techniques that can greatly increase the performance of a downlink processing system. In a typical downlink processing application, the performance-limiting resource is the permanent storage device where downlink data products are being saved. Pipelined and parallel architectures improve the overall performance of the system by keeping this limiting resource in use as much as possible and allowing one packet to use the computer’s CPU while another is waiting for a disk transfer to complete. Fault Tolerance Since downlink processing systems often run unattended, the principal goal for a fault tolerant downlink processing system is to handle any problems in a way that allows the system to continue processing newly received packets if at all possible. To this end, when the processing system encounters a corrupt data packet or an error occurs in processing, the problem should be handled gracefully. If the problem can be localized to a particular data packet, the system should isolate that packet and continue to process others if possible. This minimizes downtime and removes the necessity for an administrator to constantly monitor the system. When an error occurs, any information related to that error should be stored for later review by the user. After the error has been assessed and corrected, the user should be able to continue the processing of the packet or remove it from the queue entirely. Interactivity The user should be able to monitor the status of all packets being processed, access detailed information about errors, and modify parameters during processing. As a packet passes through successive processing stages, the user should
be able to view intermediate data products in order to evaluate the progress of a packet through the system. Extensibility It should be straightforward to modify the system to support new instruments and processing steps. Mission science team members often develop their own processing applications for data from a particular instrument, and the downlink processing system should allow these applications to be easily integrated into the processing pipeline. This extensibility should not compromise the overall stability of the system- if the new processing application generates an error, the system should handle it gracefully.
3. DESIGN AND OPERATION OF PTEP Data processing in PTEP is accomplished using virtual processors. PTEP can be configured to have any number of virtual processors, regardless of the number of physical processors on the processing computer. When data arrives from a robot, PTEP assigns the data to an available virtual processor. That virtual processor is then responsible for advancing the data through all of its required processing steps and handling any errors that occur. When the processor successfully finishes processing the data or arrives at an error condition that requires user intervention, it saves the data and indicates to the system that it is free to process new data. PTEP usually uses 3-4 virtual processors when supporting operation of the FIDO (Field Integrated Design and Operations) rover. The progress of data from the FIDO rover through PTEP is shown in figure 2. When FIDO acquires data using one of its instruments, it packages the data into a discrete “packet” and transmits it back to the operations center. PTEP detects the new packet when it arrives and places it into the input queue, along with other packets that are waiting to be processed. The packet waits in the input queue until all of the packets that arrived before it have been processed and a virtual processor becomes available. PTEP then assigns the packet to the available virtual processor, which removes it from the input queue and begins processing the data. The virtual processor begins processing the packet by determining which instrument produced the data. When the packet type has been determined, the virtual processor begins applying the necessary processing steps for that packet type. For example, images taken by the front hazard cameras on FIDO are processed to produce range maps, synthetic overhead images, 3D triangle meshes, camera models, and numerous JPEG image products that help operators of the FIDO rover to visualize terrain elevation, slope, and range map confidence. Data from FIDO’s Infrared Point Spectrometer (IPS) is plotted and stored for later processing by the FIDO science team. These products are stored in a structured database used by The Web
Data Packet acquired by robot Waiting for transfer Packet transmitted to mission operations center Waiting for free virtual processor in input queue
User requests re-processing of packet
Error corrected by user, packet restarted
Free processor assigned to packet
Processing
Error occurred during processing
Waiting for user intervention in error queue
Processing completed successfully Completed Data viewed by operations tools Figure 2 - The life cycle of a packet in PTEP Interface for Telescience (WITS), the FIDO rover operations tool [2]. If a virtual processor encounters an error while processing a packet, it moves the packet into the error queue. If possible, it stores information describing the nature of the error and the step in the processing pipeline where the problem occurred. Once the packet has been stored in the error queue, the virtual processor is free to begin processing a new packet. The packet that generated the error remains in the error queue until a user reviews the error and either instructs the system to restart processing of the packet or deletes the packet from the system. When a virtual processor successfully finishes processing a data packet, it moves the packet to an archive of all successfully processed packets. A user can later choose to retrieve a packet from this archive for further processing or clear the packet from the archive when it is no longer needed. The data products produced during processing are then made available to the rover’s operations tools.
starts at the top of the flowchart and moves downwards through the processing steps for its instrument type. The flowchart is built automatically at runtime, and automatically reflects changes made to the processing code for a packet. Each packet currently being processed by a virtual processor is represented as a colored triangle. As a packet moves through its processing steps, its arrow moves through the corresponding boxes on the processing flowchart. In figure 3, the yellow triangle corresponds to virtual processor 1, and is shown in the “Write Anaglyphs” step of the “Hazcam/Bellycam” instrument flow. Directly below the processing flowchart are four slots that display the latest intermediate data product produced by a virtual processor. Each slot is bracketed by colored bars that correspond to the colored triangles in the processing flowchart. The first picture in this row is the last intermediate product produced by virtual processor 1, which corresponds to the yellow triangle in the processing flowchart. These intermediate data products allow a user to monitor a virtual processor’s progress and quickly diagnose errors.
PTEP’s Graphical Monitoring Interface Throughout the above procedure, PTEP provides a graphical interface to the user that shows the contents of the packet queues, as well as status of each packet currently being processed. A screenshot of PTEP’s user interface is shown in figure 3. The top half of PTEP’s interface is devoted to the processing flowchart, which describes the processing steps that are applied to each packet type. Each packet
Below the intermediate data product section are the input and error queues. The input queue shows packets that have either recently arrived from the rover or have been manually inserted by the user using the “Add” button. New items added appear at the bottom of this list. The user can modify the order of items in the list to force particular packets to be processed before others. This allows a user to manually prioritize particular instruments or packets.
Yellow Processor Progress Indicator
Instruments
Instrument Processing Steps Processing Flowchart
Yellow Processor Intermediate Data Product
Intermediate Data Products
Packet Queues
Input Queue
Figure 3 - PTEP’s graphical user interface
Error Queue
Time to process 5 packets with varying numbers of virtual processors Number of virtual processors
The error queue holds all of the packets that generated an error during processing. If the user highlights one of these packets and clicks the “Details” button, a window is displayed describing the nature of the error. While this window is visible, a red arrow appears on the processing flowchart indicating the step at which the error occurred. These features allow the user to quickly ascertain the nature and location of the problem. When the user believes he has corrected the problem, he can click the “Retry” button. This moves the packet from the error queue to the input queue for reprocessing.
152
3 2
208
1
363 0
100
200
300
400
Processing time (seconds)
Extending PTEP
Figure 4 - Processing Time
In the FIDO rover task, PTEP is often expected to accommodate modifications in the processing pipeline. These modifications typically take the form of adjustments to existing steps, the addition of new steps, or operations in support of other downlink processing systems. Several characteristics of PTEP’s design make these modifications straightforward.
efficiency. This significant increase in performance occurs because the processing operations on a single packet must occur in a serial fashion, forcing the system to wait for a step to complete before beginning the next. For this reason downlink processing is an excellent domain for multithreaded software.
First, the processing flowchart in PTEP’s graphical monitoring interface is built automatically at runtime. When a new step is added in PTEP’s source code, the programmer includes standardized expressions at the beginning and end of the step that allow PTEP to update the flowchart and track errors that occur during that step.
A clarifying explanation for this increase in performance is illustrated in figure 5. This chart shows the average number of disk transfers per second made during the processing of the 5 packets. On one hand, it’s unsurprising that there is a higher rate of disk transfers in the cases with more processors since the same processing operations are completed in a shorter amount of time with more virtual processors (as was indicated in the prior table). However, what is important to note is that in the single processor case the computer’s disk is clearly vastly underutilized. Since the computer’s disk is the typically the bottleneck in a downlink processing system, changes that bring it closer to 100% utilization generally drive the system to optimum performance.
4. SYSTEM PERFORMANCE RESULTS This section provides a brief discussion of typical performance achieved running PTEP on a Sun UltraSparc 80 with 4 processors. The data was acquired using the “perfmon” utility running on a separate machine. The three charts in this section each illustrate different performance characteristics with PTEP configured to use a varying number of virtual processors (see the previous section for a description of virtual processors). Since PTEP is written in Java, is uses the Java virtual machine to automatically map the processing work across all of the available physical processors, regardless of the number of virtual processors that PTEP is configured to use. Figure 4 shows the amount of time required to process 5 navcam stereo packets from the FIDO rover into final science products. PTEP generates 21 science data products from each packet (about 5 megabytes of data). It is very important to note that even in the single virtual processor case, PTEP is attempting to use all four physical processors on the computer to process the data. Clearly, adding additional virtual processors greatly improves processing
Disk transfers per second with varying numbers of virtual processors Number of virtual processors
Second, although PTEP is written in Java, it has a standardized interface to external programs written in any language. A planned enhancement to PTEP will allow a user to add steps using external programs without any modification to PTEP’s source code. This will allow a user to modify the processing pipeline at runtime.
3
16.53
2
13.89
1 0.00
10.36 5.00
10.00
15.00
20.00
Average disk transfers per second
Figure 5 - Disk Utilization The benefit of PTEP’s multithreaded virtual processor architecture is perhaps shown most clearly in figure 6. This figure shows physical processor utilization during the processing of 5 packets, with three different plots representing the 1, 2, and 3 virtual processor cases. Note that the in the single processor case, the utilization of the physical processors of the machine never exceeds 50%,
Physical processor utilization (percent)
Physical processor utilization with varying numbers of virtual processors 100
3 virtual processors 80
2 virtual processors
60
1 virtual processor
40 20 0 1
26
51
76
101
126
151
176
201
226
251
276
301
326
351
time (in seconds)
Figure 6 - Physical Processor Utilization even though PTEP is attempting to fully utilize all of the processing capability of the machine. Without this data, an external observer might decide that a legitimate way to increase the performance of the single virtual processor downlink processor would be to simply add more processing power to the system. Clearly, this would not result in a large increase in performance since the single processor system is already far from fully utilizing the system. In the 2 and 3 virtual processor cases, PTEP comes much closer to making use of the full processing potential of the computer.
5. CONCLUSIONS Several multithreading techniques have been shown to vastly improve the efficiency of downlink processing, even on machines with relatively few processors. PTEP has demonstrated these improvements by greatly reducing the downlink processing turnaround time of the FIDO rover operations team. Some of PTEP’s critical innovations lie in its automatically constructed graphical monitoring interface. This interface could be easily adapted to monitor any complex process. Its error tracking features would make it ideal for any serial process composed of heterogeneous tasks. Two areas have been identified as areas for potential enhancements to PTEP. First, PTEP’s support for processing applications written in another language could be enhanced to allow the addition of these steps without modification to PTEP’s source code. If these external programs were accompanied by a configuration file defining their parameters, inputs, and outputs, PTEP could allow a user to graphically connect several of these steps together without requiring the user to manually specify these values. Potentially, adapting PTEP to a new task would require no new coding at all- a user would simply collect the necessary
processing applications and instruct PTEP when to use them. Another interesting area for future research would be to allow PTEP to monitor the load on the computer in real time, dynamically adding and deleting virtual processors from the system in an effort to maintain 100% utilization of the computer’s resources. This could also be used to prevent PTEP from taking all of the computer’s resources if the computer is supporting other tasks.
ACKNOWLEDGEMENTS The research described in this paper was carried out at the Jet Propulsion Laboratory, California Institute of Technology, under a contract with the National Aeronautics and Space Administration.
REFERENCES [1] E. T. Baumgartner, "In-Situ Exploration of Mars using Rovers," Proceedings of the AIAA Space 2000 Conference, AIAA Paper# 2000-5062, Long Beach, CA, September 2000. [2] Paul Backes, Jeffrey S. Norris, Jeffrey Slostad, Robert Bonitz, Kam Tso, and Greg Tharp, “Mars Polar Lander Mission Distributed Operations,” IEEE Aerospace 2000, March 2000. Jeff Norris is a computer scientist and member of the technical staff of the Autonomy and Control Section at the Jet Propulsion Laboratory. At JPL, his work is focused in the areas of distributed operations for Mars rovers and landers, secure data distribution, and science data visualization. Jeff is a member of the ground data systems
and operations teams for the 2003 Mars Exploration Rover Mission, and is contributing to the development of the rover command software suite. He received his Bachelor’s and Master’s degrees in Electrical Engineering and Computer Science from MIT. While an undergraduate, he worked at the MIT Media Laboratory on data visualization and media transport protocols. He completed his Master’s thesis on face detection and recognition at the MIT Artificial Intelligence Laboratory. He now lives with his wife, Kamala, in Azusa, California. Eric Baumgartner is a group leader in the Mechanical and Robotics Technology Group and a senior member of engineering staff in the Science and Technology Development Section at JPL. At JPL, Dr. Baumgartner serves in a systems engineering capacity for the development of advanced planetary rovers and also contributes to technology developments in the area of robotic sensing and control. He has recently joined the flight rover program at JPL and will contribute to the development of twin Mars Exploration Rovers that will land on the Martian surface in 2004. Previous to joining JPL, he was an Assistant Professor in the Mechanical Engineering Department at Michigan Technological University in Houghton, Michigan. In addition to his work at JPL, Dr. Baumgartner also continues his teaching duties by instructing a design course at the University of California, Los Angeles (UCLA). Dr. Baumgartner received his B.S. degree in Aerospace Engineering from the University of Notre Dame in 1988, the M.S. degree in Aerospace Engineering from the University of Cincinnati in 1990, and the Ph.D. degree in Mechanical Engineering from the University of Notre Dame in 1992. Paul Backes is a technical group leader in the Automomy and Control section at the Jet Propulsion Laboratory, Pasadena, CA, where he has been since 1987. He received the BSME degree from U.C. Berkeley in 1982, and MSME in 1984 and Ph.D. in 1987 in Mechanical Engineering from Purdue University. He is currently responsible for distributed operations research for Mars lander and rover missions at JPL. Dr. Backes received the 1993 NASA Exceptional Engineering Achievement Medal for his contributions to space telerobotics (one of thirteen throughout NASA), 1993 Space Station Award of Merit, Best Paper Award at the 1994 World Automation Congress, 1995 JPL Technology and Applications Program Exceptional Service Award, 1998 JPL Award for Excellence and 1998 Sole Runner-up NASA Software of the Year Award. He has served as an Associate Editor of the IEEE Robotics and Automation Society Magazine.