Most biological scientists have been introduced to the frequentist approach to statistical ... Often, the frequentist and Bayesian definition of probability align; the ...
PyDREAM: High-dimensional parameter inference for biological models in Python
Supplemental Material
Contents 1 Background 1.1 Introduction . . . . . 1.2 Bayesian Statistics . 1.3 Markov Chain Monte 1.4 Algorithm Details . .
. . . . . . . . . . . . . . . . . . . . Carlo (MCMC) . . . . . . . . . .
2 Detailed Biological Example 2.1 Introduction . . . . . . . . . . . . 2.2 COX-2 Reaction Model (CORM) 2.3 Experimental Data . . . . . . . . 2.4 Experimental Rates . . . . . . . 2.5 Thermodynamic Constraints . . 2.6 Specifying Priors . . . . . . . . . 2.7 Specifying a Likelihood Function 2.8 Posterior Distributions . . . . . .
. . . . . . . .
. . . . . . . .
. . . . . . . .
. . . .
. . . .
. . . .
. . . .
. . . .
. . . .
. . . .
. . . .
. . . .
. . . .
. . . .
. . . .
. . . .
. . . .
. . . .
. . . .
. . . .
. . . .
. . . .
. . . .
. . . .
. . . .
. . . .
. . . .
. . . .
. . . .
1 1 1 3 4
. . . . . . . .
. . . . . . . .
. . . . . . . .
. . . . . . . .
. . . . . . . .
. . . . . . . .
. . . . . . . .
. . . . . . . .
. . . . . . . .
. . . . . . . .
. . . . . . . .
. . . . . . . .
. . . . . . . .
. . . . . . . .
. . . . . . . .
. . . . . . . .
. . . . . . . .
. . . . . . . .
. . . . . . . .
. . . . . . . .
. . . . . . . .
. . . . . . . .
. . . . . . . .
. . . . . . . .
. . . . . . . .
. . . . . . . .
6 6 6 7 8 8 9 9 10
3 Practical Advice for MCMC Analysis 10 3.1 Considerations for Priors . . . . . . . . . . . . . . . . . . . . . . . . . . . . . . . . . . 10 3.2 Considerations for Likelihood Functions . . . . . . . . . . . . . . . . . . . . . . . . . 11 3.3 Considerations for Assessing Convergence . . . . . . . . . . . . . . . . . . . . . . . . 11 4 Installation
12
5 Implementation
12
6 Test Case Performance 13 6.1 10D Bimodal Mixture Model . . . . . . . . . . . . . . . . . . . . . . . . . . . . . . . 13 6.2 200D Multivariate Normal . . . . . . . . . . . . . . . . . . . . . . . . . . . . . . . . . 13
i
7 PyDREAM Usage 7.1 Specifying Parameter Priors . . . . . . . 7.2 Defining a Likelihood Function . . . . . 7.3 Sampling . . . . . . . . . . . . . . . . . 7.4 Examples . . . . . . . . . . . . . . . . . 7.4.1 Mixture Model . . . . . . . . . . 7.4.2 200-dimensional Gaussian . . . . 7.4.3 Robertson Model . . . . . . . . . 7.4.4 COX-2 Reaction Model (CORM)
. . . . . . . .
. . . . . . . .
. . . . . . . .
. . . . . . . .
. . . . . . . .
. . . . . . . .
. . . . . . . .
. . . . . . . .
. . . . . . . .
. . . . . . . .
. . . . . . . .
. . . . . . . .
. . . . . . . .
. . . . . . . .
. . . . . . . .
. . . . . . . .
. . . . . . . .
. . . . . . . .
. . . . . . . .
. . . . . . . .
. . . . . . . .
. . . . . . . .
. . . . . . . .
. . . . . . . .
. . . . . . . .
15 16 16 18 18 18 18 19 19
8 Algorithm Options
19
9 Support
20
1 1.1
Background Introduction
PyDREAM provides access to a Python-based version of the DREAM(ZS) and MT-DREAM(ZS) algorithms. As described in the main text, both algorithms use a Markov Chain Monte Carlo (MCMC) chain to generate inferred Bayesian posterior distributions for fitted model parameters. In the background information below, we provide an informal, tutorial-style approach to Bayesian inference (section 1.2) and MCMC (section 1.3), some practical advice for using MCMC (section 3), and detailed pseudocode for the DREAMZS algorithm (section 1.4).
1.2
Bayesian Statistics
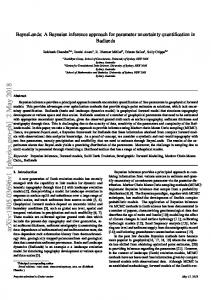
Most biological scientists have been introduced to the frequentist approach to statistical analysis. PyDREAM provides access to an efficient algorithm that uses Bayesian statistical inference. In what follows we provide a short introduction to Bayesian statistical methodology and refer the novice user to further didactic material. Likelihood
Bayesian
Flight Data
Frequentist
Flight Data
Prior
+
Prior
+
Past Experience
Figure 1: Predicting a Flight Delay
Prediction
Prediction
The first step in our introduction is to consider the definition of ”probability” in frequentist and Bayesian statistics. In a frequentist context, the probability that a particular event will take place is interpreted as the frequency of that event over a set of observations (hence the name frequentist). For example, from the frequentist perspective, the probability that a flight will be delayed is the proportion of delayed flights relative to all flights in a given time range. In a Bayesian context, probability is instead defined as a measure of belief or confidence that a given event will take place. Often, the frequentist and Bayesian definition of probability align; the Bayesian concept of prior belief is particularly powerful when data is sparse. A didactic example concerning airport flight delays may clarify the concept (see Figure 1). If an individual has no prior experience flying out of a particular airport, then a reasonable way for that person to determine their belief that their flight will be delayed would be to analyze the frequency of delayed flights from that airport in the past year (the frequentist approach, Figure 1, top). If flight data for similar days is available, this will likely provide a good prediction. However, if the day is unusual when compared to past days, the prediction may not be very accurate. Bayesian inference is most useful in situations where the available data is sparse. The alternative (Bayesian) approach would be to incorporate prior knowledge into the probability estimate. Suppose the person has flown out of this airport ten times in the past year and experienced a delay every time. In addition, it is a rainy day, making flight delays seem more likely (Figure 1, bottom). With that prior knowledge, the individual would have a greater expectation of a delayed flight. Different individuals can have different prior beliefs because different individuals can have different prior knowledge they use to generate predictions. Importantly, an inaccurate prior belief can be ”washed out” by enough conflicting data. For example, if very few flight delays have occurred on rainy days at this airport in the past, and if enough flight data is available to indicate this, then even if an individual has a high prior belief that there will be a flight delay, the actual probability of a flight delay will still be small. The overarching goal of Bayesian inference is to calculate the posterior probability, that is, the probability of an occurrence (e.g. a delayed flight) given both the prior probability of that event (e.g. prior experience at an airport and knowledge of delay history) and the likelihood of observing the available data (e.g. the frequency of flight delays from the airport) given a particular probability of delayed flights. The relationship between these terms is defined mathematically as: π(θ)L(D|θ) π(θ)L(D|θ) dθ θ
π(θ|D) = R
(1)
where π(θ|D) is the posterior probability of an event θ after observing the data, D, π(θ) is the prior probability of the event θ before observing any data, and L(D|θ) is the likelihood , the probability of observing the data D if θ were true. The denominator in Equation (1) is termed the evidence, and is often computationally intensive to calculate. Fortunately, when only a single model is being studied, the evidence can be treated as a normalizing constant. We refer the novice user to a more in-depth introduction to Bayesian methods found in reference [1]. Occasionally, the posterior probability can be calculated analytically. More often, such as when θ is a high-dimensional vector, analytical solutions become intractable, and numerical approximations must be used. In this case, a suitable method to calculate posterior probabilities is to apply the Markov Chain Monte Carlo (MCMC) technique, discussed in the next section.
1.3
Markov Chain Monte Carlo (MCMC)
Sometimes it is easier to estimate a deterministic quantity (such as the posterior probabilities discussed above) through random sampling rather than a direct analytical calculation. This approach was first envisioned by Stanislaw Ulam, a Polish American mathematician, while he passed the time recovering from an illness by playing Canfield solitaire. After considering for some time how to calculate the probability of winning a game of solitaire, he realized that sampling many solitaire games and recording win rates was a simpler approach than analytically calculating the win probability. He called the new random sampling method Monte Carlo sampling [2] in reference to the eponymous region of Monaco famous for its casinos and games of chance. In order to generate random samples from a particular probability distribution, Markov Chain Monte Carlo (MCMC) walk employs the Markov chain method. In a Markov chain, the next step taken depends only on the current location, and not on the path that led to the current location (i.e. the previous steps). Markov chains have some useful mathematical properties for sampling of probability distributions, detailed in reference [5]. In MCMC, a Markov chain that has the probability distribution of interest as its equilibrium distribution is created. After a number of steps spent reaching equilibrium, the chain can be analyzed and tested for convergence to the target distribution, and all further chain steps are samples taken from the converged probability distribution.
Flower A 3 g nectar
Flower B 6 g nectar
Figure 2: Bee and Flowers
A simple example may clarify how the technique works (Figure 2). Consider a closed ecosystem containing a single honeybee and two flowers. The nectar levels in the flowers do not change with time. Every hour, the bee determines whether to move to the other flower using an unchanging rule: if the other flower contains the same or more nectar, the bee always switches flowers, but if the other flower contains less nectar, it may (or may not) switch flowers. It will do so with a probability proportional to the difference in nectar levels between the two flowers (i.e. the bee is more likely to jump to a slightly worse flower than to a flower that is much worse). If one wished to determine the probability that the bee is located at a particular flower, one could do so by recording samples of the bee’s location over time. As sampling increases, the fraction of time spent on a particular flower converges to a particular value and the probability of the bee being on that flower can be inferred. In MCMC parlance, the system has reached convergence when further samples do not change the probability estimate within a given error; the samples taken before convergence are termed burn-in. There are a number of statistical tests for assessing convergence, all designed to test whether convergence has not occurred. Passing a given test is not a guarantee that the walk has converged and is sampling from the desired probability distribution.
1.4
Algorithm Details
The PyDREAM algorithm employs the DREAM(ZS) algorithm to sample posterior parameter distributions given by specified priors and a likelihood function. The pseudo-code of the algorithm is given on the next page. This recipe follows [10] with the exception that we hardwired the use of a single chain pair (e.g. δ = 1) for the parallel direction and snooker update. Scalars appear as lowercase italic, vectors as lower case letters, and matrices as upper case letters. Functions are typeset bold. Default values are used for the algorithmic variables. The DREAM(ZS) code uses as inputs the dimensionality, d of the target distribution (number of model parameters), and the number of chains, nchains (default is 3 unless d is large). In addition, a version of the algorithm with parallel multi-try updates, MT-DREAM(ZS) , is also available in PyDREAM. Details of the algorithms are presented in various publication in the literature and their MATLAB implementation is discussed in detail by [10].
1: 2: 3: 4: 5: 6: 7: 8: 9: 10: 11: 12: 13: 14: 15: 16: 17: 18: 19: 20: 21: 22: 23: 24: 25: 26: 27: 28: 29: 30: 31: 32: 33: 34: 35: 36: 37: 38: 39: 40: 41: 42: 43: 44: 45: 46: 47: 48: 49: 50: 51: 52: 53: 54: 55: 56: 57: 58: 59: 60: 61: 62: 63:
c = 0.05 . Default values of DREAM algorithmic variables c∗ = 10−12 ncr = 3 pγ = 0.2 k = 10 . Default values of DREAM(ZS) algorithmic variables psn = 0.1 m0 =� 10d � cr = 1/ncr 2/ncr · · · 1 . Crossover values pcr = 1/ncr ones(ncr ) . Selection probability crossover values: ncr unity vector multiplied with 1/ncr Z = prior(m0 ) . Create initial archive with m0 draws from the prior distribution X = Z[m0 − nchains + 1 : m0 ] . Use last nchains points of archive Z as initial chain states pX = pdf (X) . Calculate posterior density of initial chain states m = m0 . Set initial length archive equal to m0 for iter in niter do . For each iteration Λ = uniform(-c, c,nchains ) . Draw nchains values from uniform distribution between −c and c e = c∗ normal(0,1,nchains ) . Vector of nchains standard normal draws multiplied with c∗ if uniform(0,1) ≤ (1 − psn ) then . Parallel direction or snooker jump for this generation (iteration)? for chain in nchains (sequential) do . Parallel direction jump for each chain a, b = randsample(m, 2) . Sample two integers from 1, 2, ... m . Sample crossover from vector cr with probabilities pcr cross = draw crossover(cr, pcr ) d∗ = 0 . Number of dimensions to update is zero for dim in ndim do . For each dimension if uniform(0,1) ≤ cross then . Is dimension dim selected with current crossover, cross dxdim = Z[a]dim - Z[b]dim . Update dx dimension dim to difference of dim of points Z[a] and Z[b] of archive d∗ = d∗ + 1 . Increment dimensions updated else dxdim = 0 . Zero jump in respective dimension end if end for if uniform(0,1) √ ≥ pγ then . Use default jump factor for d∗ dimensions γ = 2.38/ 2δd∗ else γ=1 . Set jump factor to unity to simplify mode jumping end if dX[chain] = e[chain] + γ(1 + Λ[chain])dx . Parallel direction jump vector of current chain αsn [chain] = 1 . Symmetric proposal distribution (no snooker correction needed) end for else for chain in nchains (sequential) do . Snooker jump for each chain a, b, c = randsample(m, 3) . Sample three integers from 1, 2, ... m γ = uniform(1.2, 2.2) . Sample randomly the jump factor F = X[chain] - Z[a] . Difference vector of current chain state and archive point Z[a] zp = orthog proj(F, Z[b], Z[c]) . Project orthogonally points Z[b] and Z[c] of archive Z onto F dX[chain] = e[chain] + γ(1 + Λ[chain])zp . Snooker jump vector of current chain �(d−1) αsn [chain] = (X[chain] + dX[chain] − Z[a])2 /(X[chain] − Z[a])2 . Snooker correction nonsymmetry jump end for end if Xp = X + dX . Compute candidate points for the chains for chain in nchains (in parallel) do . For each chain pXp [chain] = pdf (Xp[chain]) . Calculate posterior density of proposal point end for for chain in nchains (sequential) do � pacc [chain] = min 1, αsn [chain](pXp [chain]/pX [chain]) . Calculate acceptance probability if pacc [chain] ≥ uniform(0,1) then . If accept Xp of current chain X[chain] = Xp[chain] . Candidate point becomes new state of chain pX [chain] = pXp [chain] . Density of proposal is equivalent to density of current state chain end if end for if modulus(iter, k) == 0 then . Check whether to append current population to archive Z[m + 1 : m + nchains ] = X . Append current states of chains to archive m = m + nchains . Increment number of points in archive end if end for
2 2.1
Detailed Biological Example Introduction
In this section, we provide greater detail on the PyDREAM systems biology calibration example included in the main text, the COX-2 Reaction Model (CORM), previously published in reference [7].
2.2
COX-2 Reaction Model (CORM)
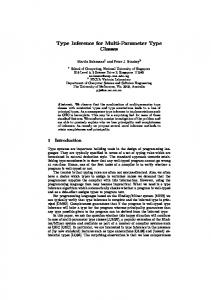
As mentioned in the main text, CORM is a model that describes the reaction kinetics of the enzyme cyclooxygenase-2 (COX-2) with two substrates, arachadonic acid (AA) and 2-arachadonyl glycerol (2-AG), as shown schematically in Figure 3. Although COX-2 is structurally a homodimer, functionally it behaves as a heterodimer with one catalytic site and one allosteric site in each subunit. AA turnover by COX-2 produces prostaglandin (PG) while 2-AG turnover produces prostaglandin glycerol (PGG). The CORM reaction network consists of 13 chemical species and 29 reactions and it is not possible to directly measure all the associated kinetic rates. Therefore, we used PyDREAM to infer the values for the unmeasurable kinetic rates. To ensure parameters were physically meaningful, we made sure the obtained values were consistent with the experimental data, that experimentally measured kinetic rates were kept fixed throughout the calibration, and that system thermodynamic constraints were satisfied. CORM was created using the Python package PySB [6] and is currently maintained as Python code at http://github.com/LoLab-VU/CORM. Model species are shown in Table 1 and model reactions in Table 2.
COX-2
COX-2
2-AG
2-AG
2-AG
PG
COX-2
COX-2
2-AG
2-AG
AA
COX-2
COX-2
COX-2 AA
AA
2-AG
PGG COX-2 allosteric
AA
COX-2 AA
AA
catalytic
AA 2-AG
Figure 3: COX-2 Reaction Model
Species COX-2 AA 2-AG PG PGG COX-2:AA(cat) COX-2:2-AG(cat) COX-2:AA(allo) COX-2:2-AG(allo) COX-2:AA(cat):AA(allo) COX-2:2-AG(cat):2-AG(allo) COX-2:AA(cat):2-AG(allo) COX-2:2-AG(cat):AA(allo)
Starting Concentration (µmolar) .015 0, .5, 1, 2, 4, 8, 16 0, .5, 1, 2, 4, 8, 16 0 0 0 0 0 0 0 0 0 0
Table 1: CORM Species
PySB-generated Reaction COX-2 + AA * ) COX-2:AA(cat) COX-2 + AA * ) COX-2:AA(allo) COX-2 + 2-AG * ) COX-2:2-AG(cat) COX-2 + 2-AG * ) COX-2:2-AG(allo) COX-2:2-AG(allo) + AA * ) COX-2:AA(cat):2-AG(allo) COX-2:AA(cat) + AA * ) COX-2:AA(cat):AA(allo) COX-2:2-AG(allo) + 2-AG * ) COX-2:2-AG(cat):2-AG(allo) COX-2:AA(cat) + 2-AG * ) COX-2:AA(cat):2-AG(allo) COX-2:AA(allo) + AA * ) COX-2:AA(cat):AA(allo) COX-2:2-AG(cat) + AA * ) COX-2:2-AG(cat):AA(allo) COX-2:AA(allo) + 2-AG * ) COX-2:2-AG(cat):AA(allo) COX-2:2-AG(cat) + 2-AG * ) COX-2:2-AG(cat):2-AG(allo) COX-2:AA(cat) → PG + COX-2 COX-2:2-AG(cat) → PGG + COX-2 COX-2:AA(cat):2-AG(allo) → PG + COX-2:2-AG(allo) COX-2:2-AG(cat):2-AG(allo) → PGG + COX-2:2-AG(allo) COX-2:AA(cat):AA(allo) → PG + COX-2:AA(allo) COX-2:2-AG(cat):AA(allo) → PGG + COX-2:AA(allo)
Rate or Equilibrium Constant KD AA cat1 = .83 µmolar KD AA allo1 KD AG cat1 = .76 µmolar KD AG allo1 KD AA cat2 KD AA allo2 KD AG cat2 KD AG allo2 KD AA cat3 KD AA allo3 KD AG cat3 KD AG allo3 = 63 µmolar kcat AA1 = 1.3 s-1 kcat AG1 = 1.2 s-1 kcat AA2 0 s-1 kcat AA3 kcat AG3
Table 2: CORM Reactions
2.3
Experimental Data
The available experimental data consisted of 49 measurements at different substrate concentrations of the products and PG and PGG, all measured ten seconds after the mixing of enzyme and substrate. Each data point was collected in triplicate and reported as a mean and standard deviation. The experimental data can be found in reference [7], Figure 3.
2.4
Experimental Rates
Six experimentally measured catalytic rates and disassociation constants were available from our collaborators. These are marked in red in Table 2.
2.5
Thermodynamic Constraints
When a kinetic scheme contains cycles with identical beginning and ending species, at equilibrium the net flux through the cycle vanishes. This constrains the product of the equilibrium constants for the reactions in the cycle to be equal to one. Alternatively, one may view the cycle as energy conserving (no net change in free energy). Within the specified interaction network, there are four such thermodynamic cycles, within which relative parameter values must be consistent with energy conservation. These cycles are shown in Figure 4. These constraints were incorporated into the likelihood function as described in section 2.7.
1
2 COX-2
COX-2
COX-2
COX-2
AA
COX-2 AA
2-AG
COX-2 AA
COX-2
AA
3
AA
COX-2 AA
2-AG
4 COX-2
COX-2
COX-2
COX-2
AA
COX-2 2-AG
COX-2 2-AG
AA
2-AG
COX-2 2-AG
Figure 4: Thermodynamic Cycles in CORM
COX-2 2-AG
2-AG
2.6
Specifying Priors
Broad (spanning multiple orders of magnitude), normal prior distributions were specified for all parameters to be fitted. These were selected based on expert biological knowledge provided by our collaborators. Disassociation constants were used rather than forward and reverse rates; the forward rates were assumed to be diffusion limited and the reverse rates were varied to give a particular KD . Prior distributions for all parameters are shown in Figure 5.
1.0 0.8 0.6 0.4 0.2 0.0
1.0 0.8 0.6 0.4 0.2 0.0
1.0 0.8 0.6 0.4 0.2 0.0
1.0 0.8 0.6 0.4 0.2 0.0
1.0 0.8 0.6 0.4 0.2 0.0
1.0 0.8 0.6 0.4 0.2 0.0
log10(KD_AA_cat2)
−6
−4
−2
0
2
1.0 0.8 0.6 0.4 0.2 0.0
4
log10(KD_AA_cat3)
−6
−4
−2
0
2
1.0 0.8 0.6 0.4 0.2 0.0
4
log10(KD_AG_cat2)
−6
−4
−2
0
2
1.0 0.8 0.6 0.4 0.2 0.0
4
log10(kcat_AG3)
−6
−4
−2
0
2
1.0 0.8 0.6 0.4 0.2 0.0
4
log10(KD_AA_allo2)
−6
−4
−2
0
2
1.0 0.8 0.6 0.4 0.2 0.0
4
log10(KD_AG_allo1)
−6
−4
−2
0
2
1.0 0.8 0.6 0.4 0.2 0.0
4
log10(kcat_AA2)
−6
−4
−2
0
2
4
log10(kcat_AA3)
−6
−4
−2
0
2
4
log10(KD_AG_cat3)
−6
−4
−2
0
2
4
log10(KD_AA_allo1)
−6
−4
−2
0
2
4
log10(KD_AA_allo3)
−6
−4
−2
0
2
4
log10(KD_AG_allo2)
−6
−4
−2
0
2
4
Figure 5: Prior Distributions for Fitted Parameters
2.7
Specifying a Likelihood Function
The likelihood function used to calibrate CORM included two terms: a fit to experimental data and the degree to which the thermodynamic constraints were maintained (assuming normally distributed error with σ = .01 tolerance to deviations from perfect energy conservation). Because both terms were normally distributed, both used the normal probability density function: f (x, µ, σ) =
(x−µ)2 1 √ e− 2σ2 σ 2π
(2)
where x is the simulated data point (or simulated equilibrium constant product), µ is the experimental data mean (or the correct equilibrium constant product = 1), and σ is the experimental
standard deviation (or the allowed thermodynamic constraint deviation of .01). To learn how to implement this likelihood function in PyDREAM, see section 7.2.
2.8
Posterior Distributions
Sampling was continued until convergence (as measured by the Gelman Rubin statistic) was achieved for all fitted parameters. The final posterior distributions are shown in Figure 6. Notice that there is little information learned about some parameters after calibration; this is indicated by the fact that those parameters closely resemble their prior distributions. Other parameters are well-constrained by the data and deviate considerably from their prior distributions.
1.0 0.8 0.6 0.4 0.2 0.0
1.0 0.8 0.6 0.4 0.2 0.0
1.0 0.8 0.6 0.4 0.2 0.0
1.0 0.8 0.6 0.4 0.2 0.0
1.0 0.8 0.6 0.4 0.2 0.0
1.0 0.8 0.6 0.4 0.2 0.0
log10(KD_AA_cat2)
−6
−4
−2
0
2
4
log10(KD_AA_cat3)
−6
−4
−2
0
2
4
log10(KD_AG_cat2)
−6
−4
−2
0
2
4
log10(kcat_AG3)
−6
−4
−2
0
2
4
log10(KD_AA_allo2)
−6
−4
−2
0
2
4
log10(KD_AG_allo1)
−6
−4
−2
0
2
4
1.0 0.8 0.6 0.4 0.2 0.0
1.0 0.8 0.6 0.4 0.2 0.0
1.0 0.8 0.6 0.4 0.2 0.0
1.0 0.8 0.6 0.4 0.2 0.0
1.0 0.8 0.6 0.4 0.2 0.0
1.0 0.8 0.6 0.4 0.2 0.0
log10(kcat_AA2)
−6
−4
−2
0
2
4
log10(kcat_AA3)
−6
−4
−2
0
2
4
log10(KD_AG_cat3)
−6
−4
−2
0
2
4
log10(KD_AA_allo1)
−6
−4
−2
0
2
4
log10(KD_AA_allo3)
−6
−4
−2
0
2
4
log10(KD_AG_allo2)
−6
−4
−2
0
2
4
Figure 6: Posterior Distributions for Fitted Parameters
3
Practical Advice for MCMC Analysis
3.1
Considerations for Priors
• Priors are meant to capture any previous knowledge about the model parameters to be fitted. • In cases where a previous Bayesian analysis has been performed, more experimental data has become available, and further analysis is desired, the prior for the new analysis could be the
posterior from the original analysis. • If one has no prior information about the parameters to be fitted, one can use a flat prior , which returns zero no matter the value of the parameter. The fitted parameters will then be constrained only by the fit to experimental data captured by the likelihood function. • If the data fit captured by the likelihood function adds no information about a particular parameter, the posterior for that prior will be its prior. • Some probability distributions are called conjugate; this means that for a given likelihood function distribution, selecting its conjugate prior will yield a posterior distribution of the same type as the prior. For example, the conjugate prior for a normally distributed likelihood function is a normal distribution; this means that if one uses a normally distributed likelihood function and normal priors, the posterior distributions will also be normal. • For chemical kinetics systems, popular parameter prior choices are normal and uniform distributions over biologically plausible kinetic parameter ranges. • If concern exists that the choice of prior may bias the posterior distributions (perhaps one is unsure about the strength of belief in the prior), Bayesian sensitivity analysis can be performed. In a Bayesian sensitivity analysis the choice of prior is varied and the effect this has on the final posterior distributions is observed.
3.2
Considerations for Likelihood Functions
• One can think of the likelihood function as answering the following question (for a given parameter vector): ’What is the probability of observing the experimental data given these parameters and how one believes the data is distributed?’ • As alluded to in the last point, specifying a likelihood function entails specifying the type of distribution one believes represents the experimental data. • The presentation of biological experimental data often implicitly assumes normally distributed data (e.g. experiments run in triplicate are frequently reported with a mean and standard deviation). • If multiple datasets exist one may calculate the individual likelihoods and multiply the individual probabilities (or add log-probabilities).
3.3
Considerations for Assessing Convergence
• Posterior distributions should be examined once all parameters have converged. • Using multiple methods to assess MCMC walk convergence is advantageous because individual methods can fail to detect lack of convergence under various circumstances. • It is also advantageous to initialize different MCMC chains from disperse start points, as the only way to detect chains trapped in a local minimum is the presence of at least one chain not in the local minimum. Some convergence tests (including Gelman Rubin, mentioned below) assume that start points are disperse for different chains relative to the final posterior distributions.
• A way to graphically assess convergence is using a trace plot, a plot of iterations versus sampled value. Ideally, the plot will show good mixing (sampling across the range of good fit values occurs in few iterations). In addition, if one compares trace plots from different chains (either from the same run, as in PyDREAM, or from different runs), one should see that after later iterations, values are being sampled in the same region for each chain. The samples from earlier iterations are termed burn-in and should not be included in the posterior distributions. • There are numerous statistical tools to test for lack of convergence. One of the most popular, Gelman Rubin, is included in PyDREAM. This test compares between-chain and within-chain variance for multiple MCMC chains; after convergence, these measures should be similar, but before convergence the between-chain variance will be larger. Note that the Gelman Rubin metric assumes that the MCMC chains being compared have been initialized from points that are dispersed relative to the posterior distribution. Also note that the presence of multiple modes in the posterior distributions will cause Gelman Rubin to fail, possibly falsely. • A final quantity to assess in the MCMC chains obtained from run(s) is their autocorrelation. In a true Markov chain, a given draw depends only on the previous draw. In an actual MCMC chain, there will likely be autocorrelation at shorter lag times. This means that samples are not strictly independent, and some MCMC practitioners choose to employ a technique called thinning, retaining only the i th samples, with i dependent on the lag at which autocorrelation is minimized. An alternative to thinning is simply to continue running the chain for a longer period.
4
Installation
After installing Python, the pydream package can be installed by typing the command: pip install pydream in the command line. This automatically installs all dependencies. PyDREAM has been tested on Linux and Mac. If you need further help with installation, please see section 9.
5
Implementation
PyDREAM is implemented in the pydream Python package, based on the original MATLAB code [10]. The package includes a class Dream (in the file Dream.py). The Dream class contains the astep method, which takes as input a point in parameter space, generates a proposed point, accepts or rejects the proposed point, and returns the current point in parameter space. This method is called iteratively when running DREAM sampling. The Dream class also includes other methods which are called by the astep method. For instance, there are methods to generate proposal points with the default or snooker update scheme, accept or reject proposal points, update crossover probabilities, and save sampled histories to file. The user interfaces with the Dream class through wrapper functions included in the file core.py, specifically the run_dream function. Detailed PyDREAM usage is described in section 7. Detailed code documentation is included within the code base and online at http://pydream.readthedocs.io/en/latest/.
6
Test Case Performance
To ensure that the PyDREAM implementation replicated the output of the original MATLABbased MT-DREAM(ZS) algorithm, output from the two implementations was compared for several test cases. We describe these below.
6.1
10D Bimodal Mixture Model
This test case, originally described in [9], is a ten-dimensional bimodal pdf with modes centered around -5 and 5, each with a variance of 5. Two thirds of the density is centered around the latter mode. Example code implementing this test case is provided in the examples folder within the PyDREAM package and described in Section 7.4.1. PyDREAM was run for 50,000 iterations with 3 chains and 5 multi-try parallel tests, requiring 5 minutes on a six-core CPU. The first 50% of the samples were removed as burn-in. The sampled distributions for each parameter dimension are shown in Figure 7.
Figure 7: PyDREAM samples for a 10D bimodal test case. Each subfigure depicts a parameter dimension. Samples drawn using PyDREAM are shaded while the true distribution is indicated by a black line. Sampled values are in arbitrary units.
6.2
200D Multivariate Normal
This test case, described in [4], is a 200-dimensional multivariate normal distribution. The variance of the j th variable is equal to j, and the pairwise correlations are set to 0.5. Example code
implementing this test case is provided in the examples folder within the PyDREAM package and described in Section 7.4.2. PyDREAM was run for 150,000 iterations with 3 chains and 5 multi-try parallel tests, requiring 50 minutes on a six-core CPU. The first 50% of the samples were removed as burn-in. The sampled distributions for 10 representative dimensions are shown in Figure 8.
Figure 8: PyDREAM samples for a 200D multivariate normal test case. Each subfigure depicts one of ten representative parameter dimensions. Samples drawn using PyDREAM are shaded while the true distribution is indicated by a black line. Sampled values are in arbitrary units.
7
PyDREAM Usage
1
2
1.2/s
3 [P] T 4
5 k1
2 µM 1. 2. 3. 4. 5.
1/s
Interaction network Experimental kinetic rates Experimental data Experimental conditions Plausible ranges for kinetic rates (priors)
[P]
PyDREAM
T Accept/reject move based on fit to (3) Simulate
parallel chains subspace search multi-try snooker update
converged?
3 µM
KD1
1/s
10 nM
k1
KD2
Inferred kinetic rate distributions
Figure 9: Schematic representation of PyDREAM workflow. The experimental data, model setup, prior parameter distribution, and likelihood function are defined as algorithmic input (top). This serves as input to the technical heart of PyDREAM (middle) which uses differential evolution for chain evolution, with a Metropolis selection rule to decide whether to accept/reject candidate points. These sampled chain trajectories (bottom) are then returned to the user and used to summarize the marginal posterior parameter distributions.
Using PyDREAM to infer parameter distributions involves three steps: 1. Specifying Parameter Priors (Figure 9, top box, item 5) 2. Defining a Likelihood Function (which measures the fit to experimental data, Figure 9, top box, item 3) 3. Sampling (Figure 9, middle box) An overview of PyDREAM usage is shown in Figure 9. A detailed guide to each of these steps is provided below.
7.1
Specifying Parameter Priors
PyDREAM provides simple parameter prior specification for any continuous statistical distribution defined in SciPy [3]. To use one of these distributions, the user passes the SciPy statistical distribution object and any arguments to the distribution to the PyDREAM SampledParam class. For example, to create a parameter with a normal prior with µ=3 and σ=1, the following code would be used: from scipy.stats import norm from pydream.parameters import SampledParam parameter = SampledParam(norm, loc=3, scale=1) Examples of prior distribution generation with PyDREAM can be seen in any of the examples included with PyDREAM (described in the Examples section below). Prior classes that are not dependent on SciPy distributions can also be created if a distribution class with logpdf and rvs methods is created to mimic SciPy functionality [3].
7.2
Defining a Likelihood Function
A likelihood function links the observed data with the estimated parameters and should return the probability of a given set of parameters given the observed data. In PyDREAM, a likelihood function is a Python function that takes as input a parameter vector and returns the log probability for that parameter vector given the observed data. These functions are user-defined to provide maximum flexibility and some examples of likelihood function definitions are provided in the examples included in the PyDREAM distribution. Below, we describe a sample likelihood function used in the PySB Robertson [8] example provided in the PyDREAM package (described in Section 7.4.3. The function takes a parameter vector as input, substitutes the current parameter values into a set of ODEs, solves the ODEs, and computes the probability of observing the simulated values given the normally distributed experimental data (see Figure 10). The distribution of the experimental data is specified when the like_ctot object is created outside of the likelihood function using a SciPy statistical distribution of the user’s choice. #Load experimental data mean and standard deviation from text files into numpy arrays exp_data_ctot = numpy.loadtxt('exp_data_ctotal.txt') exp_data_sd_ctot = numpy.loadtxt('exp_data_sd_ctotal.txt') #Create scipy normal probability distributions for data likelihoods
Observed experimental data distribution
Simulated data with high probability density
Simulated data with low probability density
Figure 10: Calculating the Probability of Observing a Simulated Data Point #loc argument = mean #scale argument = standard deviation like_ctot = scipy.stats.norm(loc=exp_data_ctot, scale=exp_data_sd_ctot) def likelihood(parameter_vector): param_dict = {pname: pvalue for pname,pvalue in \ zip(pysb_sampled_parameter_names, parameter_vector)} for pname, pvalue in param_dict.items(): #Change model parameter values to current location in parameter space model.parameters[pname].value = 10**(pvalue) #Simulate experimentally measured Ctotal values. solver.run() #Calculate log probability contribution from simulated experimental values. #We use the experimental data distribution specified above when #we created the like_ctot object #The logpdf method of the distribution is standard for all SciPy #continuous distributions and returns the log of the probability #density associated with the points passed #We pass a vector of points simulated at the experimental time #points (specified as a PySB observable) #This returns a vector of probability densities, one for each
#simulated point. We then sum these using the numpy sum function to #get our total log probability logp_ctotal = numpy.sum(like_ctot.logpdf(solver.yobs['C_total'])) #If model simulation failed due to integrator errors, return a log probability of -inf. if np.isnan(logp_ctotal): logp_ctotal = -np.inf return logp_ctotal This likelihood function can be seen within the context of a full PyDREAM script in the example_sample_robertson_with_dream.py file in the PyDREAM repository.
7.3
Sampling
Sampling with PyDREAM after defining parameter priors and a likelihood function requires calling the run_dream function within the PyDREAM core module: from pydream.core import run_dream run_dream(parameters, likelihood) where parameters and likelihood are a list of the previously defined parameter priors, and the likelihood function, respectively. The run_dream function takes numerous optional arguments which are then passed to initialize the underlying Dream class. Reasonable defaults are provided for these options, but some problems may benefit from changing the defaults. All available options are included below in the Algorithm Options section for reference. Documentation is also provided within the PyDREAM source code.
7.4
Examples
Four detailed examples are included in the PyDREAM package (in the examples folder). These include both statistical test models and biological models. These are described below. 7.4.1
Mixture Model
This is the 10-dimensional bimodal distribution discussed in Section 6.1. It was originally described in [9]. The modes are centered around -5 and 5, each with a variance of 5. 2/3 of the density is centered around the latter mode. The multiple modes make convergence with a non-adaptive MCMC algorithm unlikely. This example is contained in mixturemodel.py in the PyDREAM examples directory. 7.4.2
200-dimensional Gaussian
This is the multi-dimensional gaussian distribution discussed in Section 6.2. It was originally described in [4]. The variance of the j th variable is equal to j, and the pairwise correlations are set to 0.5. Correlation amongst parameters and the high-dimensional nature of the problem make convergence using non-adaptive MCMC unlikely. This example is contained in dream_ex_ndim_gaussian.py in the PyDREAM examples directory.
7.4.3
Robertson Model
This is a simple chemical reaction model originally described in [8] and often used to study stiffness in differential equations. It consists of the following reactions: 1. A Õ B with rate .04 s-1 2. 2B Õ B + C with rate 3.0 x 10⁷ s-1 3. B + C Õ A + C with rate 1.0 x 10⁴ s-1 A PySB [6] based example is included in example_sample_robertson_with_dream.py and a PySBindependent version in example_sample_robertson_nopysb_with_dream.py in the PyDREAM examples directory. 7.4.4
COX-2 Reaction Model (CORM)
This is a biochemical model originally described in [7], included in the main text, and described in greater detail in Section 2. Attempted calibration of this model with a non-adaptive MCMC algorithm failed to converge after more than a million iterations; in contrast, sampling with PyDREAM converges within 50,000 iterations. It includes the catalytic and allosteric interactions of the enzyme cyclooxygenase-2 (COX-2) with two of its substrates, arachadonic acid and 2-arachadonyl glycerol. The model consists of thirteen species and twenty-nine reactions. A PySB-dependent version of this model is included in example_sample_corm_with_dream.py in the PyDREAM examples directory.
8
Algorithm Options
nchains The number of parallel DREAM chains to run. Default: 5 niterations The number of iterations of the algorithm to run. Default: 50000 start A location in parameter space to begin the algorithm. This may be either a list of locations the same length as nchains, or a single location at which to start all chains. Default: None. Start all chains in random locations drawn from the prior. restart A flag to use when continuing an earlier run. When used, will attempt to load earlier history and fitted probability values using the model name specified by the model_name argument. Default: False verbose Trigger printing of detailed information relating to the run, such as acceptance or rejection of a jump and the current acceptance rate. Default: True tempering Whether to use parallel tempering of the parallel DREAM chains. This feature has been very minimally tested. Use at your own risk! Default: False nseedchains The number of draws to seed the history with at the start of a new DREAM run. Default: The number of sampled parameter dimensions times ten nCR The number of different crossover probability values to use. Default: 3 adapt crossover Whether to adapt crossover probability values. Default: True
adapt gamma Whether to adapt gamma values. Default: False crossover burnin How many iterations to adapt crossover and/or gamma values. Default: 10% of the total iterations. DEpairs The number of pairs of sampled past points to use for determining the next jump size. Default: 1 lamb Small random error to ensure ergodicity in walk. Default: .05 zeta Randomization term. Default: 10-12 history thin How many iterations to take before saving a point to the history. Default: 10 snooker Probability of proposing a snooker update. Default: .10 p gamma unity Probability of setting γ=1. Default: .20 gamma levels Levels of γ adaptation (decreases default γ value as levels increase. Useful to get universally smaller jump sizes.) Default: 1 start random Whether to start from a random location in parameter space. Default: True save history Whether to save the history to file at the end of the run. This also controls whether crossover and gamma level probabilities are saved to file at the end of the run. Default: True history file The name of a file to load a history of chain states from a previous run. This will be set automatically if you specify the model_name with restart = True. crossover file The name of a file to load a set of previously fit crossover probabilities. This will be set automatically if you specify the model_name with restart = True. gamma file The name of a file to load a set of previously fit gamma level probabilities. This will be set automatically if you specify the model_name with restart = True. multitry Whether to use multiple trials for each chain at each iteration. This can be set to True, False, or a value for the number of multiple trials per iteration. Default: False. If set to True, the default number of multiple trials is 5. parallel Whether to execute multiple trials in parallel (different DREAM chains are always run in parallel). Default: False model name A string for the model name. This will be used when saving history, crossover probabilities, and gamma level probability files. It will also be used for automatic loading of previous run files when restart = True. Default: Save files with the current date and time in the file name.
9
Support
Any comments or questions may be raised by opening an issue at the PyDREAM GitHub repository at http://github.com/LoLab-VU/PyDREAM. For more information on the algorithm and other available implementations, see the detailed DREAM manual [10]. For users who prefer a GUI, a DREAM Windows implementation is also available at http://www.dreamsuite.eu.
References [1] Bolstad, W. M. and Curran, J. M. (2016). Introduction to Bayesian statistics. 3rd edition. (Wiley, 2017). [2] Eckhardt, R. Stan Ulam, John von Neumann, and the Monte Carlo Method. Los Alamos Science 1987; 131-141. [3] Jones, E. et al. (2001) SciPy: Open Source Scientific Tools for Python. http://www.scipy.org. [4] Laloy, E. and Vrugt, J.A. (2012). High-dimensional posterior exploration of hydrologic models using multiple-try DREAMZS and high-performance computing. Water Resour. Res., 48, W01526. [5] Levin, D.A., Peres, Y. and Wilmer, E.L. (2008). Markov chains and mixing times. 1st edition. (American Mathematical Society, 2008). [6] Lopez, C.F. et al. (2013). Programming biological models in Python using PySB. Mol. Syst. Biol., 9:646. [7] Mitchener, M. M. et al. (2015). Competition and allostery govern substrate selectivity of cyclooxygenase-2. PNAS, 112:40, 12366-12371. [8] Robertson, H.H. (1966) The solution of a set of reaction rate equations. Numerical Analysis: An Introduction, Academic Press, pp. 178-182. [9] Vrugt, J.A. et al. (2009) Accelerating Markov chain Monte Carlo simulation by differential evolution with self-adaptive randomized subspace sampling. Int. J. Nonlinear Sci., 10:3, 271288. [10] Vrugt, J.A. (2016) Markov chain Monte Carlo simulation using the DREAM software package: Theory, concepts, and MATLAB implementation. Environ. Modell. Softw., 75, 273-316.