G.Ghinea@reading. ac.uk. L ABSTIL4CT ... J.P.Thomas@reading. ac.uk. 1. 2. ..... entertainment and content understanding is therefore not direct and this is ...
.
—
--
..:,._”
- —
QoS Impact on User Perception and Understanding of MultimediaVideo Clips G. Ghinea
J.P. Thomas
Department of Computer Science, University of Reading RG6 -6AY, Berks, U.K.
Department of Computer Science, University of Reading RG66AY, Berks, U.K
Tel. No. +44-1 _18-9875123 x 7643
Tel. No. +44-1 18-9875123 x 7631
G. Ghinea@reading. ac.uk
J.P.Thomas@reading. ac.uk
L ABSTIL4CT
2. INTRODUCTION
The widespread and increasing advent of multimedia technologies means that there must be a departure from the viewpoint that users expect a Quality of Service (QoS) which will only satisfy them perceptually. What should be expected of multimedia clips is that the QoS with which they are shown is such that it will enable the users to assimilate and understand the informational content of such clips. In this paper we present experimental resuks Iiiking users’ understanding and perception of multimedia ctips with the presentation QoS. Results show that the quality of video clips can be severely degraded without the user having to perceive any significant 10ss of informational content
Multimedia QoS is ~ically measured using technical parameters such as end-to-end delay and jitter. Such technical parameters, although usefid, disregard the users’ perspective of the presentation. The human element is an important part of the multimedia paradigm whose role, although appreciate~ has often been overlooked. This is because of the inherent difficulty and subjectivity associated with appreciating an individual’s sense of multimedia perception and, consequently, precious little . work has been done in this area. What work [1], [2], [4] has been done, however, has indicated the existence of a threshold beyond which a user does not perceive an improvement in the QoS of multimedia applications, no 1matter the amount of resources allocated to them. Some research has also been done in order to establish the synchronisation limits between audio and video streams of I multimedia clip with which human observers are ;otiortable [3]. We are currently involved in investigating the impact that 1uudtimedia QoS has not only on a user’s satisfaction with he quality of the presentation itself, but also on hidher :apacity to understan& analyse and synthesise the iinformational content of such presentations.
1.1 Keywords @xS,multimedi~ user perception user understanding Permissionlo make digiml or hard copies of all or part of this work for personal or classroom use is gramed withou~ fee provided ~hat copies are not made or distnirr!ed for profil or commercial advantage, and that copies bear th~ nolice and the full citation on the first page. To copy other-.vis~to republish, 10posI on servers or 10 redistribute to lists, requires prior specific pmrrrisslonandlor a fee. AChi hkltlmedla’9S. Bristol, UK @ 199S AChl 1-5S113-036-8B8!OO08
1
!
:* (
lle motivation behind this approach is that in multimedia iitis not only the aesthetics that count bu~ also the effect of
:esource allocation on the user’s potential to comprehend ind assimilate the material and data presented in 1mdtimedia applications. This is especially important as 1mdtimedia databases become widespread and the 1:echrtology is used in information-intensive domains such E education. Moreover, the QoS impact on user perception . . ind understanding also lm.s implications on network )rotocol design and resource allocation. 1
S5.00
49
!
- .—
.,,~,_
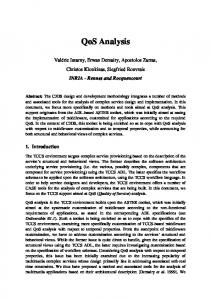
3. OUTLINE OF APPROACH In our approach users were presented with a series of windowed (35Y2S8 pixels) MPEG-1 video clips. If users habitually wore glasses and did not have their reading glasses OILthey were told to put them OL as there might be instances where they might be asked questions about textual tiormation displayed on the screem Each of the clips, 12 in all, was between31 and 45 seconds long. After the users has seen each clip once, the window was close~ and they were aslied a number of questions about the video clip they had just see= The actual number of such questions depended on the video clip, and varied between 10 and 12- After the user had answered the set of questions pertaining to a particular video clip and the responses had been duly noted (s)he was asked to rate the quality of the clip that had just been seen on a scale of 1-6 (with scores of 1 and 6 representing the worst an~ respectively, best perceived qualities possible). The user then went on and visualized the next clip.
Movie
I
3- Band 4- chorus
I
I
I
1
2
1
0
o 1
2
1
2
2
0 1
2
2
0
7- Documentary
o 1
2
2
0
8- News
o
2
2
1
9- Pop Music
2
2
2
10- Rugby
1 2
1
2
11- Snooker
o
1
1
1 2
12- Weather
o
2
2
2
5 - Commercial 6- Cooking
Forecast
I
I
I
1. Bandwidth is the main resource we are interested in using more efficiently- As the audio stream occupies a very small bandwidth of the multimedia clip, compression at this level will not result in major gains in bandwidth. 2.
●
temporal parameters
●
importance of audio information the clip
●
importance of the video information in the context of the clip
●
in the context of
importance of textual information in the context of
theclip Table 1 contains a brief characterisation of the clips used in our experiments. This was obtained by assigning weights on a scale of O-2 corresponding to the importance of the
It has been already shown that audio information has primacy o~er video content [3]. Vle were especially interested in the interplay between fi-ame loss and assimilation of informational content
50
✚✍
I
TabIe 1 Video categories Users were instructed not to let personal bias towards the For each clip, the questions were chosen to encompass all subject matter in the clip or production-related preferences aspects of the information - audio, visual or textual {for instance the way in which movie cuts had been made) presented in the clips. In addition to this, some questions influence their quality rating of a clip. Instea& they were could only have been answered if the user had grasped asked to judge a clip’s quality by the degree to which they, pieces of both visual and audio pieces of information tiom the users, felt that they would be satisfied with a general the clip. Other questions, as will be shown later, were also purpose multimedia service of such quality. Users were chosen to see what was perceived as being the feel or the told that i%ctorswhich should influence their quality rating atmosphere of the clip. In order to be confident that the of a clip included clarity and acceptability of audio signals, results were based purely on variations in the frame rate, lip synchronisation during speech and the general “ questions were asked immediately after each clip so that relationship between visual and auditory message the information contained was still fresh in the memory of components. the participants. Lastly, although there were no ‘trick’ In our experiments, we have varied the ties per second questions as such quite a few of them could not be (fps) QoS parameter. Parameters that were kept constant answered by observation of the video alone, but by the user include the colour dept& window size and audio stream making ini?erences and deductions from the information Three tie rates were played 25, 15 and 5 fps. Although that had just been presented. these parameters varied across the eqerirnents, for a The clips themselves were chosen to cover a broad particular user they were kept constant The user spectrum of subject matter in which the following factors furthermore was kept unaware of the frame rates at -which were specflcally taken into accounti the clips were being shown to hirdher. 10 users were tested for each fi-amerate. ● spatial parameters There are two main reasons why it was decided that &e audio stream would be played with its original recorded parameters:
●
~
,
“
.——.
——
——
> ,,:
-
Overall Results
I
,
, I
Video Category
,_
,, ,
Figure 1 Percentage of Correct Answers Obtained Overall
attention was required of the~ they should view the clips in a relaxed manner, as the experiment was a data gathering exercise and not an exam. Needless to say, some users (probably among the more perfectiouis-t ones) concentrated and thought for quite long periods of time when an immediate answer would not come to mind. What also happens in such experiments is tha~ after the fwst few set of questions have been answere~ users will try and second guess the questions that might be put in subsequent clips that they see. The variely of the subject matter being shown (the fact that any subsequent clips seen will belong to different categories), as well as the fact that we had second guessing in mind when we fommlated each set of questions ensured that this approach to answering questions was successfid only for very few people and then only with a few isolated questions.
~udio, video =d te.xti information in the contex? of the clip, as well as the clynamism of the clip itself.
As t% as he subject matter itself is conceme~ the clips were chosen such that they would present the majority of users with at least a minimal amount of interes~ but not a great deal, in which case tie answers given might possibly be skewed. As an example, when it was decided on what ~pe of action sport video clip to present -weiinal.ly chose ruSby, a sport whick although most Europeans are familiar wi@ does not enjoy the widespread following and close interest of football It -would have been more likely that a user would have benefited from hislher previous Imowledge and experience of the game of football to answer correctly any questions that might have been posed Lastly, a few remarks shall be made about user behaviour during these experiments. Users were told tha~ although
Audio Information Results I 1
—— . .. ..—.
Video Categories Figure 2 Percentage of Correct ResnIts - Audio Info
1“
51 I
I I .—
1-
4. EXPERIMENTAL
RESULTS
A few interesting remarks must be made about how the users answered some of the questions. The commercial video clip, for instance, is of a washing liquid for bathrooms and depicts a couple extolling its qualities. One of the questions which was asked was what the user thought tie relationship between the couple was. The clue here was that there was a shot of the man’s hand cleaning the batbroom in which a wedding ring could clearly be distinguished. What -was, however, interesting was that 96% of the tested users said that the couple in the ad must be rnamiecl Jn all such cases, ti answer was given not because the participants had seen the -wedding ring, but because this was the way in which they had perceived the situation to be or they had feIt that this was the target market being addressed. Another remark needs to be made about the snooker video clip that was also part of our experiments. In this clip, the player pockets a red bti, however, because of the production lighting, tbe colour of the ball comes out as dark brownish. When asked what colour the pocketed ball was, very few people unfamiliar with the game of snooker actually said red Those who enjoyed the game, however, always got the answer right the motivation being that the player’s current score (displayed as textual information on the bottom of the screen) had increased by the number of points corresponding to a red ball being pocketed. The last observation concerns the manner in which users answered questions regarding the cooking clip. Here, users were asked wheher or not they had seen any forks in the clip. Most answered yes, which was the correct answer. However, the only forks that appeared in that clip were two very large ones hung on tie walls for decorative purposes. This was obsen’ed by roughly a third (30%) of the respondents who answered correctly; the re maining correct answers were due to the fact that the users had assumed
tha~ it being a cooking clip, there must naturally be forks somewhere along the line. Our results show that there is no significant difference between the percentage of correct answers given by respondents at different video flame rates. This would seem to indicate that severe &une dropping does not have a proportional impact on users’ capacity to assimilate video clip material. Indee& in some cases, the percentage of correct responses was marginally higher at lower frame rates. This could be explained by the fact tha< the complementary process of fhne dropping is one of frame replication. Due to the latter, information that might had been lost had the clip been played with its designated tlame rate, would now appear for a longer period of time (3 or even 5 times longer in the case of our experiments) on the screen. This would therefore increase the chance of the user noticing the respective information. As expecte& the lowest percentages of correct answers were given in action clips with rapidly varying scenes - the action movie, the rugby clip - or those boasting a rich diversity of inilormational content such as the pop clip. In the latter clip, for instance, in addition to the audio (of primary importancein this case) and video streams (where the body language and demeanour of the singer also tries to convey a message), textual information about the singer was regularly displayed on the screen. When clip scenes are varying rapidly, it is of course difficult to get any sort of visual information the most one can do is abstract the message of the clip. The fact that frame dropping has little impact here should no< therefore, surprise. In the case of irrformationally rich clips, what usually happens is that users cannot distribute their attention. For example, a flequent remark in the case of the pop clip was that “I was enjoying the music and wasn’t interested in the text”, which would explain why respondents got such low percentages of correct answers in this case.
i
i35fps
El ■ 15fps
❑ 25 fps
A
Figure 3 Percentage of Correct Answers - Vkual Info
:, ~
,
-.—-
Since the audio sheam is unailected by tie dropping, one would initially expect that respondents would score much better when asked about the audio content of the clip. This is, generally speaking, the case. However, there are some exceptio~ in the case of the rugby clip, -whenasked what particular feature (an ‘overlap’, clearly mentioned by the commentator) of the attacking team had made the score of a try possible, only a handfid of people got the answeq the majority of them were concentrating on the action of the game itself Similar comments apply to the pop clip when asked questions pertaining to the lyrics of the song, many people said that they hadn’t paid attention to the lyrics themselves, they -were enjoying the melody in general. This happened especially when the clip was ron at tie till 25 fps - probably people were enjoying the overall quality of the clip, without giving regard to specifics. As fin- as the satisfaction associated with media clips is conceme~ a few observations need to be made. Generally speaking, tie lower the &ame rate is, the lower the user’s satisfaction with i$ although the variation is not linear. Users seem to have enjoyed the animated clip at the exTense of assimilating the da% a similar remark can be made about the rugby clip. As far as users’ perception of dynamism goes, this latter clip and the action movie received similar across the board satisfaction ratings. As concerns the news clip, users were annoyed at the newscaster’s visib]s lack of lip synchronisation and thus, even though it was a static clip, only gave it average values as fir as satisfaction is concerned. Users then essentially treated the bulletin as an audio broadcast proof being the consistently high percentages of correctly answered questions related to the audio clip of this particular clip. Lastly, one can remark that in the case of information rich media such as the pop music clip, users tend to discriminate drastically according to the perceived quality of the presentation there being a strong dependency between the perceptual satisfaction and the displayed fi-amerate.
fi-ame is visible for onIy 0.04 see, whereas at 5 fps a frame is visible for 0.2 see), hence absorbing more tiormation. This observation has implications on resource allocation. ●
Users have difilculty in absorbing audio, visual and textual information concurrently. Users tend to focus on one of these media at any one momen~ although they may s-witch between the different media. This implies that critical and important messages in a multimedia presentation should be delivered in only one type of mediq or, if delivered concurrently, should be done so with maximal possible quality.
●
The link between perception and understanding is a complex onq when the cause of the annoyance is visible (such as lip synchronisation), users will disregard it and focus on the audio message if that is considered to be contextually important.
●
Highly dynamic scenes, although expemive ~ resources, have a negative impact on user understanding and information assimilation. Questions in this category obtained the least number of correct answers. However the entertainment value of such presentations seem to be consisten< irrespective of the frame rate at which they are shown. The link between entertainment and content understanding is therefore not direct and this is &rther confirmed by the second observation above.
*
All these results indicate that Quality of Service, typically specified in technical terms such as end-to-end delay, must also be specified in terms of perception, understanding and absorption of content if multimedia presentations are to be truly effective.
6. ACKNOWLEDGMENTS Gheorghita Ghinea is sponsored in his work by the Reading University Scholarship Trust Fund. A thanks also goes to Roberto Fraile who helped in the set-up and execution of some of the experiments.
5. CONCLUSIONS Instead of the traditional technical definition of QoS, this paper defines QoS from the user’s standpoint In our view this is comprised of a user’s perception of mnki.media presentations together with the benefit of such presentations horn a user’s angle in terms of content assimilation and understanding. The main conclusions drawn horn dis work maybe summarised as follows: ●
.:-J.-7... .-.
7. REFERENCES [1] Apteker,
R.T., Fisher, J.A., Kisimov, V.S., and Neishlos, H. Video Acceptability and Frame Rate. IEEE Multimedia, 2(3), Fall 1995,32-40
[2] Fukuda, K., Wakamiya, N., Murata, M., and Miyahara, H. QoS Mapp~g bemeen User’s Preference and Bandwidth Control for Video Transpo@ in Proceedings of the 5ti International Workshop on QoS (IWQOS), New York USA, May 21-23, 1997,291301
A significant loss of ties (that is, reducing the frame rate) does not proportionally reduce the user’s understanding and perception of the presentation. In fact in some instances (s)he seemed to assimilate more information%thereby resulting in more correct answers to questions. This is because &e user has more time to view a fi-ame before the flame changes (at 25 fps, a
[3] Ka-walelqJ. A User Perspective for QoS Management in Proceedings of the QoS Workshop aligned with the 3ti Intematioml Conference on Intelligence in
53
I
—
.-.
L
[5] van den Branden Lambrech~ C.J., and Verscheure, O. Perceptual Quality Measure using a Spatio-Temporal Model of the Humau Visual Syste~ ti-Proceedings of the SPIE, vol. 2668, San Jose, CA, January 28 February 2,1996,450-461
Broadband Services and hTetsvork@3&N 95), Crete, Greece, 16 September 1995 Steinmez R Human Perception of Jitter and Media $mchronisatio~ IEEE Journal on Selected Areas in Communications, 14(1), January 1996,61-72
‘
,
54