Qualitative models on stream ecosystem recovery: exploratory studies Paulo Salles1, Bert Bredeweg2 and Symone Araújo1 1Universidade de Brasilia, Instituto de Ciências Biológicas Campus Darcy Ribeiro, Brasilia - DF, 70.910-900, Brasil E-mail: {psalles, symone}@unb.br 2University of Amsterdam, Department of Social Science Informatics Roetersstraat 15, 1018 WB Amsterdam, The Netherlands E-mail:
[email protected]
Abstract Most of water ecosystems are endangered by human actions, in spite of their importance for all living systems. Qualitative models and simulations may be useful for stream ecosystem recovery in many ways: for understanding such systems, to predict values of variables and to combine such understanding with restoration and proactive actions of management. This study describes the development of qualitative simulation models about the effects of pollution by organic matter and its consequences on the amount of dissolved oxygen and mortality of fishes. We present simulations of good and bad management practices, that may result in increasing and reducing fish stocks. Problems we found and solutions we implemented during the modelling effort are discussed, including the explicit representation of assumptions and the role of ambiguities in the outcomes of the models. We argue that new ontologies and qualitative domain theories will be required in order to tackle processes are related to both energy flow and nutrient cycling and to represent complex interactions between physical, chemical and biological phenomena.
Introduction
in a river community under the effects of pollution by sewage. Solid material settles to the bottom and is decomposed by microrganisms. Their aerobic respiration depletes dissolved oxygen in the water and may cause mortality of fish. This is a well known problem, described in textbooks such as Smith & Smith (1998). However, integrated models covering the wide range of aspects of river ecosystems are difficult to build because of partial understanding of the community structure and functioning and fragmented data available. Qualitative Reasoning (QR) may be useful in such situations. In this paper we describe exploratory studies about the use of qualitative models on water resource management. A previous version of the model described here was used for didactic purposes in a workshop1 during which the use of Qualitative Reasoning (QR) techniques for representing aspects of stream ecosystem recovery was discussed with experienced researchers.
Rivers and other water bodies are complex systems of interest because, in spite of their recognized importance for all living systems, they suffer from damage caused by human actions. Rivers present, from the headwaters to their mouth, a continuous gradient of changing environmental conditions. This gradient could be associated to a continuum of biotic adjustments and typical communities are formed. One of the most accepted frameworks for integrating physical and biological features of river systems concerning their structure, function and stability is the River Continuum Concept. Based on energy equilibrium theories, this concept hypothesize that producer and consumer biological communities become established in harmony with the dynamic physical conditions of the channel (Vannote et al., 1980).
We describe here the model building process, difficulties found and solutions we have adopted. We also discuss what the participants of the QRSER workshop think about using qualitative models to support research, decision making, education and training in water ecology. Initially we present details about the problems caused by sewage pollution. The model building process is discussed and two simulations are described in the following sections. Next, we comment the use of qualitative models and simulations in water ecosystem recovery, according to the perception of ecologists. Finally, we discuss related work on qualitative representation of ecological problems in water systems and present our concluding remarks.
Pollution may change dramatically this dynamic equilibrium of the river continuum, and influence, for instance, community composition. This paper describes a model developed to represent changes
1
First Workshop on Qualitative Reasoning and Stream Ecosystem Recovery (QRSER), held in Jena, Germany, 6-8 March 2003. For details, please visit www.qrser.de
The problem Water bodies are normally poor in dissolved oxygen, due to its low solubility in water. Oxygen concentrations in the atmosphere, for example, are 30 times higher than concentrations in water bodies. Therefore, any environmental change or increased levels of consumption may cause significant changes in dissolved oxygen concentrations in water bodies. This knowledge can be used to assess pollution and the capacity of selfdepuration in water bodies (Von Sperling, 1996). Introduction of organic matter in a water body influences, directly or indirectly, the consumption of dissolved oxygen. In fact, from the ecological point of view, the reduction in dissolved oxygen concentration is the worst effect of water pollution by organic matter. This is due to the activity of decomposers, organisms involved in stabilization processes of organic matter. These organisms use available dissolved oxygen as input for their respiration process, a general cellular mechanism that releases energy. The impact of such pollution affects the whole biological community, and the reduction of dissolved oxygen is selective for some fish species. For example, under low concentrations of dissolved oxygen or under anaerobic conditions (in which there is no dissolved oxygen), fish mortality increases. Sources of oxygen in a river are re-aeration (oxygen that enters the water from the atmosphere), transportation from effluents and tributaries, and the biological process of photosynthesis. The most important sinks are chemical reactions in water (oxidation of organic matter) and the biological process of respiration (found in all living organisms, including plants, animals, microrganisms and decomposers). Given those sources and sinks, the balance equation for dissolved oxygen in a segment of a river with constant volume (Tchobanoglous & Schroeder, 1985, Thomann & Mueller, 1987) may be presented as follows: d(DO)/dt = [A–OMox] + [P–R] + [Tin – Tout ] in which A is re-aeration, OMox is Organic Matter oxidation, P is photosynthesis, R is respiration, Tin is transport in to the system and Tout is transport of dissolved oxygen out of the system. Assuming that the components [A – OMox] and [Tin – Tout ] are constant, changes in dissolved oxygen are due to the biological processes of photosynthesis and respiration. Under these assumptions, pollution by sewage will enforce respiration and therefore will cause lower levels of dissolved oxygen and higher mortality of fish. Management actions may reduce the negative effects of sewage pollution. The model
described here shows how good and bad management actions eventually affect fish mortality.
The model building process We adopt the process-oriented ontology (Forbus, 1984) to build the model. Changes in the system are always initiated by processes and their effects may propagate to the whole system via causal dependencies. Two modelling primitives are central in this representation: direct influences (I+ and I–) and qualitative proportionalities (P+ and P–). Both direct influences and proportionalities express mathematical functions and causal dependencies. The former indicates how the rate of a process is used to calculate the derivative of a state variable. For example, the notion that the photosynthesis rate (Photo_rate) sets the value of the derivative of dissolved oxygen (Oxygen) is modelled as I+(Oxygen, Photo_rate). Qualitative proportionalities represent indirect influences of processes on quantities other than state variables. They represent unknown or undefined monotonic functions that relate the derivatives of two quantities. For example, P+(Growth_rate, Oxygen) describes the way oxygen cause changes on fish population: when dissolved oxygen increases, fish growth rate also increases, and when dissolved oxygen decreases, fish growth rate also decreases. Values of the quantities are represented by the pair magnitude and derivative () and the qualitative values they may assume are represented in an ordered set called the Quantity Space (QS). In the model described here, for example, the magnitude of quantities Amount_of fish and Oxygen can assume values in QS = {low, medium, high}, and all the derivatives can assume values in QS = {minus, zero, plus}. The models were implemented in the qualitative reasoning engine GARP (Bredeweg, 1992)GARP (Bredeweg, 1992), a simulator that has been used in different domains, including population and terrestrial community ecology (for example, Salles & Bredeweg, 1997; Salles et al., 2002). In this modelling effort we used HOMER (Jellema, 2000; Bessa Machado & Bredeweg, 2002) a graphical interface that facilitates the model building activity. The simulations were run in GARP and inspected with model visualization tool VisiGARP (Bouwer & Bredeweg, 2001).
Specifications of the model The model includes entities (objects) that represent a segment of the ‘river’, viewed as a ‘container’ that contains ‘biological entities’. There is also a (human) ‘manager’, that ‘performs a task’ (human action), namely ‘pollution control’ in the river.
Relevant properties of these entities are represented as quantities. For example, the river contains substances represented by the quantities Nutrient, Organic Matter and Oxygen. It is assumed that these substances always exist, although their values may increase or decrease. Their magnitudes are values in the interval QS = {plus}. The amount (mass) of aquatic plants, decomposers and fish are modelled by the quantity Amount_of, with QS = {low, normal, high}. Processes may change the values of these quantities. The amount of decomposers may change due to the aggregated process ‘Decomposer growth’, a combination of all the processes that increase their mass (such as the assimilation of digested organic matter and increase in the number of individuals due to reproduction), and processes that reduce their mass (such as excretion, loss of part of their bodies and mortality). Similarly, the mass of fish may change due to the process ‘Fish growth’. Rates of these processes are calculated as [mass input – mass output]. Growth of aquatic plants (which includes both phytoplankton and rooted plants) may be described by the process ‘Plant growth’, that is seen as the balance of photosynthesis and respiration processes. The rate is therefore calculated as Net production rate = [Photosynthesis rate – Respiration rate]. All the rates have QS = {minus, zero, plus}. For example, when Net production rate has value minus, photosynthesis is smaller than respiration, the mass of plants is decreasing and so is the dissolved oxygen in water. Actions of management (controlling pollution) are modelled by means of the quantity Control. This quantity is also a rate, representing an aggregated of processes taken in order to control pollution. Note that Control does not represent a decision of a particular manager but the balance between management actions that control pollution and activities that increase it. Control may assume the values QS = {minus, zero, plus}. For example, when Control = minus, positive actions are being relaxed and activities that increase pollution are stronger, so that the quantity of organic material in the river will increase. It is therefore a bad management practice.
The library of model fragments The library consists of 11 model fragments (MF). The most general is the MF ‘River’, a view that describes static features of the system. This MF presents the three quantities associated to the river (Organic matter, Nutrient and Oxygen). It is assumed that there is a correspondence between the quantity spaces of Organic matter and Nutrient. It does not mean that the two quantities have equal
numerical values, but that values labelled low, normal or high of one quantity correspond to the same qualitative values of the other quantity. The MF also includes an indirect influence of Organic matter on Nutrient, captured as a qualitative proportionality P+(Nutrient, Organic Matter), meaning that when organic matter is increasing or decreasing, nutrients change in the same direction. Three processes are described by means of seven MF. The MF ‘Net effect photosynthesis and respiration’ includes the MF ‘River’ and the configuration of the entities show that the river contains aquatic plants. The Net production rate is a direct influence on both the amount of plants and the dissolved oxygen. This is modelled as I+(Amount_of plant, Net_production rate) and I+(Oxygen, Net_production rate) . There is a positive feedback loop from the amount of plants to the rate, showing that when the amount of plants increases, the rate also increases: P+(Net_production rate, Amount_of plant). In order to simplify the simulations, reducing ambiguities in the model and therefore the number of possible states, it is assumed that the derivatives of both quantities Amount_of plant and Net_production rate are equal. In the model described here, respiration is explicitly represented only for decomposers, although virtually all living things have this process as a mechanism for obtaining energy. In order to characterize the aerobic environment, we set the value of Decomposer growth rate as smaller or equal to Net production rate. Relations between fish population processes and dissolved oxygen are captured in the MF ‘Fish oxygen requirement’. There is a direct influence (I+) of Fish growth rate on the Amount of fish imposed by a process and a positive feedback loop from the amount of fish to the rate. The influence of dissolved oxygen on fish population is represented by P+(Fish_growth_rate, Oxygen). Two other assumptions are represented in this MF: one defines that the amount of dissolved oxygen in water is greater or equal the amount of fish and the other establishes a correspondence between the qualitative values medium of these two quantities. An additional MF concerning fish growth rate was introduced in the library in order to simplify the simulations. As with the plant component, the MF ‘Simplify fish oxygen requirement’ implements the assumption that the derivatives of both quantities Amount_of fish and Fish_growth_rate are equal. Central to this model is the notion that when organic matter is increasing, the Decomposer growth rate is also increasing, and as a consequence dissolved oxygen is reduced. These
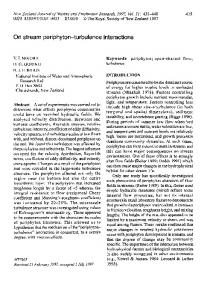
Figure 1: The full simulation of a good management practice, and the value history diagram of four quantities in the sequential states [2,7,9].
concepts are captured in the MF ‘Organic matter oxidation’. Here Decomposer growth rate is a positive direct influence (I+) on the amount of decomposers, and negative direct influences (I–) on Organic matter and Oxygen. It is assumed also that the growth rate receives an indirect influence from the amont of decomposers, modelled as a P+. Finally, we modelled management actions by using a special kind of MF, the agent models (Bredeweg, 1992). The most general MF is called ‘Pollution control’ and represents a human manager of the river who performs a task, keeping pollution under control. Associated to the entity ‘Manager’ there is the quantity Control, a rate that directly and negatively influences the quantity Organic matter in the river: I–(Organic matter, Control). This MF has two MF as subtypes: ‘Effective control’ and ‘Non effective control’. The former sets the values of magnitude and derivative of quantity Control in < plus, zero > that is, control is on and constant (a good management practice). As a result, the amount of organic matter in water will decrease. In MF ‘Non effective control’ the values of Control are set in < minus, zero > and organic matter in water will increase.
Simulations and results Starting a simulation with all the Amount_of quantities equal to < normal,? > and Control equals to , it is expected a decrease of the amount of organic matter in the river. As a consequence, decomposers will decrease and will consume less dissolved oxygen. The amount of Oxygen may then increase. Given that it has a
Figure 2: Causal dependencies in state 9 of a good management practice simulation.
positive influence on Fish growth rate, fish is likely to increase as well. The full simulation has 17 states, with three initial states ([1,2,3]) and two end states ([8,9]). Figure 1 shows the full simulation and the value history diagram of four quantities (the mass of fish, oxygen, plants and decomposers) in the behaviour path through the states [2] Æ [7] Æ [9]. There is no state in which decomposers become greater than the plants and the fish; also, it does not happen that oxygen decreases while fish increases.
Figure 2 shows how causality flows over the
Figure 3: Initial scenario of a simulation representing a bad management practice.
system structure. It represents the causal model in state 9 of the simulation shown above. Boxes represent the quantities, their quantity spaces and their current values. Triangles represent the values of derivatives (the quantity is increasing or decreasing) and black balls represent derivatives equal to zero (the quantity is stable). Quantities ‘amount_of 1,2,3’ represent, respectively, biomass of plant, decomposer and fish components. For example, at the left hand side of the figure ‘control1’ has value < plus,zero > and triggers the causal chain. Note that, after resolution of direct and indirect influences, the quantities ‘organic matter1’ and ‘nutrient1’ become stable, while ‘oxygen dissolved1’ has value high and is increasing, the mass of decomposers (‘amount_of2’) is low and is decreasing, and the mass of fishes (‘amount_of3’) is high and is increasing.
Simulating a bad management practice Now imagine a situation in which, for some reason, the result of the management actions turn out to be a bad management practice. This can be modelled as if there was a ‘negative’ control action on pollution, with opposite effect on the system (Control = < minus, zero >).
It is expected that the system will exhibit more complex behaviour and a bigger state-graph, giving that there will be more organic matter on the water and less constraints for decomposers to grow. Figure 3 shows the MF that represents an initial scenario for a bad management practice simulation. Note that the initial values of some quantities are defined here and the Bad management assumption is represented as a label for selecting model fragments during the simulation. This simulation produces 69 states, with different combinations of values of the 10 quantities included in the model. As expected, the (non sequential) end states [62,63,64,65] represent a situation in which the amount of fish has value low, following dissolved oxygen (Figure 4a). A sequence like [1] Æ [54] Æ [65] shows the expected behaviour of organic matter, oxygen and amount of fish (Figure 4b). The 69 states created during the simulation predict what is expected from a river being polluted by organic matter without control: organic matter increases, and as a consequence decomposers also increase. Given the causal link between organic
matter and nutrients, and between nutrients and net production in plants, an increase in the amount of dissolved oxygen is also expected. However, this situation may change as soon as decomposers start growing. Decomposers put contrary influences on many quantities. They reduce the amount of organic matter, contrary to the positive effect of pollution on this quantity. Simultaneously, decomposers consume dissolved oxygen, contrary to the net production by plants in aerobic conditions (as assumed by the model). Influence resolution under these conditions is not an easy task because there is a great number of ambiguities. Unless explicit assumptions are introduced in the model, the qualitative simulator GARP will try all the possible combinations.
Figure 4: Selected states of a bad management practice simulation. (a) Final states of the simulation; (b) a selected behaviour path.
As a result, the simulation produces states representing all the possible qualitative situations of the system: (a) both dissolved oxygen and amount of fish have value normal; (b) both dissolved oxygen and amount of fish have value high; (c) dissolved oxygen has value high and amount of fish has value normal; and (d) both dissolved oxygen and amount of fish have value low. Note that the ‘forbiden’ combination (the fish component going to high while dissolved oxygen goes low) was not found in the behaviour graph.
The use of qualitative models in water ecology River ecologists are interested in alternative approaches to ecological modelling because traditional approaches, mostly based on mathematical equations, may be inadequate to implement ideas such as those expressed by the River Continuum Concept. Perhaps the most important aspect is that river ecologists need to develop conceptual models in order to represent their knowledge and to understand the systems they
are dealing with. As pointed out by one of the participants of QRSER, “conceptual thinking is the only way to understand ecology”. Some features of QR models may enhance research and applications in stream ecosystem recovery. The group in QRSER mentioned a rich vocabulary that support communication among researchers and between them and the public; modelling primitives that may be useful for developing a classification of different types of ecosystems; a compositional modelling approach (Falkenhainer & Forbus, 1991) that allows for reusability of model fragments and the possibility of combining ‘simpler’ models to scale up for more complex problems; and explicit representations of causality that can support explanations about system’s structure and behaviour. The participants of the QRSER believe qualitative models have a role to play in research, decision making, management and education and stressed the point that these models may be important for speeding the implementation of new European and Brazilian legislation and directives for water management, that require decentralization (for example, using the river’s catchment area as a territorial unity for management actions), participation (that is, the involvement of the whole society in the decision making process) and integration of the multiple uses for achieving the sustainable use of water resources.
QR and water related ecological problems QR techniques have been used in hydro-ecological modelling with encouraging results. After initial tentatives of representing qualitative knowledge about water resources by Antunes et al. (1987) and Câmara et al. (1987), a more comprehensive work was developed by Guerrin (1991). In this work, he describes applications in management of hydroecological systems using combinations of linguistic observations, measurements, and analytical results by using a qualitative algebra. Empirical knowledge gained by freshwater ecologists on the functioning of salmon spawning areas and its impact on mortality in early stages was the basis for qualitative models built by Guerin & Dumas (2001a; b). Their models are qualitative representations of ordinary differential equations implemented in the qualitative simulator QSIM (Kuipers, 1986) for making predictions on the survival rate of salmon under various scenarios. Their approach also introduces a real time dating and duration in a purely qualitative model. The whole model is decomposed into two parts, each part representing processes that occur at different
time-scales (fast and slow). Output shows the behavior of variables of interest in different situations. For example, the mortality rates influenced by oxygenated water and plugging of gravel interstices near the bed surface. A different approach was taken by Heller & Struss (1996), who describe qualitative models involving spatial distribution of parameters and processes in hydro-ecological systems. Struss & Heller (1998) have developed a processes oriented approach to model – based diagnosis, which was applied to problems in water treatment plants (Heller & Struss, 2002).
Discussion and concluding remarks Modelling the wide array of physical, chemical and biological aspects of stream ecosystems put a number of challenges both for the QR and ecological modellers communities. Some were approached in the study described in this paper. We describe simulation models that represent a river being polluted by sewage and the consequent increased mortality of fishes. A causal structure assures that management controling measures influence the organic matter in water and that this effect will propagate to nutrients, dissolved oxygen, plants, decomposers and fishes. Two simulations are presented, showing how good and bad management practices may be used to control fish stocks in the river. As expected, good management reduces the number of possible states produced during the simulation, whereas bad management leads to a high number of possible behaviour paths. We discuss the use of simplifying assumptions, explicitly represented in model fragments, as a solution to reduce the number of states. Ambiguities due to contraditory influences are also discussed and explain the system’s behaviour. These exploratory studies indicate some challenges for the development of qualitative theories of water ecosystems. Compared to the qualitative theory of population dynamics also implemented in GARP (see Salles & Bredeweg 1997; Salles & Bredeweg 2001; Salles et al., 2002) there are some points worth to mention in this discussion. Water ecosystems result of strong interactions between biological, physical and chemical phenomena. In our model, for instance, oxygen is a limiting factor for biological communities. The result is a complex network of influences that simultaneously affect the energy flow and cycling of nutrients. It is clear for us that, if basic population processes, like natality and mortality, have their effects on ‘things’ of the same nature (for example, natality of trees increases the number of trees), processes like photosynthesis
and respiration produce effects on matter and energy. In fact, we modelled the influences from processes Net_production of plants and respiration of decomposers both on dissolved oxygen and on the amount (mass) of plants and decomposers. Dissolved oxygen is related to energy storage (due to photosynthesis) and release (due to respiration), while mass is related to producing organic material (in photosynthesis) and with consumption of that material (in respiration). It seems that the way ecologists usually think about processes photosynthesis and respiration carries a mixture of concepts involving matter and energy. These processes are complex and qualitative theories involving these two processes may require the development of specific ontologies. We argue that a robust qualitative theory of water ecosystems representing energy flow, nutrient cycling and aquatic population and community dynamics will use three ontologies, the number_of ontology already implemented (Salles & Bredeweg, 1997) and those we called energy_of and amount_of. Ongoing work includes the development of the energy_of and amount_of ontologies, implementation of basic processes of photosynthesis and respiration and more complex representations of ecological systems. We believe that the use of QR models in stream ecosystem recovery and other water-related ecological phenomena have the potential to become a major breakthrough in modelling for research, management, training and education. Acknowledgements We would like to thank the participants of the QRSER for their comments and enlightening discussions. Paulo Salles and Symone Araújo were partially supported by the Brazilian CNPq - CTHIDRO Fund, process number – 055119/2002-7. References Antunes, M.P.; Seixas, M.J.; Câmara, A.S. & Pinheiro, M. (1987) A New Method for Qualitative Simulation of Water Resource Systems. 2. Applications. Water Resources Research 23:2019-2022. Bessa Machado, V. & Bredeweg, B. (2002) Investigating the Model Building Process with HOMER. Proceedings of the International workshop on Model-based Systems and Qualitative Reasoning for Intelligent Tutoring Systems, pages 1-13, San Sebastian, Spain, June 2nd, B. Bredeweg (editor) Bouwer, A. & Bredeweg, B. (2001) VisiGarp: Graphical Representation of Qualitative Simulation Models. In J.D. Moore, G. Luckhardt Redfield, and J.L. Johnson (eds.), Artificial Intelligence in Education: AI-ED in the Wired and Wireless Future, pp. 294-305, IOS-Press/Ohmsha, Osaka, Japan.
Bredeweg, B. (1992) Expertise in Qualitative Prediction of Behaviour. PhD thesis. University of Amsterdam, Amsterdam, The Netherlands. Câmara, A. S.; Pinheiro, M.; Antunes, M. P. & Seixas, M. J. (1987) A New Method for Qualitative Simulation of Water Resource Systems. 1. Theory. Water Resources Research 23: 2015-2018. Falkenhainer, B. & Forbus, K. (1991) Compositional modeling: Finding the right model for the Job. Artificial Intelligence, 51(1-3):95-143.
Smith, R.L. & Smith, T.M. (1998) Elements of Ecology. Addison Wesley Longman, San Francisco, CA, 4th edition. Struss, P. & Heller, U. (1998) Process-oriented modeling and diagnosis: Revising and extending the theory of diagnosis from first principles. In Working Notes of the Ninth International Workshop on Principles on Diagnosis (DX'98), pages 110-117, Sea Crest, Cape Cod, USA.
Forbus, K.D. (1984) Qualitative process theory. Artificial Intelligence, 24:85–168.
Tchobanoglous, G. & Schroeder, E. D. (1985). Water Quality – Characteristics, Modelling, Modfication. Addison-Wesley Publ. Co., EUA.
Guerrin, F. (1991) Qualitative Reasoning about an Ecological Process: Interpretation in Hydroecology. Ecological Modelling 59: 165-201.
Thomann, V.R. & Mueller (1987). Principles of surface Water Quality Modeling and Control. Harper & Row Publishers, EUA.
Guerrin, F. & Dumas, J. (2001a) Knowledge representation and qualitative simulation of salmon reed functioning. Part I: qualitative modelling and simulation. BioSystems 59:75-84.
Vannote, R.L.; Minshall, G.W.; Cummins, K.W.; Sedell, J.R. & Cushing, C.E. (1980) The River Continuum Concept. Can. J. Fish. Aquat. Sci. 37: 130-137.
Guerrin, F. & Dumas, J. (2001b) Knowledge representation and qualitative simulation of salmon reed functioning. Part II: qualitative model of reeds. BioSystems 59:85-108. Heller, U. & Struss, P. (1996) Transformation of Qualitative Dynamic Models - Application in HydroEcology. In Iwasaki, Y. & Farquhar, A. (eds.) Proceedings of 10th. International Workshop on Qualitative Reasoning (QR’96). AAAI Technical Report WS-96-01. Heller, U. & Struss, P. (2002), Consistency-Based Problem Solving for Environmental Decision Suport. Computer-Aided Civil and Infrastructure Eng., 17(8992). Jellema, J. (2000) Ontwerpen voor ondersteuning - De rol van taakkennis bij ondersteuningsontwerp. Master thesis, University of Amsterdam, Amsterdam (in Dutch). Kuipers, B. (1986) Qualitative Simulation. Artificial Intelligence 29:289-338. Salles, P. & Bredeweg, B. (1997) Building qualitative models in ecology. In: L. Ironi (Ed.) Proceedings of the 11th. International Workshop on Qualitative Reasoning (QR’97). Pages 155-164, Instituto di Analisi Numerica C.N.R., Pubblicazioni no. 1036, Pavia, Italy. Salles, P. & Bredeweg, B. (2001) Constructing Progressive Learning Routes through Qualitative Simulation Models in Ecology. In Biswas, G. (ed.) Proceedings of the 15th. International Workshop on Qualitative Reasoning (QR’01). Saint Mary’s University, San Antonio, TX, USA. Salles, P., Bredeweg, B., Araujo, S. & Neto, W. (2002) Qualitative models of interactions between two populations. In: N. Angell & J. A. Ortega (Eds.) Proceedings of the International workshop on Qualitative Reasoning, (QR'02), pages 143-150, Sitges - Barcelona, Spain, June 10-12, 2002.
Von Sperling, M. (1996) Introdução à qualidade das águas e ao tratamento de esgotos. 2 ed. – Belo Horizonte, Departamento de Engenharia Sanitária e Ambiental; Universidade Federal de Minas Gerais.