Rapid Estimation Method for Data Capacity and Spectrum Efficiency in Cellular Networks C.F. Ball, E. Humburg, K. Ivanov, R. Müllner Siemens AG, Communications Mobile Networks Munich, Germany
[email protected] Abstract — System level simulations for deriving data capacity and spectrum efficiency of cellular wireless networks require complex modeling and a considerable computational effort. In this paper a combined analytical / geometric approach has been proposed allowing rapid performance estimation in cellular packet data networks. This is accomplished by mapping measured or simulated link level curves onto measured or simulated cell C/I distributions. Two different scenarios have been studied related to two generic traffic models widely used in the literature. The first traffic model assumes a fixed average packet data call duration whereas the second one assumes a fixed average packet data volume per subscriber. Based on these models the first scenario provides very optimistic while the second one more pessimistic performance results. Both GSM/EDGE and the upcoming new IEEE 802.16 WiMax system have been studied in 1x3 frequency reuse, showing a considerable difference of nearly 50-60% in terms of spectrum efficiency between both traffic models. The comparison of WiMax with GSM/EDGE reveals a moderate performance advantage for the new broadband OFDM system in the order of 20-40% higher spectrum efficiency. Keywords — Spectrum Efficiency, Performance, IEEE802.16, WiMax, EDGE
I.
INTRODUCTION
A combined analytical / geometric method for rapid estimation of the packet data channel capacity and spectrum efficiency in cellular wireless systems is introduced. The proposed method has been applied to two scenarios corresponding to two generic traffic models leading to totally different performance results. The first scenario assumes equal packet call duration for all subscribers. In cellular environment this leads to considerably different data volumes transferred during the fixed time interval since subscribers under good radio conditions enjoy considerably higher data rate than subscribers under poor radio conditions. The resulting cell throughput and consequently the spectrum efficiency are too optimistic. In reality such user behavior might be justified in cases, where subscribers just spend a certain fixed time period e.g. with web-browsing in the Internet. The second scenario assumes an equal data volume per subscriber. Such user behavior is observed e.g. with download applications such as FTP service or Audi-Video-Streaming in drive tests. In this case subscribers under poor radio conditions with low data rate occupy radio resources disproportionately leading to too pessimistic capacity and spectrum efficiency results. Obviously in a real system implementation a certain mixture of both traffic models is expected inducing performance results in between those provided by the studied
traffic models. The proposed method is based on geometric mapping of the measured or simulated link level performance curves on the measured or simulated cell C/I distribution. Approximating the link level curves by stair-case functions simplifies the analytical formulas used in the performance analysis. Detailed results for GSM/EDGE [1], [2] as well as for broadband IEEE 802.16 MAN (WiMax, [3], [4]) are provided. However, there are some factors like power control, admission control as well as specific scheduling techniques, which cannot be taken into account by the proposed analytical method. But at full system load downlink power control has only minor influence on the cell C/I Cumulative Distribution Function (CDF). Admission control blocks subscribers under very poor radio conditions avoiding allocation of channel resources in case of bad radio conditions. Furthermore the spectrum efficiency can be significantly affected by means of sophisticated scheduling techniques. For example a maximum C/I scheduler gives preference to subscribers under good radio conditions at the expense of those under moderate radio conditions thus increasing cell throughput and spectrum efficiency whereas a proportional fairly weighted scheduler improves the throughput of subscribers under poor radio conditions thus degrading the overall spectrum efficiency. The paper is structured as follows. Section II describes the theoretical background used for derivation of analytical formulas for the two scenarios under study concerning channel capacity and spectrum efficiency. In Section III a GSM/EDGE system deployed in 1x3 frequency reuse has been analyzed based on measured link level and simulated C/I CDF. Section IV presents the data capacity and spectrum efficiency achieved by a state-of-the-art IEEE 802.16 WiMax system assuming the same frequency reuse, simulated link level and simulated C/I CDF. Finally the main conclusions are drawn in Section V. II.
THEORETICAL BACKGROUND
A. Spectrum Efficiency In a cellular network the spectrum efficiency η given in [bps/Hz/cell] is defined by: CCell CCH (1) η= = r ⋅ BCH ⋅ N CH r ⋅ BCH with CCell the cell/sector throughput in [kbps], NCH the number of configured channels per cell, BCH the channel bandwidth in [kHz] and r the frequency reuse. The cell throughput CCell is the total of the NCH individual channel throughputs CCH. In a cellular radio network radio frequency channels are allocated to cells with a certain reuse factor r characterizing
Channel Throughput [kbps]
MCS3
F3 f3(x)
g(x)
MCS2
MCS1 Channel Throughput [kbps]
MCS2
MCS1
F2 f2(x)
F1
MCS3
F3 f3(x) h2(x); ε2 > 0
F2
h3(x); ε3 = 0 f2(x)
F1
f1(x)
f1(x) h1(x); ε1 > 0
x2
x3
x3
x2
C/I = x [dB]
C/I = x [dB]
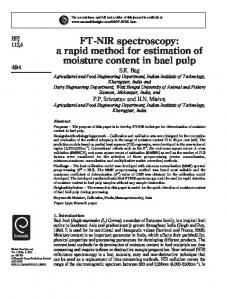
Fig. 1. Example for a link level performance with three MCS.
Fig. 2. Approximation of fi(x) by step function hi(x).
the robustness of the system against co-channel interference. The quantity used to describe the quality of the radio link is the Carrier-to-Interference-Ratio (C/I) given in dB. Depending on the multiple access scheme of the radio technology deployed in the network a radio frequency channel features a well defined structure fixed by the standard. Typically the structure of the radio frequency channel reflects the way it is designed to accommodate one or multiple communication channels, in the following termed channel. Typically a channel consists of e.g. TDMA timeslots and frames carrying resource units. A GPRS/EDGE Packet Data Channel (PDCH) carries a radio block, a WiMax OFDM frame consists of OFDM symbols. The resource units are assigned by a scheduler to different users multiplexed on the same channel in the cell. Typically the resource units for an individual user are associated with a certain modulation and coding scheme (MCS) experiencing a certain error rate ε(C / I ) depending on the quality of the individual radio link. Link Adaptation (LA) is usually applied to adjust the MCS to the varying radio conditions maximizing the user throughput. Hence in general each particular resource unit of the channel carries different payload. The total channel capacity (channel throughput) is the ratio of the average effective (related to ε ) payload of the channel resource units and the transmission time per resource unit. Obviously the highest channel throughput and consequently the highest spectrum efficiency is obtained in a system with 100% channel utilization, i.e. all resource units of the channel are permanently busy carrying traffic data.
C / I = x. LA automatically selects the most suitable MCS for certain C (t ) / I (t ) = x(t ) at time instant t for a particular radio link thus providing optimum throughput even for a time varying channel [5]. The optimum throughput curve is given by the envelope of all f i (x) :
B. Link Level Performance State of the art multi-rate systems support different modulation and coding schemes MCSi with i=1,…,M. Fig.1 shows an example with three MCS. Let’s define a function f i (x) describing the throughput of a channel exploiting MCSi at a carrier to interference ratio C / I = x[dB] assuming 100% channel utilization. The function f i (x) can be written as: f i ( x) = Fi ⋅ (1 − εi ( x ))
(2)
with Fi the nominal throughput ( ε i ( x → ∞) ) of a channel utilizing MCSi and εi (x) being the error rate of MCSi at
(3) g ( x) = max{ f i ( x)} , i = 1,…., M . There are (M – 1) switching points xi due to LA corresponding to the intersection points of the functions f i (x) : f i −1 ( xi ) = f i ( xi ) , i = 2,…, M. (4) Hence according to LA, MCSi is in use in a C/I range of xi ≤ x < xi+1, i = 2,…,M. Since by this notation both the lower bound for MCS1 and the upper bound for MCSM are not specified in the following it is assumed that MCS1 is used from x2 down to some limited lower C/I value while MCSM is used from xM up to an arbitrary high C/I. To facilitate further analytical approach let’s introduce the ‘virtual’ switching points x1 → −∞ and x M +1 → +∞ , defining the lower bound for MCS1 and the upper bound for MCSM, respectively. To allow for simple calculations each function f i (x) , i = 1,…,M reflecting the channel throughput utilizing coding scheme MCSi has been approximated over the respective C/I interval xi ≤ x < xi+1, i = 1,…, M by a step (Heaviside) function hi (x) as follows (refer also to Fig. 2): hi ( x ) = Fi ⋅ (1 − ε i ) = H i = const.
for x ≥ xi and
hi ( x) = 0
for x < xi.
(5)
Obviously the accuracy of approximation in (5) and hence the value of Hi strongly depends on the constant error rate εi chosen to represent the real one over the relevant C/I interval for the respective MCS. As suggested by Fig. 2 the best approximation result will be achieved using the expectation value (average error rate ε i , refer to Section D) of ε i (x) over the interval xi ≤ x < xi+1. C. Cell C/I Distribution Fig. 3 illustrates an example for a CDF of C/I obtained by system level simulations for a hexagonal cell deployment in 1x3 reuse (r = 3) at 100% channel utilization. The CDF
conventional voice traffic model having a fixed mean call holding time. The drawback of the model is given by the fact, that different users obtain different data volumes, e.g. users at the cell edge suffering from poor radio conditions get significantly less data volume than users close to the base station. The advantage of the model is its simplicity. Obviously the C/I distribution of the channel resource units pRU(x) is identical to the C/I distribution of the users p(x) and consequently the portion αi of the channel resource units having MCSi corresponds to the portion µi of users able to use MCSi :
µi P(x) P ( x) = ∫ p( x )dx
xi
x i +1
xi+1
αi =
∫
x i +1
p ( x)dx = RU
xi
Fig. 3. Cell C/I CDF (300 m cell radius, 1x3 reuse, 3.5GHz band, 100% channel utilization, downlink power control off).
depends mainly on cell geometry, antenna configuration (height and pattern) as well as the propagation model. The RF output power plays no role in interference limited scenarios in tight reuse, if there are no coverage problems. Table I gives an overview of the essential parameter settings. In the following the cell C/I CDF is denoted by P(x) and the corresponding probability density function by p(x). Mapping the LA switching points xi on the cell C/I CDF gives the portion µi of users (assuming an uniform user distribution over the cell area) able to use a certain MCSi: xi + 1
µi =
∫ p( x)dx =P( xi +1) − P( xi ) ,
i=1,…, M.
(6)
xi
In particular µ1 is given by P(x2) and µM by 1.0 – P(xM) since as above defined x1 → −∞ and x M +1 → +∞ . Note that µi is not necessarily equivalent to the portion of channel resource units having a certain MCSi. This heavily depends on the assumed traffic model as demonstrated in the following two simulation scenarios. TABLE I. ESSENTIAL PARAMETERS OF THE RADIO NETWORK MODEL Parameter Number of sites Site-to-site distance Frequency reuse pattern Frequency band User distribution Pathloss slope Propagation Model BS RF TX power BS antenna Mobile antenna Power control (PC) Slow fading std. deviation
Value 16 wrapped around on torus, 3 sectors per site, hexagonal deployment 900 m (300 m cell radius) 1x3 1.8 GHz / EDGE; 3.5 GHz / WiMax uniform, random positioning 38 dB per decade COST-231 20 W / EDGE; 2 W / WiMax 65°, 17.5 dBi, 35 m above ground, no down-tilt Omni, 0 dBi; 1.5 m above ground Downlink PC switched off 8 dB
D. Scenario 1: Channel Capacity for equal mean Packet Call Duration per User In the first scenario a traffic model is assumed, where all users occupy the channel resources for the same average time period independent of the individually assigned MCSi and the experienced error rate εi. The scenario is similar to a
∫ p( x)dx .
(7)
xi
Using (6) it follows: α i = µ i = P( xi +1 ) − P( xi ). The average error rate ε i for MCSi over the interval xi ≤ x < xi+1 is:
εi =
1
αi
xi + 1
∫ p( x) ⋅ ε i ( x)dx .
(8)
xi
The channel capacity CCH in (3) is derived by mapping the envelope g (x) of the throughput functions f i (x) on the cell C/I CDF: CCH =
+∞
M
−∞
i =1
∫ p( x) ⋅ g ( x)dx = ∑
x i +1
∫ p( x) ⋅ fi ( x)dx.
(9)
xi
Using (2) and (8) yields: M x i +1
M
i =1 x i
i =1
CCH = ∑
∫ p( x) ⋅ Fi ⋅ (1 − εi ( x))dx =∑ αi ⋅ Fi ⋅ (1 − εi ).
(10)
Applying the step function approximation for the throughput vs. C/I curves from (5) the following easy calculation formula has been obtained: M
M
i =1
i =1
CCH ≈ ∑ α i ⋅ H i = ∑ µ i ⋅ H i .
(11)
Example: assume two user types sharing the same fully loaded channel, user type “a” with µa = ½ and g(xa) = Ha = 10 kbps and type “b” with µb = ½ and g(xb) = Hb = 20 kbps. With (11) the channel capacity is given by the arithmetic mean and results in CCH = ½ * 10 kbps + ½ * 20 kbps = 15 kbps. Given the nominal payload LRU,i of a resource unit utilizing MCSi the average data payload LRU of the resource units on the channel is given by: M
M
M
i =1
i =1
i =1
LRU = ∑ α i LRU , i (1 − ε i ) ≈ ∑ α i H iTRU = ∑ µ i H iTRU
(12)
with TRU the time duration of the resource unit. E. Scenario I1: Channel Capacity for equal mean Packet Call Data Volume per User The second scenario is based on a traffic model with a fixed mean data volume V per packet call independent of the radio link quality of the different users. The C/I distribution of the users is still given by p(x) and the portion of users having
MCSi is defined by µi according to (6). The distribution pRU(x) of the channel resource units, however, is not equal to the C/I distribution of the users p(x) anymore, because users under poor radio conditions require significantly more channel resources than users e.g. close to the base station in order to transfer the same data volume V. An example with user type “a” at C/I = xa and user “b” at C/I = xb leads to the required number of channel resource units NRU,a and NRU,b respectively: V N RU , a = g ( xa ) ⋅ TRU N RU , a 1 and = . (13) N RU ,b g ( xa ) V N RU , b = g ( xb ) g(x ) ⋅ T b
RU
Hence the distribution pRU(x) of the resource units can be derived from p(x)by the following probability transformation: p RU ( x) =
+∞
p ( x) g ( x) ⋅ Z
∫
Z=
with
−∞
p( y) dy . g ( y)
(14)
The portion αi of the channel resource units having MCSi leads to: x i +1
αi =
∫p
x i +1 RU
( x)dx =
xi
1 = Z
x i +1
∫
xi
∫
xi
p( x) 1 dx = g ( x) ⋅ Z Z
x i +1
∫
xi
p( x) dx = f i ( x) (15)
p( x) dx. Fi ⋅ (1 − εi ( x))
Applying the step function approximation from (5) and using (8) the following easy calculation formula has been obtained: µi µi Hi ( Fi (1 − ε i )) . (16) αi = M ≈ M µk µk ∑ ( Fk ⋅ (1 − ε k )) ∑ H k k =1 k =1 The capacity of the shared channel with fixed mean data volume is then defined by: +∞
CCH =
∫p
−∞
RU
( x ) ⋅ g ( x)dx =
1 Z
+∞
1
∫ p( x)dx = Z .
(17)
−∞
The step function approximation according to (5) leads to: 1 1 ≈ M . (18) CCH = M µk µk ∑ ( Fk ⋅ (1 − ε k )) ∑ H k k =1 k =1 The average data payload per resource unit is given by: T 1 . ≈ M RU LRU = M µk µk ∑ ( LRU ,k ⋅ (1 − ε k )) ∑ H k k =1
(19)
k =1
The example in Section D with two types of users sharing the same fully loaded channel — user type “a” with µa = ½ and g(xa) = Ha = 10 kbps and type “b” with µb = ½ and g(xb) = Hb = 20 kbps — leads with (18) to a channel capacity of CCH = (½ / 10 kbps + ½ / 20 kbps)-1 = 13.33 kbps. With (16) αa = ½ / 10 kbps x 13.33 kbps = 0.66 and αb = ½ / 20 kbps x 13.33 kbps = 0.33, thus, in contrast to the example above with fixed mean packet call duration, the MCS
utilization per resource unit with the fixed mean data volume model is not equal. The ratio αa / αb = 2 / 1 is reciprocal to the ratio Ha / Hb of the assumed nominal data rates. III.
NUMERICAL RESULTS FOR GSM/EDGE
GSM/EDGE supports M = 9 modulation and coding schemes MCS1, …, MCS9 utilizing both GMSK and 8-PSK and providing RLC data rates up to 59.2 kbps per PDCH. Fig. 4 on the right hand side shows the measured end-to-end application throughput per PDCH vs. C/I for all MCS. Application throughput means that all overhead including TCP/IP and LLC headers are included reducing the peak user data rates by roughly 3-5%. The measurements have been conducted on downlink static/stationary AWGN channel with commercially available handset and a GMSK modulated co-channel interferer with random payload. Link level results based on other channel models such as TU3 or TU50 have been published in [6] and could also be used. In addition the static/stationary throughput vs. C/I curves have been optimistically approximated (assuming εi = 0) by step functions Hi as outlined in Section II. Mapping the eight LA switching points xi onto the cell C/I CDF for 1x3 reuse in Fig. 4 on the left hand side provides the portions µi of users to which LA will assign MCSi according to the experienced C/I at the particular cell location. All data necessary for the calculations of channel capacity and spectrum efficiency by using (11), (18), and (1) have been collected in Table II. Obviously the 8-PSK MCSi (MCS5, …, MCS9) are dominantly in use with more than 75% vs. 25% GMSK modulation even for tight 1x3 frequency reuse. TABLE II. ESSENTIAL EDGE DATA FOR FURTHER PROCESSING MCS
xi [dB]
µi
Hi [kbps]
1
NA
0.05
8.0
2
1
0.07
11.0
3
4.5
0.06
14.0
4
6.5
0.07
17.0
5
7.5
0.05
21.0
6
9.5
0.2
28.0
7
13.0
0.1
43.0
8
16.0
0.2
52.0
9
21.0
0.2
56.0
A. Traffic Model with fixed mean Packet Call Duration Inserting the data from Table II into equation (11) the channel capacity of an EDGE PDCH is obtained for the traffic model with fixed mean packet call duration: 9
C PDCH ≈
∑ i =1
9
αi ⋅ H i =
∑ µi ⋅ H i = 35.75kbps. i =1
The average data payload per resource unit is calculated according to (12) using EDGE radio blocks with four TDMA frame rectangular interleaving duration TRU of 20 ms to:
LRU = C PDCH ⋅ TRU = 35.75kbps ⋅ 20ms = 715bit.
Η9
60
Η8
55
µ9 = 0.2 (20%)
µ7 = 0.1 (10%) µ6 = 0.2 (20%) µ5 = 0.05 (5%) µ4 = 0.07 (7%) µ3 = 0.06 (6%) µ2 = 0.07 (7%) µ1 = 0.05 (5%)
Application Throughput [kb/s]
µ8 = 0.2 (20%)
50
Η7
45 40 35
Η6
30
Η5
25 20 15
Η1
10
Η3
Η2
Η4
5 0 0
1
2
3
4
5
6
7
8
9
10 11 12 13 14 15 16 17 18 19 20 21 22 23 24 25
C/I [dB] MCS9
MCS8
MCS7
MCS6
MCS5
MCS4
MCS3
MCS2
MCS1
Fig. 4. Mapping of a measured GSM/EDGE link level with approximation by step functions (right) on the cell C/I CDF for 1x3 reuse (left) at full load.
The spectrum efficiency is calculated for frequency reuse r = 3 according to (1). The radio channel spacing in GSM is 200 kHz. Thus the channel bandwidth of the EDGE PDCH is BPDCH = 200 kHz / 8 = 25 kHz, since the GSM carrier includes eight timeslots and one PDCH occupies one timeslot. C PDCH 35.75kbps η= = = 0.47bps / Hz / Cell . r ⋅ BPDCH 3 ⋅ 25kHz B. Traffic Model with fixed mean Packet Call Volume Using (18) and (19) and the data in Table II the EDGE channel capacity and average payload per radio block have been calculated in case of a fixed mean data volume per user as follows: 1 C PDCH ≈ 9 = 24.82kbps and µk ∑ Hk k =1
LRU ≈ C PDCH ⋅ TRU = 24.82kbps ⋅ 20ms = 496bit. Taking into account the PDCH bandwidth of 25 kHz (refer to the comments above) the corresponding spectrum efficiency is given by (1): C PDCH 24.82kb / s η= = = 0.33bps / Hz / Cell. r ⋅ BPDCH 3 × 25kHz As expected the channel capacity as well as the spectrum efficiency for EDGE is significantly higher for the traffic model with fixed mean packet call duration than those obtained for the traffic model with fixed mean packet call volume. The difference in the results is nearly 50%. The EDGE results for the traffic model with fixed mean packet call volume are fully in line with the system level simulation results provided e.g. in [6] - [9]. Note that the results described above are only valid for PDCH allocated on transceivers (TRX) in 1x3 reuse, i.e. PDCH allocation on a BCCH TRX has not been considered. The latter case would result in a lower overall spectrum efficiency. IV.
NUMERICAL RESULTS FOR IEEE 802.16 (WIMAX)
IEEE 802.16 WMAN (WiMax) standard provides M=7 modulation and coding schemes MCS1, …, MCS7 as shown in Fig. 5 on the right hand side. MCS1 is based on BPSK modulation, MCS2/3 on QPSK, MCS4/5 on 16-QAM and
MCS6/7 on 64-QAM. Data rates ranging from 1.5 Mbps up to 11.5 Mbps are feasible in a 3.5 MHz channel. Similar to Fig. 4 the static/stationary throughput vs. C/I curves have been optimistically approximated in Fig. 5 by step functions Hi (assuming εi = 0) as outlined in Section II. Mapping the six LA switching points xi onto the cell C/I CDF for 1x3 reuse in Fig. 5 on the left hand side provides the portions µi of users to which LA will assign MCSi according to the experienced C/I at the particular cell location. All data necessary for the calculations of channel capacity and spectrum efficiency by using (11), (18), and (1) have been collected in Table III. TABLE III. ESSENTIAL WIMAX DATA FOR FURTHER PROCESSING MCS
xi [dB]
µi
Hi [Mbps]
1
NA
0.1
1.29
2
2.5
0.1
2.59
3
6.0
0.13
3.88
4
9.0
0.17
5.18
5
12.0
0.1
7.77
6
16.0
0.2
10.37
7
21.0
0.2
11.66
A. Traffic Model with fixed mean Packet Call Duration Inserting the data from Table III into equation (11) the capacity of a WiMax channel is obtained for the traffic model with fixed mean packet call duration: 7
7
i =1
i =1
CWiMax ≈ ∑ α i ⋅ H i = ∑ µ i ⋅ H i = 6.95Mbps. The average data payload per resource unit can be calculated according to (12) with an OFDM symbol duration TRU of 68µs (including 4µs cyclic prefix) to: LRU ≈ CWiMax ⋅ TRU = 6.95Mbps ⋅ 68µs = 472bit. The spectrum efficiency is calculated for frequency reuse r = 3 according to (1). The radio channel spacing in WiMax is 3.5 MHz: C 6.95Mbps η = WiMax = = 0.66bps / Hz / Cell . r ⋅ BWiMax 3 ⋅ 3.5MHz
Η6
µ7 = 0.2 (20%)
Η7
Η5
µ6 = 0.2 (10%) µ5 = 0.1 (20%)
Η4
µ4 = 0.17 (17%)
Η3 Η2
µ3 = 0.13 (13%)
Η1
µ2 = 0.1 (10%) µ1 = 0.1 (10%)
C/I [dB]
Fig. 5. Mapping of a simulated IEEE 802.16 (WiMax) link level with approximation by step functions (right) on the cell C/I CDF for 1x3 reuse (left) at full load.
B. Traffic Model with fixed mean Packet Call Volume Using (18) and (19) and the data in Table III the WiMax channel capacity and average payload per OFDM symbol have been calculated in case of a fixed mean data volume per user as follows: 1 CWiMax ≈ 7 = 4.31Mbps, and µk ∑ Hk k =1
LRU ≈ CWiMax ⋅ TRU = 4.31Mbps ⋅ 68µs = 293bit. The corresponding spectrum efficiency is given by (1): C 4.31Mbps η = WiMax = = 0.41bps / Hz / Cell. r ⋅ BWiMax 3 × 3.5MHz As expected the channel capacity as well as the spectrum efficiency for WiMax is significantly higher for the traffic model with fixed mean packet call duration than those obtained for the traffic model with fixed mean packet call volume. The difference in the results is nearly 60%. The WiMax results for the traffic model with fixed mean packet call volume are fully in line with the system level simulation results provided in [10] and [11]. The direct comparison of WiMax with EDGE shows that about 40% higher spectrum efficiency is obtained by WiMax applying the traffic model with fixed mean packet call duration and about 20% applying the traffic model with fixed mean packet call volume. Nevertheless it shall be pointed out, that especially under good radio conditions WiMax allows for a significantly higher user throughput than EDGE due to the higher order modulation schemes (64-QAM for WiMax vs. 8-PSK for EDGE) and due to the larger channel bandwidth (e.g. 3.5 MHz for WiMax vs. 25 kHz for EDGE). V.
CONCLUSIONS
A quasi-analytical rapid estimation method for channel capacity and spectrum efficiency in wireless packet data networks has been derived. The method is essentially based on mapping simulated or measured link level curves of an arbitrary radio access technology on a measured or simulated cell C/I CDF. The approximation of the link level performance
curves by simple step functions allows for a very easy-to-use calculation procedure. The proposed approach has been manifested on two generic traffic models assuming packet calls either with fixed duration or fixed volume. The results obtained are in line with state-of-the-art system level simulation results recently published in the literature. The channel capacity and spectrum efficiency have been estimated for a widely established technology like GSM/EDGE and an upcoming new technology such as WiMax. It has been clearly stated that irrespective of the radio technology under evaluation the performance indicators like channel capacity and spectrum efficiency show significant difference of 50-60 % depending on the traffic model. Future work will be focused on the evaluation of an appropriate mixture of the generic traffic models to cope with realistic user behavior in wireless networks. REFERENCES [1]
3GPP TS 44.060, “General Packet Radio Service (GPRS); Mobile Station - Base Station System Interface; Radio Link Control/Medium Access Control (RLC/MAC) protocol”. [2] 3GPP TS 43.064, “General Packet Radio Service (GPRS); Overall description of the GPRS radio interface”. [3] Draft IEEE Standard for local and metropolitan area networks, IEEE P802.16-REVd/D5-2004, “Air Interface for Fixed Broadband Wireless Access Systems”, 2004. [4] Draft IEEE Standard for local and metropolitan area networks, IEEE P802.16e/D4, “Air Interface for Fixed and Mobile Broadband Wireless Access Systems; Amendment for Physical and Medium Access Control, 2004. [5] C.F. Ball, K. Ivanov, P. Stöckl, C. Masseroni, S. Parolari, R. Trivisonno, “Link Quality Control Benefits from a Combined Incremental Redundancy and Link Adaptation in EDGE Networks“, IEEE VTC Spring, Milan, 2004. [6] C.F. Ball, K. Ivanov, L. Bugl, P. Stöckl, “Improving GPRS/EDGE Endto-End Performance by Optimization of the RLC Protocol and Parameters“, IEEE VTC Fall, Los Angeles, 2004. [7] T. Halonen, J. Romero and J. Melero, “GSM, GPRS and EDGE Performance“, Wiley & Sons, 2002. [8] K. Ivanov, C.F. Ball, F. Treml, “GPRS/EDGE Performance on Reserved and Shared Packet Data Channels“, IEEE VTC Fall, Orlando, 2003. [9] C.F. Ball, K. Ivanov, F. Treml, „Contrasting GPRS and EDGE over TCP/IP on BCCH and non-BCCH Carriers“, IEEE VTC Fall, Orlando, 2003. [10] C.F. Ball, E. Humburg, K. Ivanov, F. Treml, “Performance Analysis of IEEE802.16 based cellular MAN with OFDM-256 in mobile Scenarios“, IEEE VTC Spring, Stockholm, 2005. [11] C.F. Ball, E. Humburg, K. Ivanov, F. Treml, “Comparison of IEEE802.16 WiMax Scenarios with Fixed and Mobile Subscribers in Tight Reuse“, 14th IST Mobile & Wireless Communications Summit, Dresden, 2005.