Jul 16, 2008 - [13] Holland, J.H.: Adaptation in Natural and Artificial Systems. University of ... [19] Carlisle, A., Dozier, G.: An off-the-shelf PSO. Proceedings.
Rapid Evaluation and Evolution of Neural Models using Graphics Card Hardware T.F. Clayton1, L.N. Patel1, G. Leng2, A.F. Murray1, I.A.B. Lindsay1 (1)
(2)
Institute of Integrated Micro and Nano Systems Kings Buildings, West Mains Road, EH9 3JF, Edinburgh +44(0)131 650 5664
Centre for Integrative Physiology Hugh Robson Building, George Square, EH8 9XD, Edinburgh +44(0)131 650 2869
{T.Clayton, L.Patel, Gareth.Leng, Alan.Murray, Iain.Lindsay}@ed.ac.uk ABSTRACT
1. INTRODUCTION
This paper compares three common evolutionary algorithms and our modified GA, a Distributed Adaptive Genetic Algorithm (DAGA). The optimal approach is sought to adapt, in near realtime, biological model behaviour to that of real biology within a laboratory.
In computational neuroscience modelling is an important process for testing hypotheses that seek to explain neural behaviour. This paper describes a study of the vasopressin releasing neurons that are found within the hypothalamus. These neurons are important physiologically because vasopressin is essential for homeostatic regulation of fluid and electrolyte balance in the body, and they have been studied very extensively in a wide range of conditions they are an important “model system” in neuroscience. In response to dehydration, these neurons discharge action potentials in a distinctly phasic pattern [1][2][3] (i.e. with bursts of activity, followed by periods of inactivity, as shown in Figure 1) that has been shown to be important for optimizing the efficiency of vasopressin secretion: the phasic firing pattern is generated by complex activity-dependent feedback influences on neuronal excitability.
Near real-time adaptation is achieved with a Graphics Processing Unit (GPU). This, together with evolutionary computation, enables new forms of experimentation such as online testing, where biology and computational model are simultaneously stimulated and their responses compared. Rapid analysis and validation provide a platform that is required for rapid prototyping, and along with online testing, can provide new insight into the cause of biological behaviour. In this context, results demonstrate that our DAGA implementation is more efficient than the other three evolutionary algorithms due to its suitability to the adaptation environment, namely the large population sizes promoted by the GPU architecture.
Categories and Subject Descriptors I.6.5 [Model Development]: Modelling methodologies
General Terms Algorithms, Verification.
Keywords Bioinformatics, Evolutionary Strategies, Modelling behaviours and ecosystems, Parameter tuning, Speedup technique.
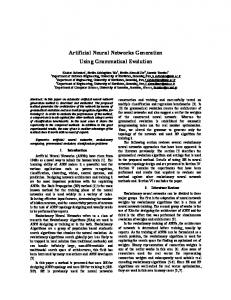
Figure 1. Rate based recordings from three individual bursting vasopressin neurons. Note the range of behaviours that these neurons can produce. Additionally, these neurons can produce sparse sporadic, as well as continuous firing. A computational model that represents a simplified representation of the vasopressin neuron already exists [4]. The representation consists of a series of exponential decays and step functions that describe the effects of a series of action potentials on subsequent excitability. The model is based upon an “integrate and fire” neuron [5], within which a Poisson distributed noise source represents the input from synapses, as shown in Figure 2. Fourteen interdependent parameters control the model, resulting in a multimodal 14-dimensional parameter space. The model has been evaluated by comparing neural data recorded from a series of
Permission to make digital or hard copies of all or part of this work for personal or classroom use is granted without fee provided that copies are not made or distributed for profit or commercial advantage and that copies bear this notice and the full citation on the first page. To copy otherwise, or republish, to post on servers or to redistribute to lists, requires prior specific permission and/or a fee. GECCO’08, July 12–16, 2008, Atlanta, Georgia, USA. Copyright 2008 ACM 978-1-60558-130-9/08/07...$5.00.
299
2. ALGORITHMIC ACCELERATION Due to the large number of fitness evaluations required, evolutionary algorithms are computationally expensive. This is especially so within the field of computational neuroscience, where a model's fitness function consist of a simulation run combined with a statistical analysis of the resulting data. To model and adapt to a biological system in near real-time, some form of acceleration is required to reach the simulation speed necessary. Three options were explored – server farm, custom hardware and graphics card hardware.
2.1 Server Farm A server farm (multiple inter-communicating computers) would provide a large performance increase whilst still allowing the flexibility to change the adaptation process. However, as the ultimate goal of this work is to allow the methodology to be used within a lab, where access to a server farm may not always be available, this approach must be discarded.
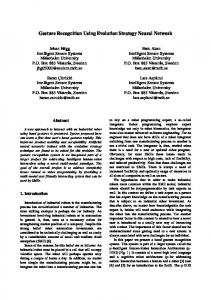
Figure 2. Functional structure of the vasopressin neural model [4]. Poisson spaced input inhibitory and excitatory action potentials are accumulated on the membrane potential along with feedback from the HAP, DAP and AHP, which are exponential decays, that models the influence of ion channels. The membrane potential also includes a simple state machine to represent the heightened rest potential caused by DAP summation during bursts by repeated action potentials.
2.2 Custom Hardware Simulation calculations could be performed by specially-designed Application-Specific Integrated Circuit (ASIC) [6] or FieldProgrammable Gate-Array (FPGA) chips [7]. This approach does not have the availability issues associated with a server farm as the chip could be easily used alongside a PC within the lab environment. However, while an ASIC would provide the greatest performance increase, its functionality is essentially fixed at the design stage. It is therefore unsuited to experimental applications, such as ours, where the functions controlling fitness may be required to change to isolate specific behavioural characteristics of the model. FPGAs can be re-programmed easily, even within a lab, whilst still providing a significant performance increase. However, any form of custom device tends to discourage early adoption by end-users [8]. As our express aim is to get hardware-accelerated modelling into the biology laboratory as rapidly as possible, the FPGA option was discarded in favour of a more “off-the-shelf” acceleration approach.
neurons within a lab, with data collected from a randomly generated population of model instances. This paper reports attempts to improve the testing process by adapting the parameters that control the model automatically and algorithmically, such that its resultant behaviour matches individual biological samples. The model's behavioural parameter space is complex, and so we have opted for an evolutionary approach to the optimization problem. Due to the high computational cost associated with evolutionary approaches, a Graphics Processing Unit (GPU) was chosen to perform the majority of the computationally expensive fitness calculations. Fast fitness analysis is important, as it allows the optimization process to be performed in a laboratory, emulating a biological sample in real-time. This facilitates rapid analysis, validation and adjustment of a model's structure, and thus is a form of “rapid prototyping”. Online tests, where a stimulus is applied to both model and biology simultaneously and the changes in behaviour compared, may also be used to critique models. Once a model is established and trusted, it may also be used as a route to “what if” modelling during a biological experiment, allowing real-time decisions to be made regarding the future conduct of the experiment.
2.3 Graphics Card Hardware The development of 3D graphics cards has been driven heavily by the aggressive nature of the computer gaming industry. Currently there are various development platforms and programming languages available to exploit the raw power available within Graphics Processing Units (GPUs). Late in 2006, Microsoft released the DirectX 10 Application Programming Interface (API), which included a new version of Direct3D, requiring specific functionality within all new GPU architectures that claim compatibility. DirectX 10 enforces a “Unified Architecture”, such that different tasks, such as vertex, pixel, and geometry shading are now handled by a series of general purpose Single Instruction Multiple Data (SIMD) processors. (In earlier architectures, they were processed by different elements within the GPU.) This provides enhanced flexibility and allows evolutionary programmers to utilize the full computational power of the GPU by performing multiple fitness evaluations in parallel. Both ATI [9] and NVIDIA [10] offer DirectX 10 compatible GPUs, but NVIDIA has also released an API, which is heavily grounded in the C programming language. One aspect of the API is its ability to streamline the memory accesses within the graphics card, allowing developers to pipeline multiple fitness
The remainder of this paper is arranged as follows. Section 2 introduces and addresses the need for hardware acceleration. Several solutions are explored, with the chosen form dictating the environment of the evolutionary approach. Section 3 discusses four different forms of evolutionary algorithm, three commonly found within the literature, with the final, a Distributed Adaptive Genetic Algorithm (DAGA) being of our own construction. Section 4 presents and analyses the results of our adaptations, discussing the causes of the success and failure of the various evolutionary approaches. Our paper closes with a brief conclusion, discussing the work carried out thus far as well as listing future goals.
300
chosen algorithm directly on the fittest members of this population, or by selecting the elite from this global population to complement the previous working generation of the EA. This is done for two reasons; firstly to accumulate knowledge found throughout the adaptation process instead of relying on the previous generation's results alone, and secondly to make the algorithm more elite and exploitative. Accumulated knowledge is also beneficial when adapting to a biological target that has shifting behaviour, as previously searched and discarded areas may become more favourable. Annealing has been applied to each EA, to take advantage of the a priori knowledge of how close the algorithm has adapted to the perfect solution.
evaluations on a single element of an SIMD processor. With GPUs, a different approach to simulation must be taken, even with the flexibility offered by a C based API, as the hardware is not amenable to approaches which may have been optimal in pure software, such as branching caused by “if” and “switch” statements. Furthermore, the availability of onboard memory limits the quantity and type of data that can be collected from each simulation. However, the ability to gain powerful hardware acceleration, which is easily applied within a lab environment, and is cheaply and readily available off-the-shelf, offsets the coding-based drawbacks substantially. We have therefore used GPU acceleration, using NVIDIA's CUDA API [11] and an 8800GTX graphics card. This card can simulate a maximum of 4096 neuronal experiments simultaneously, so this has been chosen as the population size for all the evolutionary approaches. Because of the parallel nature of the hardware acceleration, reducing this number provides no performance increase. When using this method, a minimum experimental throughput increase of 150 times the pure software approach was obtained.
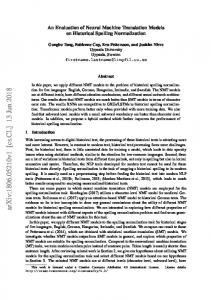
3.1 Real Valued Genetic Algorithm (GA) The GA [13, 14, 15] was chosen because it is an established and well-understood baseline for the evaluation process. The GA is implemented with 2-point cross-over and mutation. The Mutation operator involves randomly selecting genes after the cross-over has been performed, and choosing new values randomly from a range either side of the current value. This range is scaled along with the fitness of the population to make the algorithm more exploitative, performing a more detailed search as fitter solutions are found. This selection scheme of the GA favours fitter experiments, as shown in Figure 3. GAs provide an automatic balance between exploration and exploitation of the parameter space through the cross-over mechanism. Cross-over disperses the population proportionally to the number of clusters found and the dimensionality of the parameter space. This promotes heavy exploration during initial generations, but reduces the algorithm's efficiency at isolating minima later on.
Figure 3. Selection scheme used within the GA. The probability of selection, which is not directly related to fitness, but instead the order, falls linearly across the ordered set. The black line represents the chance of selection, whereas the red line is the fitness of the experiments (lower is better).
3.2 Kernel-Based Estimation of Distribution Algorithm (EDA)
3. EVOLUTIONARY ALGORITHMS (EA)
An EDA [16] creates a new generation by analyzing the distribution of the fittest solutions within the current population and selecting new solutions probabilistically from within this distribution. As an increasing number of fitter solutions are created, the distribution will converge upon the minimum as the average fitness required to remain within the population increases. EDAs can search several areas of the parameter space
The adaptation problem is to find a global minimum in a fourteen dimensional parameter space, minimizing the difference (or error) between the behaviours of the biological neuron and the model. Each parameter is bounded between biologically plausible maximum and minimum values, and is a direct representation of a biological phenomenon, for example, the half-life of the Membrane Potential Decay [12], or the magnitude of the Hyperpolarizing After Potential. The fitness function is characterized by descriptive statistics of Inter-spike Intervals (ISIs) of event data and the mean and variance of bursting behaviour. These levels of fitness compete during the optimization process, making this a multi-objective task. As was shown in Section 2, the chosen hardware acceleration promotes large population sizes, but a low number of generations, typically less than 30. Four evolutionary algorithms have been compared. 1.
Genetic Algorithms (GA) [13, 14, 15]
2.
Kernel based Estimation of Distribution Algorithm (EDA) [16]
3.
Particle Swarm Optimizer (PSO)[17, 18, 19, 20]
4.
Distributed Adaptive Genetic Algorithm (DAGA)
All solutions are stored in a single global population, ordered by fitness. The EAs create each generation either by performing the
Figure 4. Two dimensional representation of kernel variance scaling based on cluster density within the EDA. A nearest neighbor search is applied to the fittest points of each generation. The average distance to each point is used to scale the variances of the kernels that are applied during the generation process.
301
parent select range, which represents the number of solutions from the global population that have a chance of selection, and the mutation rate, which corresponds to the chance each model parameter has of having the mutation operator applied to it. Changing these control parameters can produce large changes in algorithm behaviour ranging from the extremes of exploitative to explorative.
simultaneously and so would seem suited to adapt our model that has a high number of modes (minima in our case, as we are trying to minimize deviation from model to target). Our kernel based EDA takes advantage of the global sorted population by selecting a small subset of the fittest solutions to merge with the current generation for the purposes of solution selection. Additionally, the EDA utilizes a nearest neighbour algorithm to control the variance of the multidimensional Gaussian kernels used, as shown in Figure 4. This allows the algorithm to search areas of good fitness more closely - an effect similar to that of annealed mutation in the GA. If points are clustered tightly, the variance of the Gaussian kernel is reduced, increasing the probability that new experiments are selected towards the centres of the clusters. This EDA is therefore greedy, focusing quickly on the centre of experimental clusters; a side effect of which is its vulnerability to local minima, failing to explore the parameter space properly. To account for this, the base variance of the kernel was enlarged, making the algorithm globally more explorative.
As we do not know in advance the shape of the parameter space, and hence the optimal approach for adapting to each biological cell behaviour, it would be useful to have a mechanism that sits atop of the GA steering its behaviour from explorative to exploitative and back again on a generation to generation basis. To accomplish this we have taken advantage of the large population sizes that are enforced by the GPU architecture to implement a form of individual-level self-adaptation [21]. As stated in section 2, our GPU enforces a population size of 4096, which is large enough to observe the entire parameter space of the GA, and then guide the GA based upon the performance within each area. This population we split in two, with the first half designated as “Observers”, and the second half “Workers”. Both Observers and Workers each control the adaptation of a single member of every generation of the GA. The Observers are distributed randomly across the GA’s parameter space, and do not move from generation to generation. Each Observer has a Pheromone value, which represents how successful the GA has been at optimizing when using the Observers GA control parameters. This Pheromone value decays over time to emphasize recent good configurations of the GA. After each generation of the GA has been analyzed, the fittest 5% of that generation increase the pheromone value of any observer they are attached to as a function of their performance within that 5% (only half the population is attached to observers). The Workers choose which Observer they wish to mimic each generation, which is determined by the strength of each Observer’s Pheromone value. In this way, the workers move to produce the most appropriate behaviour at the current time. Figure 6 shows the final distribution of pheromone of one optimization run. Optimizations tend to initially favour a low parent select range with a high level of mutation. This is likely due to the large number of points within the parameter space that produce un-analyzable data.
3.3 Particle Swarm Optimization (PSO) Inspired by schooling behaviour in fish and flocking birds, PSOs [17] treat the population as a series of agents that move through multi-dimensional space. At every iteration of the population, each agent's velocity is re-calculated as shown in Figure 5.
Figure 5. Pictorial representation of the PSO algorithm. C → Current position; G → Global best position found so far ; P → Personal Best Position found so far; N → New position after altered velocity is applied to current iti The annealing process within the PSO is implemented by limiting each agent's momentum as a function of fitness, such that agents are less likely to leave areas of good fitness. PSOs are robust, owing to their ability to search large areas of the parameter space with only a small population size. For example, the 2006 standard of the PSO algorithm [18] suggests 18 agents for a 14 dimensional parameter space. This is two orders of magnitude less than the population size available to us through the use of our GPU acceleration. However, PSOs are not necessarily more efficient, as many more iterations are usually required than in other evolutionary algorithms, and it is even suggested that the greatest performance is obtained when the global best solution is updated after each agent moves [19]. Hence PSOs are generally more suited for sequential applications where small generation sizes are appropriate, with many more iterations [20].
3.4 Distributed Adaptive Genetic Algorithm (DAGA) Out of the three algorithms, GA, EDA, and PSO, the GA gave by far the greatest performance (see section 4). However, even the GA had difficulty adapting the model to each of the target behaviours, with maximum fitness’ ranging from 5.39% to 21.58% deviation from target behaviours. These values were improved by altering the underlying parameters that control the genetic algorithm, namely the
Figure 6. Pheromone distribution. The size of the circles represent the chance of selection by a worker. This particular adaptation favors an elite approach with a high level of mutation.
302
4. RESULTS To evaluate the performance of the evolutionary algorithms, they were each used to adapt to the behaviours of twenty six different neural recordings, fifteen from an in-vivo environment and eleven from in-vitro. Figure 7 presents the fitness values, relative deviations from target behaviour (lower is better), attained when applying each of the optimization methods against these two sets of data. The GA and DAGA drastically outperform both the EDA and PSO, with the DAGA providing the greatest performance for 14 out of the 15 in-vivo targets. However, the DAGA does not provide any significant improvement over the traditional GA when working with the in-vitro data (the DAGA demonstrates fitter values for 7 adaptations compared to 4 for the GA). In Figure 8, a more detailed depiction of a point evaluation from one of the previous adaptation runs, shows how close, behaviourally, the model can be optimized to fit the biology. In each section of the diagram, blue represents the target, and red the adapted simulation. 8a is the distribution of the Inter Spike Interval (ISI), 8b and 8c show how closely the simulation matches the target's burst and space lengths, 8d shows the distribution of spike rate, and 8e shows a comparison of rate recordings. It is important to note that limitations of the fitness function and model structure mean that it
Figure 7. Presents the best attained fitness values when adapting to both in-vivo and in-vitro data.
Figure 8. A point of good fitness using the DAGA, displaying in more detail the various measures of fitness used to guide each algorithm. (a) Distribution of Inter Spike Interval (b) Distribution of Burst Length, (c) Distribution of Space Length, (d) Distribution of Spike Rate, (e) Rate over Time; both traces do not have to match in time, but should look as if they came from the same cell. For a, b, c, and d, the perfect fitness would be represented by the red line (adapted model) perfectly overlaying the blue line (biological target).
303
Figure 9. Algorithmic adaptation over time, (a) Estimation of Distribution Algorithm (EDA), (b) Particle Swarm Optimization (PSO), (c) Genetic Algorithm (GA), (d) Distributed Adaptive Genetic Algorithm(DAGA). The X axis corresponds to the generation number. The Y axis represents goodness of fit (the lower the value the better). was invalid, even when constrained heavily within a biologically plausible range. As a result, any algorithm that did not immediately respond to this problem suffered in performance. The PSO is one such algorithm, but in this case it also performs badly because it is not a suitable search method to be used alongside hardware acceleration that imposes the restriction of large population sizes. In this circumstance, a PSO will offer progressively better locations in different areas of the parameter space. This causes general “indecisiveness”, from iteration to iteration, of the global best fit that excites the agents within the PSO to ever greater velocities and prevents timely convergence. This reinforces the view that PSOs are best suited to applications that have small population sizes but a large number of available iterations. Because we are utilizing graphics card hardware, our neuronal modelling task has precisely the opposite characteristics. With this algorithm the extra power provided by the GPU is being wasted.
is highly unlikely that a perfect behavioural match will be obtained. These limitations are most apparent when the quantity of recorded data is restricted, essentially skewing the target, and producing uncharacteristic biological behaviour. Figure 9 shows the four algorithms adapting to the same biological target. Each point within the figures represents an evaluated position within the parameter space, where the bands within the X axis correspond to generations, and the Y axis corresponds to fitness as a relative deviation from the target (lower is better). The spread of fitness within each generation illustrates how exploitative an algorithm is, where exploitative algorithms search more heavily within the areas of best fitness; hence the majority of new positions have similar or improved fitness. It was readily apparent, by the number of members within the initial populations that produced unanalysable data (too many or too few events per simulation), that much of the parameter space
304
and in-vitro data, can be attributed to over-constraining the problem parameter space, reducing the suitability of the biologically plausible range of values for cells that are removed from their natural environments. This presents another avenue where an adaptive GA may flourish by altering the parameter constraints during the adaptation process [22].
The EDA has a tendency to focus on promising areas of parameter space too soon, which causes it to perform badly. This “greedy” behaviour, even when reduced by globally increasing the kernel size, searches and finds many other favourable points within those areas and then “forgets” about exploring the rest of the parameter space. This can be seen by the rapid adaptation of the population to an average fitness of 75% deviation from the target by the 4th generation, followed by the algorithms stagnation. Because of the large kernel size, over time the algorithm slowly spreads and is able to find better areas to search. However, because of this large kernel size, the EDA finds it difficult to exploit these improved areas, and by the end of the adaptation the average fitness has yet to improve significantly.
The GPU allowed for an experimental fitness analysis rate of approximately 40 seconds to a minute per generation, though this can easily be reduced by decreasing the simulation length. This results in a model being analyzable once every 15 minutes, instead of the one and a half days that would normally be required. The typical maximum length of a neural experiment within electrophysiology is six hours; so many iterations of a model design can be tested within this period, while data is simultaneously being collected from the biological sample.
A side effect of the EDAs aggressive nature is its ability to act as a good indicator of the modality of the parameter space. Figure 10 shows the progress of a single parameter across the adaptation run and clearly shows two final modes along with three others that have been previously discarded. Many of the other parameters had similar behaviours, and hence is a good indication that this parameter space is highly multi-modal.
5. CONCLUSION We have developed a methodology for the rapid adaptation of behaviour-based biological models to mimic the biological behaviour of many independent cells of the same class. This is a useful tool as it can enable experimental biologists to perform iterative design within a lab environment. Additionally, insight into the internal workings of a cell may be provided within the time frame of an experiment, which can be used to guide experimental procedure. Because model analysis is essentially “blind”, i.e. nothing is known of the parameter space except for its dimensionality, a robust algorithm is required to explore the parameter space of the model. We have compared four evolutionary algorithms to determine which gives the best performance within the parameter space of this and similar models. We postulate that models that are generated as a result of an iterative design process will form similar parameter spaces that present similar challenges to any adaptation algorithm. We have found that the parameter spaces are highly multimodal, but include many areas that produce unanalyzable data. Therefore, suitable algorithms should be initially exploitative to reject these null areas, but should be explorative once these areas have been removed, to tackle the multi-modality of the parameter space.
Figure 10. Algorithmic adaptation of a single parameter using EDA. The clusters of points show how different modes are found, explored and then discarded until the fittest is found.
To perform the many computationally intensive fitness evaluation processes, we use Graphics Processing Units (GPUs) which evaluate thousands of points simultaneously within the parameter space. GPU technology is upgradeable, cheap, and currently provides more than two orders of magnitude improvement in performance over conventional processors. However, GPU architecture itself affects the optimum choice of algorithm, which must be chosen to exploit the large population sizes it imposes. To explore this theorem we have developed a Distributed Adaptive Genetic Algorithm (DAGA), to take advantage of large population sizes. DAGA does this by dividing the base GA into a number of differently configured elements equal to its population size, which emphasize varying degrees of exploration and exploitation. Using a pheromone-based approach, areas of the base GA’s configuration space that are consistently favourable will attract a larger portion of the computation power available. DAGA has performed well in comparison to more traditional approaches. We are still optimising the DAGA and have already found further improvements. This provides a strong indication that as population sizes increase, which may be due to
The GA outperforms the EDA and PSO. We suggest that this is due to the algorithms’ greater suitability to the adaptation environment, as the GA, through a combination of the selection scheme and cross-over mechanism, splits the population into subsets with varying degrees of exploration/exploitation. The DAGA improves upon this regime by dividing the base GA into individual elements that have the potential for alternate algorithmic configuration. These elements are monitored such that a large portion of the computational power can be adapted to the more favourable areas within the configuration space. Although only two algorithm parameters were adapted, and the mechanism for this adaptation is simplistic, this approach showed a general increase in performance across the majority of the cell adaptations compared to the GA, which itself showed great improvement over the alternate algorithms. The in-vivo data was easier to adapt to than in-vitro data. The difference in overall performance of all the algorithms, when presented with in-vivo
305
environmental constraints such as GPU architecture, an individual member is more efficiently utilized for monitoring the algorithms configuration space, than actively searching the problem parameter space.
[8] Furber, S., Temple, S.: Neural systems engineering. Journal of the Royal Society 4 (2007), 193-206.
6. FUTURE WORK
[10] NVIDIA Developers Website. http://developer.nvidia.com/page/home.html
[9] ATI Developers Website. http://ati.amd.com/developer/index.html
We will create a user-friendly interface that will allow biologists to create, adjust and test the underlying functionality and structure of neural models iteratively. This will not only allow rapid prototyping to be used within a lab, but also online testing in the form of real-time comparative tests and cell classification. Biological phenomena may also be studied by analyzing the distribution of adapted parameters that control the behaviour of trusted biological models.
[11] NVIDIA: CUDA Programming Guide 1.0. http://developer.nvidia.com/object/cuda.html [12] Roper, P., Callaway, J., Shevchenko, T., Teruyama, R., Armstrong, W.: AHP's, HAP's and DAP's: How potassium currents regulate the excitability of rat supraoptic neurones. Journal of Computational Neuroscience 15 (2003), 367-389. [13] Holland, J.H.: Adaptation in Natural and Artificial Systems. University of Michigan Press, Ann Arbor, Michigan (1975).
The techniques we are developing will allow biologists, and any other concerned with modelling in real-time, to work more efficiently and effectively in a lab environment. In many cases, they may be able to perform new science.
[14] Patel, L.N., Murray, A.F and Hallam, J.: Super-lampreys and wave energy: Optimised control of artificially-evolved, simulated swimming lamprey, Neurocomputing, 70(7-9), (March 2007), 1139-1154.
7. ACKNOWLEDGMENTS The authors would like to thank Dr Katherine Cameron for her insight and assistance, and EPSRC for PhD studentship funding.
[15] Wright, A.H.: Genetic Algorithms for Real Parameter Optimization, Foundations of genetic algorithms, (1991), 205-218.
8. REFERENCES
[16] Larranga, P., Lozano, J.A.: Estimation of Distribution Algorithms: A new tool for evolutionary computation. Kluwer Academic Publishers, Boston (2002).
[1] Sabatier, N., Brown, C.H., Ludwig, M., Leng, G.: Phasic spike patterning in the rat supraoptic neurones in-vivo and invitro. Journal of Physiology 558(1) (July 2004), 161-180.
[17] Kennedy, J., Eberhart, R.: Particle swarm optimization. Proceedings of the IEEE International Conference on Neural Networks 4. (1995) 1942-1948
[2] Brown, C.H.: Rhythmogenesis in vasopressin cells. Journal of Neuroendocrinology 16(9) (September 2004), 727-739.
[18] Particle Swarm Central Website: http://www.particleswarm.info
[3] Sabatier, N., Brown, C.H., Ludwig, M., Leng, G.: Burst initiation and termination in phasic vasopressin cells of the rat supraoptic nucleus. Journal of Neuroscience 24(20) (May 2004), 4818-4831.
[19] Carlisle, A., Dozier, G.: An off-the-shelf PSO. Proceedings of the Workshop on Particle Swarm Optimization. (2001), 1-6
[4] Durie, R.: A Population Model of Vasopressin Secretion. PhD Thesis, University of Edinburgh (2007).
[20] Diosan, L., Oltean, M.: Observing the swarm behavior during its evolutionary design. Proceedings of the genetic and Evolutionary Computation Conference (GECCO), (2007).
[5] Gerstner, W., Kistler, W.: Spiking Neuron Models: Single Neurons, Populations, Plasticity. Cambridge University Press (2002).
[21] Angeline, P.J.: Adaptive and Self-Adaptive Evolutionary Computations. Computational Intelligence: A Dynamic Systems Perspective, IEEE Press, 152-163, (1995).
[6] Saїghi, S., Bornat, Y., Tomas, J., Renaud, S.: Neuromimetic ICs and system for parameters extraction in biological neuron models. Proceeedings of the IEEE International Symposium on Circuits and Systems. (May 2006), 42074211.
[22] Eiben, A.E., Hinterding, R. Michalewicz, Z.: Parameter control in evolutionary algorithms. IEEE transactions on Evolutionary Computation, 124-141, (1999).
[7] La Rosa, M., Caruso, E., Fortuna, L., Frasca, M., Occhipinti, L. and Rivoli, F., Bioengineered and Bioinspired Systems II, Proceedings of the SPIE 5839, (June, 2005).
306