Items 10 - 15 - C. Results of the Reading First Implementation Evaluation . ...... Weighted respondents: 1,630 new RF reading coaches, 2,124 mature Reading First ...
Reading First Implementation Evaluation: Interim Report
Prepared by Marc Moss Robin Jacob Beth Boulay Megan Horst Jennifer Poulos
With assistance from Robert St. Pierre Beth Gamse Alan Werner Quentin Dixon Abt Associates Inc. Cambridge, MA
Prepared for: U.S. Department of Education Office of Planning, Evaluation and Policy Development Policy and Program Studies Service
2006
This report was prepared for the U.S. Department of Education under Contract No. ED-01-CO-0093/0005. The project monitor was Beth A. Franklin in the Policy and Program Studies Service. The views expressed herein are those of the contractor. No official endorsement by the U.S. Department of Education is intended or should be inferred. U.S. Department of Education Margaret Spellings Secretary Office of Planning, Evaluation and Policy Development Tom Luce Assistant Secretary Policy and Program Studies Service Alan L. Ginsburg Director Program and Analytic Studies Division David Goodwin Director July 2006
This report is in the public domain, except for the photograph on the front cover, which is used with permission and copyright, 2006, Getty Images. Authorization to produce it in whole or in part is granted. Although permission to reprint this publication is not necessary, the citation should be: U.S. Department of Education, Office of Planning, Evaluation and Policy Development, Policy and Program Studies Service, Reading First Implementation Evaluation: Interim Report, Washington, D.C., 2006. To order copies of this report, write: ED Pubs Education Publications Center U. S. Department of Education P. O. Box 1398 Jessup, MD 20794-1398; via fax, dial (301) 470-1244; You may also call toll-free: 1-877-433-7827 (1-877-4-ED-PUBS). If 877 service is not yet available in your area, call 1-800-872-5327 (1-800-USA-LEARN); those who use a telecommunications device for the deaf (TDD) or a teletypewriter (TTY) should call 1-800-437-0833. To order online, point your Internet browser to: www.edpubs.org. This report is also available on the Department’s Web site: http://www.ed.gov/about/offices/list/opepd/ppss/index.html. On request, this publication is available in alternative formats, such as Braille, large print, audiotape, or computer diskette. For more information, please contact the Department’s Alternate Format Center at (202) 2609895 or (202) 205-8113.
Contents List of Exhibits ....................................................................................................................... vii Executive Summary ................................................................................................................. 1 A. Key Provisions of the Reading First Program ............................................................ 1 B. Overview of the Evaluation ........................................................................................ 1 C. Results of the Reading First Implementation Evaluation ........................................... 3 External Resources to Support Reading Programs ................................................. 3 Reading Instruction in K–3 Classrooms ................................................................. 4 Interventions for Struggling Readers ...................................................................... 7 Assessment.............................................................................................................. 9 Oversight and Classroom Support Activities........................................................ 11 Professional Development .................................................................................... 13 Conclusions .................................................................................................................... 14 Chapter 1: Introduction ........................................................................................................ 17 Background..................................................................................................................... 17 Scientifically Based Reading Research ................................................................ 17 The Reading First Legislation............................................................................... 18 The Study Design ........................................................................................................... 19 Surveys.................................................................................................................. 21 Reading First State Coordinator Interviews.......................................................... 22 Limitations ............................................................................................................ 22 The Presentation of Findings.......................................................................................... 23 Chapter 2: Composition of the Study Sample .................................................................... 25 Characteristics of Reading First and Title I Schools ...................................................... 25 School Characteristics........................................................................................... 25 School Staff........................................................................................................... 26 Student Population ................................................................................................ 28 External Resources to Support Schools’ Reading Programs ................................ 29 Nonfinancial Assistance with K–3 Reading Programs......................................... 30 NCLB Accountability............................................................................................ 31 Summary......................................................................................................................... 32 Chapter 3: Reading Instruction............................................................................................ 35 Instructional Time .......................................................................................................... 35 Amount of Time Spent on Reading Instruction.................................................... 35 Perceived Change in Amount of Time Spent on Reading Instruction.................. 36 Instructional Materials.................................................................................................... 37 Responsibility for Selection of Materials ............................................................. 39 Core Reading Programs ........................................................................................ 42 Use of Supplemental Materials............................................................................. 45 Contents
iii
Contents (cont'd) Instructional Activities and Strategies.............................................................................45 Characteristics of Instruction at the School Level.................................................46 Collaboration on Reading Instruction....................................................................46 Instructional Activities...........................................................................................47 Summary .........................................................................................................................49 Chapter 4: Interventions for Struggling Readers ...............................................................51 Identification for and Availability of Interventions for Struggling Readers ...................51 Availability of Services .........................................................................................52 Methods to Meet the Needs of Struggling Readers.........................................................52 Time Set Aside for Coordination of Interventions Among Teachers and Other Staff....57 Summary .........................................................................................................................59 Chapter 5: Assessment ...........................................................................................................61 Selection and Interpretation of Reading Assessments ....................................................61 Selection of Reading Assessments ........................................................................62 Interpretation of Assessment Results.....................................................................63 Types of Reading Assessments Teachers Find Useful....................................................64 Types of Assessments............................................................................................64 Specific Assessments.............................................................................................66 Classroom Application of Reading Assessment Results .......................................68 Summary .........................................................................................................................70 Chapter 6: Oversight and Classroom Support Activities ...................................................71 Reading Coaches .............................................................................................................71 Responsibilities of Reading Coaches.....................................................................72 Coaching Activities Undertaken by Reading Coaches..........................................77 Responsibility for Oversight of Reading Activities ........................................................81 Role of the School Principal in the Evaluation of K–3 Reading Instruction ..................83 Summary .........................................................................................................................84 Chapter 7: Professional Development..................................................................................87 The Structure of Professional Development Activities Attended by Teachers...............88 The Specific Design Features of Professional Development ..........................................89 Professional Development Related to the Five Dimensions of Reading ........................92 Teachers’ Participation in Professional Development on the Five Dimensions of Reading..............................................................................................................92 Teacher Ratings of Their Preparedness to Teach the Five Dimensions of Reading..............................................................................................................94 Principals’ and Reading Coaches’ Participation in Professional Development on the Five Dimensions of Reading.......................................................................95 Professional Development Related to General Teaching Strategies ...............................95
iv
Contents
Contents (cont'd) Teachers’ Participation in Professional Development on General Teaching Strategies............................................................................................................... 95 Principals’ Participation in Professional Development on General Teaching Strategies............................................................................................................. 100 Reading Coaches’ Participation in Professional Development on General Teaching Strategies............................................................................................. 102 Direct Classroom Support to Teachers for Improving Reading Instruction................. 103 Summary....................................................................................................................... 106 Chapter 8: Summary and Conclusions .............................................................................. 109 Reading Instruction in Reading First Schools and Non-RF Title I Schools................. 109 Limitations.................................................................................................................... 111 Future Activities ........................................................................................................... 111 References ........................................................................................................................... 1133
Appendix A: The Study Samples and the Sampling Weights .......................................... A-1 Appendix B: Survey Instruments ....................................................................................... B-1 Grade 1 Teacher Survey............................................................................................. B-3 Principal Survey ....................................................................................................... B-21 Reading Coach Survey............................................................................................. B-37 Appendix C: Back-up Exhibits ........................................................................................... C-1 Appendix D: The Construct Matrix ................................................................................... D-1
Contents
v
vi
Exhibits E-1:
Nonfinancial External Assistance for K–3 Reading Program Activities in Reading First Schools and Title I Schools, 2004–05 School Year ............................... 4
E-2:
Scheduled Reading Blocks in Reading First and Title I Schools, 2004–05 School Year................................................................................................................... 5
E-3:
Changes to Reading Program Materials for Newly Funded Reading First Schools and Title I Schools, 2004–05 School Year...................................................... 6
E-4:
Types of Assessments Reported by Principals That Were Used to Identify Students for Reading Interventions, in RF and Title I Schools, 2004–05 School Year.................................................................................................... 8
E-5:
Reading Coaches’ Ratings of the Importance of Various Support Activities in Reading First and Title I Schools, 2004–05 School Year........................................... 12
E-6:
The Five Dimensions of Reading Instruction: Reading First and Title I Teacher Participation in and Self-ratings of Preparedness, 2004–05 School Year..... 14
1.1:
Data Collection Methods, Samples, and Schedule...................................................... 21
2.1:
School Enrollment and Urbanicity in Reading First and Title I Schools, 2004–05 School Year.................................................................................................. 25
2.2:
Mobility Rates, Attendance Rates and Changes in Enrollment in Reading First and Title I Schools, 2004–05 School Year ......................................................... 26
2.3:
Years of Experience for Staff in Reading First and Title I Schools, 2004–05 School Year................................................................................................................. 27
2.4:
Teachers’ Self-Ratings on Their Preservice Training to Teach Five Dimensions of Reading: Teachers in Reading First and Title I Schools, 2004–05 School Year.................................................................................................. 28
2.5:
Student Characteristics in Reading First and Title I Schools, 2004–05 School Year. 29
2.6:
Distribution of Reading First Funds to Schools by Average Enrollment, for Reading First Schools, 2004–05 School Year ............................................................ 30
2.7:
Nonfinancial External Assistance for K–3 Reading Program Activities in Reading First and Non-RF Title I Schools, 2004–05 School Year............................. 31
2.8:
Status of Reading First Schools Designated as in Need of Improvement, 2004–05 School Year.................................................................................................. 32
3.1:
Percentage of Mature Reading First Schools and Title I Schools with a Daily Scheduled Reading Block, Length of the Reading Block, and Total Length of Reading Instruction, 2004–05 School Year ................................................................ 36
Exhibits
vii
Exhibits (cont’d) 3.2:
Percentage of Teachers in Mature and New Reading First Schools and Title I Schools Who Changed the Amount of Time Spent Teaching Reading from Previous Year, 2004–05 School Year..........................................................................37
3.3:
Changes to Reading Program Materials for New Reading First and Title I Schools, 2004–05 School Year ....................................................................................39
3.4:
Responsibility for Selection of Reading Materials in RF Schools, 2004–05 School Year..................................................................................................................40
3.5:
Responsibility for Selection of Reading Materials in Mature Reading First and Title I Schools, 2004–05 School Year ..................................................................41
3.6.a: Core Reading Programs Used by Reading First Schools, 2004–05 School Year........43 3.6.b: Core Reading Programs Used by Title I Schools, 2004–05 School Year ...................44 3.7:
Characteristics of Reading Instruction as Reported by Reading Coaches in Mature Reading First and Title I Schools, 2004–05 School Year ...........................46
3.8:
Teacher Reports on the Type and Frequency of Collaboration About Reading in Mature Reading First and Title I Schools, 2004–05 School Year ...........................47
3.9:
Teacher Ratings of the Centrality of SBRR Aligned Instructional Activities in Mature Reading First and Title I Schools, 2004–05 School Year ...........................48
4.1:
Methods Used to Identify Students for Reading Interventions, in Mature Reading First and Title I Schools, 2004–05 School Year............................................52
4.2:
Teachers’ Use of Supports Used to Meet the Needs of Struggling Readers in Mature Reading First and Title I Schools, 2004–05 School Year ...............................54
4.3:
Teachers’ Scores on Composite Measure Extra Practice Provided to Struggling Readers in the Previous Month, in Mature Reading First and Title I Schools, 2004–05 School Year...................................................................................................55
4.4:
Materials Used to Meet the Needs of Struggling Readers in the Last Year, as Reported by the Principals or Reading Coaches in Reading First and Title I Schools, 2004–05 School Year ....................................................................................56
4.5:
Staff Activities Used to Meet the Needs of Struggling Readers in the Previous Year, as Reported by the Principals or Reading Coaches in Reading First and Title I Schools, 2004–05 School Year .........................................................................57
4.6:
Amount of Time Teachers in Reading First and Title I Schools Set Aside to Coordinate Interventions with Staff, 2004–05 School Year....................................58
5.1:
Assistance for K–3 Reading Assessment Activities in Mature Reading First and Title I Schools, 2004–05 School Year ..................................................................61
5.2:
Responsibility for Reading Assessment Activities in Mature Reading First and Title I Schools as Reported by Principals, 2004–05 School Year .......................62
viii
Exhibits
Exhibits (cont’d) 5.3:
Regularly Scheduled and Formal Time Set Aside for K–3, Teachers to Use Assessment Data to Plan Instruction for Mature Reading First and Title I Schools, 2004–05 School Year ................................................................................... 63
5.4:
Types of Assessments (Formal and Informal) Reported as Useful by Mature Reading First and Title I K–3 Teachers, by Assessment Purpose, 2004–05 School Year................................................................................................................. 65
5.5:
Types of Specific Assessments (Formal and Informal) Reported as Useful by Mature Reading First and Title I K–3 Teachers, by Assessment Purpose, 2004–05 School Year.................................................................................................. 67
5.6:
Teachers’ Use of Assessments for Mature Reading First and Title I Schools, 2004–05 School Year.................................................................................................. 69
6.1:
Responsibilities of the Reading Coach in Mature Reading First and Title I Schools, 2004–05 School Year ................................................................................... 72
6.2:
Reading Coaches’ Ratings of the Importance of Teacher Support Activities Related to the Reading Programs in Reading First Schools, 2004–05 School Year................................................................................................................. 74
6.3:
Reading Coaches’ Ratings of the Importance of Various Teacher Support Activities in RF and Title I Schools, 2004–05 School Year ....................................... 75
6.4:
Reading Coaches’ Ratings of the Importance of Administrative and School Support Activities Related to the Reading Programs in Reading First Schools, 2004–05 School Year.................................................................................................. 76
6.5:
Reading Coaches’ Ratings of the Importance of Administrative and School Support Activities, in RF and Title I Schools, 2004–05 School Year ........................ 77
6.6:
Reading Coaches’ Ratings of the Importance of Activities Supporting Teachers’ Instruction in Reading First Schools, 2004–05 School Year ..................... 79
6.7:
Reading Coaches’ Ratings of the Importance of Activities Supporting Teachers’ Instruction in Mature Reading First and Title I Schools, 2004–05 School Year........ 80
6.8:
Responsibility for Oversight of Reading Activities in Mature Reading First and Title I Schools, 2004–05 School Year ................................................................. 82
6.9:
Percentage of Reading First Schools and Title I Schools in Which K–3 Reading Instruction Was Evaluated by the Principal, by Mode and Frequency of Evaluation, 2004–05 School Year............................................................................... 84
7.1:
Structure of Professional Development Activities Attended by Teachers in Mature Reading First and Title I Schools, 2004–05 School Year .............................. 89
7.2:
Characteristics of the Professional Development Activities Reading First Teachers Attended in the Last Year, as Reported by Teachers, Principals and Reading Coaches, 2004–05 School Year ............................................................. 90
Exhibits
ix
Exhibits (cont’d) 7.3:
Specific Features of Professional Development Activities Differences Between Teachers in Mature Reading First and Title I Schools, 2004–05 School Year…........91
7.4:
Teacher Participation in Professional Development Activities Related to the Five Dimensions of Reading: Teachers in Mature Reading First Schools and Title I Schools, The Range of Grade-Level Percents, 2004–05 School Year..............93
7.5:
Preparedness to Teach Five Dimensions of Reading: Teachers in Mature Reading First and Title I Schools, 2004–05 School Year............................................94
7.6:
Professional Development Related to the Five Dimensions of Reading Attended by Principals and Reading Coaches in Mature Reading First and Title I Schools, 2004–05 School Year ..................................................................95
7.7a : Teacher Professional Development on Materials and Teaching Strategies in Reading First Schools, 2004–05 School Year .............................................................96 7.7b: Teacher Professional Development on Grouping and Assessment in Reading First Schools, 2004–05 School Year............................................................................97 7.7c: Teacher Professional Development on Struggling Readers in Reading First Schools, 2004–05 School Year ....................................................................................98 7.7d: Teacher Professional Development on Organization and Planning in Reading First Schools, 2004–05 School Year............................................................................99 7.8:
Professional Development in Teaching Strategies in Mature Reading First and Title I Schools, 2004–05 School Year ................................................................100
7.9:
Reading First Principals’ Participation in Professional Development in Teaching Strategies, 2004–05 School Year...............................................................................101
7.10: Professional Development Events Attended by Principals in Mature Reading First and Title I Schools: Summary and Composite Measures, 2004–05 School Year................................................................................................................102 7.11: Topics Addressed in Professional Development Offered to Reading Coaches in Mature Reading First and Title I Schools, 2004–05 School Year ........................103 7.12: Direct Support for Reading Instruction for Teachers in Mature Reading First and Title I Schools, 2004–05 School Year ...............................................................105
x
Exhibits
Executive Summary The No Child Left Behind Act of 2001 (PL 107-110) established the Reading First Program (Title I, Part B, Subpart 1), a major federal initiative designed to help ensure that all children can read at or above grade level by the end of third grade. Reading First (RF) is predicated on scientifically researched findings that high-quality reading instruction in the primary grades significantly reduces the number of students who experience reading difficulties in later years.
A. Key Provisions of the Reading First Program The Reading First program’s overarching goal is to improve the quality of reading instruction— and thereby improve the reading skills and achievement of children in the primary grades—by providing substantial resources at both the state and local levels. The intent is to ensure that teachers in kindergarten through third grade use reading programs and materials that are research-based. Additionally, Reading First intends to increase access to and the quality of professional development for all teachers of these grades, including special education teachers, to ensure that they have the necessary skills to teach these researched-based reading programs effectively. An important provision of the RF legislation is that professional development be made available to all schools, not only schools that received RF funding. A third emphasis is on using assessments, both to monitor progress and to identify students’ reading problems early on. Reading First is intended to help prepare classroom teachers to screen for, identify, and overcome barriers to students’ ability to read at grade level by the end of third grade. More specifically, the programs and the professional development provided to school staff must use reading instructional methods and materials that incorporate the five essential elements of effective primary-grade reading instruction, as specified in the legislation: 1) phonemic awareness; 2) decoding; 3) vocabulary development; 4) reading fluency, including oral reading skills; and 5) reading comprehension strategies. All 50 states and other jurisdictions1 have been awarded Reading First grants. To date (April 2006), states have awarded subgrants to approximately 1,550 local school districts and, in turn, these districts have provided funds to approximately 5,200 schools nationwide. Because grants to states were awarded over an extended time period and states differed in the amount of time they allotted to their competitive subgrant processes, districts and schools are at various stages of implementing their Reading First programs.
B. Overview of the Evaluation The enabling legislation for RF requires the U.S. Department of Education (ED) to contract with an outside entity to evaluate the program’s implementation (Section 1205). To meet this
1
State Education Agencies (SEAs) were eligible to apply for RF grants. Other jurisdictions eligible include District of Columbia, the schools of the Bureau of Indian Affairs, and American Samoa. Guam and Northern Mariana Islands received grants through the consolidated grants to insular areas..
Executive Summary
1
requirement, the Department contracted with Abt Associates in October 2003 to design and conduct the Reading First Implementation Evaluation, which addresses the following questions: 1. How is the Reading First program implemented in districts and schools? 2. How does reading instruction differ between Reading First schools and non-RF Title I schools? 3. How does reading instruction differ between Reading First schools and non-RF Title I schools as RF schools’ implementation efforts mature over time? 4. Does student achievement improve in schools with Reading First funds? 5. Is there any relationship between how schools implement Reading First and changes in reading achievement? The five-year study has produced this interim report based on data collected during the 2004–05 school year as well as analyses of extant data sources; it will also produce a final report in 2007 based on data from the 2006–07 school year and updated extant data. This interim report addresses questions 1 and 2. Question 3 requires an analysis of longitudinal data and will be addressed upon completion of the second wave of data collection in 2007, as will questions 4 and 5. Below we summarize key findings from the evaluation, using the following data sources: •
• •
•
Surveys completed in spring 2005 by 6,185 K–3 teachers, 1,574 principals, and 1,318 reading coaches in nationally representative samples of 1,092 Reading First schools and 541 non-RF Title I schools; Interviews with Reading First state coordinators, and reviews of states’ applications for RF awards; The Reading First Awards Database that lists all RF districts and schools as well as their baseline measures of K–3 reading performance and poverty rates (as measured by percent of students receiving free and reduced-price lunches); and ED’s School-Level State Assessment Score Database (SLAD) that provided measures of reading achievement and poverty for all school districts nationwide.
The non-RF Title I school sample was constructed purposefully to provide a context for understanding how reading programs in a sample of Reading First schools differ from those in schools serving similar populations of students.2 The non-RF sample includes only Title I schoolwide project (SWP) schools with at least 40 percent of the students eligible for free or reduced price lunches, which is comparable to the RF school population. The two groups of schools are demographically similar in staff experience, attendance rates, mobility, and stability of enrollment. RF schools are, however, on average, larger than the Title I schools, and have larger proportions of K–3 students reading below grade level. 2
The most rigorous design option available for this evaluation would have been to identify a group of non-RF schools matched to RF schools on key demographic and achievement characteristics to minimize differences between RF and non-RF schools and thereby approximate a random assignment experiment. However, because RF schools, by definition, are among the lowest performing schools in their respective districts, matched comparison schools could include better performing schools. Also, RF schools could likely differ from similar non-funded schools because, often, they had to demonstrate motivation, and this factor could influence any observed instructional differences between RF and comparison schools.
2
Executive Summary
We can make comparisons between RF and non-RF Title I samples, but because the two samples are not matched they cannot be assumed to be equivalent. Thus, the differences between the groups discussed in this report cannot be attributed to the Reading First program.
C. Results of the Reading First Implementation Evaluation Key Finding Reading First schools appear to be implementing the major elements of the program as intended by the legislation, such as providing scientifically based reading instruction in grades K–3, increased amounts of time for reading instruction, interventions for struggling readers, wider use of classroom-based reading assessments, and more professional development activities. External Resources to Support Reading Programs Key Findings Reading First schools received both financial and nonfinancial support from a variety of external sources. During the 2004–05 school year, the median annual amount of funds RF schools received to implement their reading program was $138,000. In addition, Reading First schools have multiple external resources, in addition to RF funds, to support the implementation of their reading programs. Most RF schools also received Title I funds (91 percent) and district funds (79 percent) to support their reading programs. Exhibit E-1 illustrates that beyond financial support, according to principals, RF schools received substantially more external assistance than did Title I schools on selecting instructional programs (76 percent vs. 56 percent), diagnosing needs of struggling readers (70 percent vs. 50 percent), conducting demonstration lessons (71 percent vs. 48 percent), and reviewing the effectiveness of reading programs (71 percent vs. 47 percent).
Executive Summary
3
Exhibit E-1 Nonfinancial External Assistance for K–3 Reading Program Activities in Reading First Schools and Title I Schools, 2004–05 School Year
Reading First
Percent 100
Title I 80*
80 60
81*
76*
71*
71*
70*
48
49
50
56 50
47
40 20 0 Conducting Demonstration lessons
Conducting Classroom observation
Diagnosing needs of struggling readers
Selecting instructional programs /materials
Reviewing Providing TA in implementing reading program effectiveness core reading programs
Source: Principal Survey, Question B7. Exhibit reads: 71 percent of principals in RF schools reported receiving external assistance in conducting demonstration lessons, compared to 48 percent of principals in Title I schools. This difference is statistically significant (p < .05). Note: The stars (*) indicate that there is a statistically significant difference (i.e., p-value ≤ .05) between RF and Title I schools. TA stands for technical assistance.
Reading Instruction in K–3 Classrooms Key Finding Classroom reading instruction in RF schools is significantly more likely to adhere to the RF legislation than that in Title I schools. Reading instruction encompasses the amount of instructional time, use of appropriate reading materials, and implementing reading activities and strategies supported by scientifically based reading research. Instructional Time The Guidance for the Reading First Program states that schools “should consider the allocation of time, including a protected, uninterrupted block of time for reading instruction of more than 90 minutes per day.” Significantly more RF schools than Title I schools reported having a reading block for each of grades K through 3 (grades 1–3; 98 percent vs. 92 percent, kindergarten; 98 percent vs. 88 percent, Exhibit E-2). Teachers in Reading First schools reported, on average, that they spent significantly more time on reading than did teachers in non-RF Title I schools—a difference of about 19 minutes per day, or almost 100 minutes per week. Teachers in newly funded RF schools were also significantly more likely than teachers in non-RF Title I
4
Executive Summary
schools to report that they had increased the amount of time spent on reading from the 2003–04 to the 2004–05 school years (61 percent vs. 35 percent).3 Exhibit E-2 Scheduled Reading Blocks in Reading First and Title I Schools, 2004–05 School Year
98 * Grades 1–3 92 Grades 1–3
98* Kindergarten 88
0
20
40
60
80
100
Percent of Schools with Reading Block Source: Reading Coach Survey and Principal Survey, Questions D2 and D3. Exhibit reads: 98 percent of RF schools reported having a scheduled block at grades 1–3, compared with 92 percent of Title I schools (p ≤ .05). Note: The stars (*) indicate that there is a statistically significant difference (i.e., p-value ≤ .05) between RF and Title I schools.
Staff in RF schools also reported (using a five-point scale4) having significantly more time set aside than staff in non-RF Title I schools to use assessment data to plan instruction (3.88 vs. 3.38); to observe reading instruction in other classrooms (2.21 vs. 1.96); to collaborate on reading lesson planning and instruction (4.23 vs. 3.88); and to receive instruction themselves from a reading coach (once a month on average for RF schools, vs. four or fewer times per year in non-RF Title I schools). Instructional Materials Reading First schools reported that they have made substantial changes to their reading programs since they received their RF funds in the 2004–05 school year (Exhibit E-3). Newly funded RF schools were significantly more likely than Title I schools to have adopted a new core reading program (39 percent vs. 16 percent), to have added new intervention programs for struggling readers (74 percent vs. 43 percent), to have added new supplementary materials (69 percent vs. 58 percent), and to have adopted new materials for English Language Learners (43 percent vs. 29 percent). 3
For this comparison, we used the newly funded RF schools since the mature RF schools may have already increased their instructional time in their first year of implementation, 2002–03. That said, about 45 percent of the mature RF schools reported increasing their instructional time in the 2004–05 school year.
4
The scale represents how often schools reported time being set aside during the school year: 1 = Not at all, 2 = 1–4 times, 3 = 5–8 times, 4 = Once a month, and 5 = Once a week or more.
Executive Summary
5
Exhibit E-3 Changes to Reading Program Materials for Newly Funded Reading First Schools and Title I Schools, 2004–05 School Year Percent
Reading First
100
Title I 74*
80
71*
69* 58
60 43
39*
43*
40
29
36
16
20 0
Adopted a new core reading program
Added a new intervention program for struggling readers
Added new supplementary materials
Added new materials for ELLs
Adopted new reading assessments
Source: Reading Coach Survey Question C3 and Principal Survey, Question D7. Exhibit reads: 39 percent of the newly funded Reading First schools reported adopting a new core reading program at the beginning of the 2004–05 school year, compared with 16 percent of Title I schools. This difference is statistically significant (p ≤ .05). Note: The stars (*) indicate that there is a statistically significant difference (i.e., p-value ≤ .05) between RF and Title I schools.
Staff in mature RF schools were significantly more likely than staff in non-RF Title I schools to rate (on a five-point scale) the following statements about their schools’ reading programs more positively: • • •
The core reading program is aligned with scientifically based reading research (SBRR) (4.63 vs. 4.29). Reading intervention materials are aligned with SBRR (4.38 vs. 4.22). High-quality instructional materials are available (4.39 vs. 4.01).
Despite evidence of greater alignment with SBRR, staff in mature RF schools recognized their lack of experience working with some materials. They were significantly more likely than staff in non-RF Title I schools to rate (also on a five-point scale) the following statements more negatively: 1) Teachers are experienced with supplemental reading materials (3.29 vs. 3.58); and 2) Teachers are experienced with reading intervention materials (3.19 vs. 3.39). This may reflect the fact that many of these materials are new in RF schools. Instructional Strategies Reading instructional activities and strategies in RF schools appear to be aligned with the tenets of the Reading First program. Differences in instructional environments between mature RF and
6
Executive Summary
non-RF Title I schools were manifested in a variety of ways.5 RF teachers across all grades (K– 3) rated as central a greater proportion of SBRR-aligned practices than did teachers in Title I schools: These statistically significant differences were modest in size (e.g., second grade: 76 percent vs. 72 percent), although the difference for kindergarten teachers was somewhat larger (77 percent vs. 68 percent). When asked specifically about the centrality of instruction in the five dimensions of reading, similar patterns emerge. There are differences that are modest in magnitude. Kindergarten and first-grade teachers rated as central to their instruction a significantly higher proportion of scientifically based practices in teaching phonemic awareness and decoding than did teachers in Title I schools (kindergarten: 91 percent vs. 86 percent; first grade: 85 percent vs. 81 percent). RF third-grade teachers rated as central to their instruction a significantly higher proportion of scientifically based practices in teaching vocabulary and fluency than did their Title I counterparts (vocabulary, 75 percent vs. 70 percent; fluency. 56 percent vs. 47 percent). There were no differences between RF and Title I teachers in their centrality ratings related to teaching comprehension skills. Interventions for Struggling Readers Key Findings RF teachers in three grades (kindergarten, second, and third) were significantly more likely than their counterparts in Title I schools to place their struggling students in intervention programs. Based on principal reports, in both RF and Title I schools, there was no time delay between identifying students who need interventions and the provision of services to those students. RF and Title I schools were also similar with respect to planning and coordinating instruction for ELL students. Although significantly more RF teachers reported receiving professional development in helping struggling readers than did Title I teachers, teachers in both RF and Title I schools recognized the challenge of providing effective instruction to struggling readers; 80 percent of teachers in both groups reported that they need additional professional development on this topic. Exhibit E-4 indicates that RF schools were more likely to rely on progress monitoring (98 percent vs. 90 percent) and reading coach recommendations to identify struggling readers (92 percent and 55 percent) than were Title I schools. Although there were no differences in 5
We constructed six composites to summarize teachers’ ratings of the centrality of a series of instructional activities associated with the following reading dimensions and other instructional features: 1) phonemic awareness and decoding; 2) vocabulary; 3) comprehension; 4) fluency; 5) use of scientifically based instructional strategies and materials; and 6) negative alignment with scientifically based reading research. (See Appendix D for a list the specific items included in each composite.) Scores were computed for each composite based on the percentage of instructional activities specified in that composite that a teacher rated as “central to their instruction.”
Executive Summary
7
principal reports of the use of diagnostic tests, RF teachers across all grades were significantly more likely to rely on diagnostic assessments to determine their struggling readers’ core deficits than were teachers in Title I schools (74 percent vs. 64 percent). Exhibit E-4 Types of Assessments Reported by Principals That Were Used to Identify Students for Reading Interventions, in RF and Title I Schools, 2004–05 School Year
Type of Test Progress monitoring tests Tests from core reading program Diagnostic tests Reading coach recommendation
1
Reading First Schools
Title I Schools
Percent
Percent
98%* 95 91 92*
90% 92 91 55
Standardized achievement tests 88 88 Screening tests 87* 82 Source: Principal Survey, Question E2. Exhibit reads: Reading First schools are more likely to use progress monitoring tests to identify students for reading interventions than are Title I schools (98 percent vs. 90 percent. This difference is statistically significant (p ≤ .05). 1. Only schools that have reading coaches are included in the analysis of this item. Note: The stars (*) indicate that there is a statistically significant difference (i.e., p-value ≤ .05) between RF and Title I schools.
Despite these differences in the identification of struggling readers, there were no substantive or statistically significant differences between RF and Title I schools in terms of availability of intervention services for struggling readers; about 80 percent of both RF and Title I principals reported that reading intervention services are available when needed. Nor did the average waiting time for students’ receipt of services differ significantly between RF and Title I schools; two-thirds of the principals reported no wait time for students in need of intervention. On average, identified students received services within approximately one week. RF and Title I schools are more similar than different with respect to coordinating instruction for ELL students. There were no significant differences between RF and Title I teachers in reported time set aside to coordinate instruction with ELL staff; in fact, more than one-third of teachers who have ELL students in their classrooms (in both groups of schools) reported that no such time is specifically set aside. Only about 10 percent of teachers reported that they had weekly meetings with ELL staff to coordinate reading instruction for their struggling ELL students. It is important to note here, however, that some schools may not have any ELL teachers on staff. RF and Title I schools do differ in the provision of special education services to struggling readers. Title I schools were significantly more likely than RF schools to have a certified special education teacher provide recommendations to plan instruction for struggling readers (83 percent vs. 72 percent). RF teachers in kindergarten, first, and second grades were significantly more likely than Title I teachers to report that time is not set aside for coordination of the reading 8
Executive Summary
instruction provided to their special education students (kindergarten: 51 percent vs. 44 percent; first grade: 42 percent vs. 35 percent; second grade: 37 percent vs. 30 percent). RF teachers were more likely to report increased amounts of time for struggling readers to practice skills in several dimensions of reading. RF teachers in three of four grades reported providing practice in significantly more reading dimensions than did teachers in Title I schools (kindergarten: 2.75 vs. 2.66; second grade: 2.83 vs. 2.78; third grade: 2.71 vs. 2.45). These differences, while statistically significant, are substantively quite small. RF third-grade teachers were significantly more likely than Title I teachers to provide struggling readers with extra practice in decoding (92 percent vs. 82 percent) and fluency (97 percent vs. 90 percent); there were no significant differences for the other grades. In terms of materials, RF teachers were also more likely to draw upon resources external to the core reading program to support struggling readers. Kindergarten and third-grade teachers in RF schools were significantly more likely than their counterparts in Title I schools to use materials that supplement the core reading program (kindergarten teachers: 70 percent vs. 62 percent; third-grade teachers 74 percent vs. 66 percent). There were no significant differences in first or second grade. RF teachers in first and second grade were significantly more likely than teachers in Title I schools to provide in-class help in reading for ELL students (66 percent vs. 55 percent). Kindergarten and third grade were not significantly different.
Assessment Key Findings Assessment plays an important role in reading programs in both RF and non-RF Title I schools. Reading First schools received more outside assistance in selecting assessments than Title I schools. At the same time, staff in both RF and Title I reported that the district is largely responsible for the selection and interpretation of reading assessments. There were some differences in the types of assessments teachers in Reading First schools and teachers in non-RF Title I schools found useful. RF teachers were more likely to identify assessments from their core or supplementary reading programs as useful than are teachers in Title I schools. In contrast, Title I teachers were more likely to report that informal assessments are useful than are RF teachers. Teachers in RF schools were more likely to report applying assessment results for varied instructional purposes (e.g., for planning grouping, progress monitoring and identifying struggling readers) than their Title I counterparts.
Executive Summary
9
Selection and Interpretation of Reading Assessments Reading First schools received significantly more outside assistance (from district, state, publisher, university expert, etc.) than did non-RF Title I schools in selecting assessment instruments for their K–3 reading program (76 percent vs. 56 percent) and interpreting assessment results (82 percent vs.70 percent). Overall, there were many similarities in RF and non-RF Title I principals’ reports of who is responsible for the selection and interpretation of reading assessments. More than three-quarters of both RF and non-RF Title I principals identified the district as responsible for selecting assessments. There were, however, some differences. Half of RF principals (51 percent) also reported state responsibility for selecting assessments, compared to 31 percent of non-RF Title I principals. In 54 percent of non-RF Title I schools, the principal also held this responsibility, compared to only 40 percent of RF principals. Nearly all, about 90 percent, Reading First and non-RF Title I principals reported that they, as principals, were responsible for interpreting assessment results. In 93 percent of RF schools, the reading coach also assumed responsibility for this task, compared to only half of Title I principals (52 percent). This significant difference reflects the fact that, in contrast to Reading First schools, Title I schools were much less likely to have a designated reading coach. Eighty-four percent of RF teachers reported that they had regularly scheduled, formal time set aside to use assessment data to plan instruction, compared with 74 percent of non-RF Title I teachers. Types of Reading Assessments Teachers Find Useful Most teachers in both RF and Title I schools named at least one assessment that they found useful in placing or grouping students (90 percent), determining student mastery of skills (89 percent), and identifying the core deficits of struggling students (85 percent). In general, RF teachers were significantly more likely to identify formal assessments as useful than Title I teachers. In contrast, Title I teachers were more likely to report the usefulness of informal assessments than were RF teachers. Across assessment purposes, Reading First teachers were more likely than their Title I counterparts to identify assessments from the core or supplementary reading program (e.g., for determining student mastery of skills, 50 percent vs. 38 percent) or standardized tests (e.g., for placing or grouping students, 50 percent vs. 44 percent), such as the DIBELS (e.g., for identifying the core deficits of struggling students, 33 percent vs. 10 percent). In contrast, across the three uses of assessments, Title I teachers were significantly more likely to identify informal assessments as useful than were Reading First teachers (e.g., for determining student mastery of skills, 38 percent vs. 28 percent). Specifically, Title I teachers were more likely to report classroom-based assessments (e.g. for identifying the core deficits of struggling students, 24 percent vs. 17 percent) and running records or miscue analysis (e.g., for placing or grouping students, 19 percent vs. 10 percent) as useful than Reading First teachers. 10
Executive Summary
Most K–3 teachers in both Reading First and Title I schools named at least one assessment that they found useful in placing or grouping students (90 percent), determining student mastery of skills (89 percent), and identifying the core deficits of struggling students (85 percent). However, a significantly greater percentage of RF teachers reported that they use assessment results to organize instructional groups (83 percent vs. 73 percent), to determine progress on skills (85 percent vs. 78 percent), and to identify students who need reading intervention services (75 percent vs. 65 percent) than did Title I teachers. Oversight and Classroom Support Activities Key Findings Principals in Reading First schools were significantly more likely to report having a reading coach than were principals of non-RF Title I schools.6 Coaches in RF schools were significantly more likely to provide teachers with various supports for their reading instruction than were coaches in non-RF Title I schools. Reading First schools were significantly more likely to have a reading coach (98 percent vs. 60 percent) than were non-RF Title I schools, as reported by the principal, reflecting the fact that nearly all states required RF schools (but not non-RF Title I schools) to have a reading coach. Of the Title I schools that reported having reading coaches, 88 percent have a coach that is doing the central activities of a reading coach.7 In Reading First schools, reading coaches are intended to work primarily with teachers rather than directly with students. It is therefore noteworthy that a significantly smaller percentage of reading coaches in RF schools reported that providing direct reading instruction to students is absolutely central to their work: 29 percent, compared to 53 percent in non-RF Title I schools (Exhibit E-5). Reading coaches in mature Reading First schools were significantly more likely than their nonRF Title I counterparts to rate the following teacher support activities as absolutely central to their work: providing training or professional development (95 percent vs. 87 percent), coaching staff on a range of topics (92 percent vs. 83 percent), organizing professional development (87 percent vs. 67 percent), and facilitating grade-level meetings (67 percent vs. 47 percent).
6
Most states require RF schools to employ reading coaches to support teachers’ reading instruction; this is not the case for non-RF Title I schools.
7
Because respondents from non-RF Title I schools who completed the Reading Coach Survey reported a multiplicity of job titles, we used their responses to two survey questions to determine their inclusion in the comparison group of reading coaches: How central is each of the following activities? 1) “Coaches staff on a range of topics”; and 2) “Organizes professional development for K–3 teachers.” Respondents who answered a 3 (“somewhat central”) or above (on a 5-point scale) for at least one of these two items were included in the comparison group of reading coaches from Title I schools for these sets of analyses regarding reading coach responsibilities. As a result, 34 reading coach respondents from Title schools, the equivalent of 940 weighted respondents, were excluded from these analyses.
Executive Summary
11
Reading coaches in mature Reading First schools were significantly more likely than their nonRF Title I counterparts to report that the following administrative support activities were absolutely central to their work: compiling reading assessment data (88 percent vs. 67 percent) and administering or coordinating reading assessments (86 percent vs. 67 percent). About 75 percent of both mature RF and non-RF Title I schools reported participating in school leadership team meetings, and about 70 percent of both types of schools reported managing reading instructional materials, as absolutely central to their work (with no significant differences). Significantly more reading coaches in mature RF schools, compared with coaches in non-RF Title I schools, characterized participating in professional development (97 percent vs. 86 percent) as absolutely central to their work.
Exhibit E-5 Reading Coaches’ Ratings of the Importance of Various Support Activities in Reading First and Title I Schools, 2004–05 School Year
Reading Activity/ Centrality of the Activity
Mature Reading First Title I Schools Schools Activity Rated as “Absolutely Central” Percent Percent
Teacher Support: Facilitate grade-level meetings Coach staff on a range of topics Provide direct reading instruction to students Organize professional development for K–3 teachers Provide training/professional development in reading materials, strategies, and assessments Give demonstration lessons with core/supplemental materials Observe and provide feedback to teachers Assist teachers in forming instructional groups Help teachers design strategies for struggling readers Give demonstrations on assessment administration/scoring
67%* 92* 29 67* 95*
47% 83 53* 47 87
79*
70
84* 85* 90 71*
69 68 86 56
Administrative Support Administer reading assessments 86* 67 Participate in school leadership team meetings 76 75 Compile reading assessment data 88* 67 Source: Reading Coach Survey, Question B4. Exhibit reads: 67 percent of reading coaches in RF schools rate facilitating grade-level meeting as “central” to their work, compared with 47 percent of reading coaches in Title I schools. This difference is statistically significant (p < .05). Note: The stars (*) indicate that there is a statistically significant difference (i.e., p-value ≤ .05) between reading coaches in RF schools and reading coaches in Title I schools. The responses of 34 reading coaches (940 weighted) from non-RF Title I schools from this analysis because, based on their survey responses, they did not appear to meet the definition of ”reading coach.”
12
Executive Summary
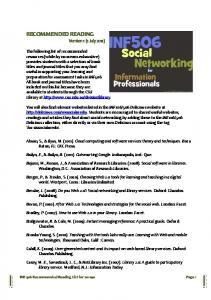
Professional Development Key Findings RF staff received significantly more professional development than did Title I staff. RF teachers were more likely to have received professional development in the five dimensions of reading instruction as well as in overall teaching strategies. Indeed, RF teachers reported feeling better prepared to teach the five dimensions of reading than their Title I counterparts. Activities attended by RF teachers were more likely to have structural attributes conducive to a successful experience, such as incentives and follow-up activities, than those attended by teachers in non-RF Title I teachers (Corcoran, 1995; Corcoran, et al., 2003; Garet, et al., 1999; Learning First Alliance, 2003). Significantly more Reading First teachers attended professional development workshops related to reading than did non-RF Title I teachers (94 percent vs. 81 percent). Further, RF teachers, on average, reported having spent significantly more time attending professional development activities—conferences, workshops, college courses—in the past year than did teachers in nonRF Title I schools (40 hours vs. 24 hours). Based on teacher reports, professional development activities attended by RF teachers, as compared with non-RF Title I teachers, were significantly more likely to: • • • •
Offer incentives for participation, such as stipends (40 percent vs. 20 percent), release time (43 percent vs. 33 percent), or graduate credits (25 percent vs. 14 percent). Be conducted by well-established and experienced trainers (75 percent vs. 65 percent). Require teachers to attend (74 percent vs. 57 percent). Use a team-based approach (67 percent vs. 53 percent).
RF principals, reading coaches and teachers reported having participated in significantly more professional development activities to improve their knowledge of the five dimensions of reading instruction than did Title I teachers (Exhibit E-6). For example, significantly more RF than Title I teachers received professional development in phonemic awareness (85 percent vs. 62 percent). RF teachers rated themselves (on a five-point scale) as significantly better prepared to teach the following skills than did Title I teachers: phonemic awareness, 4.13 vs. 3.66; decoding, 3.86 vs. 3.35; vocabulary, 3.79 vs. 3.40; comprehension, 3.80 vs. 3.54; and fluency, 3.83 vs. 3.40.
Executive Summary
13
Exhibit E-6 The Five Dimensions of Reading Instruction: Reading First and Title I Teacher Participation in and Self-ratings of Preparedness, 2004–05 School Year Reading First Title I 85
***
62
Phonemic Awareness
63
Decoding
86
*** 74
***
4.13 3.66
3.86
Vocabulary
52 87
***
Comprehension
75
3.35
**
3.79 3.40
**
3.80 3.54
**
86
3.83 Fluency *
69
*** 100
**
80
60
40 Percent
20
0
**
3.40
0
1
2
3
4
5
Self-ratings of preparedness to teach the five dimensions of reading
Source: Teacher Survey, Questions D4 and D6 Exhibit reads: 85 percent of RF teachers participated in professional development on phonemic awareness, compared to 62 percent of teachers in Title I schools. This difference is statistically significant (p < .05). Note: Kindergarten teachers where not asked about fluency. The stars (*) indicate that there is a statistically significant difference (i.e., p-value ≤ .05) between teachers in RF and Title I schools.
RF teachers were significantly more likely than teachers in Title I schools to report having received professional development assistance on administering and using assessments (85 percent vs. 67 percent), interpreting assessment data (90 percent vs. 68 percent), and using diagnostic tests to guide instruction (66 percent vs. 49 percent). Reading coaches and principals also received professional development to support them in their roles. RF reading coaches were significantly more likely than their non-RF Title I counterparts to report having received professional development assistance on how to help teachers make reading instruction systematic and explicit (78 percent vs. 52 percent), and on the essential components of SBRR instruction (90 percent vs. 60 percent). Both of these topics are central to the Reading First program. Similarly, principals in RF schools were significantly more likely to report having received professional development in all five dimensions of reading than were principals in Title I schools (p < .05 for all five dimensions).
Conclusions These findings provide some preliminary evidence to suggest that Reading First is being implemented in schools and classrooms as intended by the legislation. For the most part, funds are awarded to appropriate districts and schools. States are providing appropriate supports, 14
Executive Summary
particularly in terms of professional development related to reading, and in the selection and use of assessments to inform instruction. Reading First schools appear to have established instructional environments to support SBRR-based reading instruction. In K–3 classrooms, the reading programs implemented by teachers in Reading First and non-RF Title I schools appear to be different in a variety of ways, including instructional time, resources, instructional planning and collaboration, use of assessments, and focus on the five dimensions of reading instruction. Taken together, these findings provide some initial evidence to suggest that Reading First schools are carrying out the objectives of the Reading First legislation. Future analyses, after the second round of survey data collection in 2007, will examine how implementation of these elements changes over time and how student achievement patterns in RF schools may differ from those in non-RF Title I schools.
Executive Summary
15
16
Executive Summary
Chapter 1: Introduction In October 2003, the Department contracted with Abt Associates to design and conduct the Reading First Implementation Evaluation to address the following questions: 1. How is the Reading First program implemented in districts and schools? 2. How does reading instruction differ in Reading First schools and non-grantee Title I schools? 3. How does reading instruction differ in RF schools and non-grantee Title I schools as RF schools’ implementation efforts mature over time? 4. Does student achievement improve in schools with Reading First funds? 5. Is there any relationship between how schools implement Reading First and changes in reading achievement? The present report focuses on Questions 1–2. Questions 3–5 will be discussed in the final report.
Background The ability to read and comprehend text well is at the heart of educational attainment and, as such, is central to all children’s elementary school success. Unfortunately, success in elementary school (and beyond) disproportionately eludes many minority and economically disadvantaged children. Large numbers of minority children, often in high-poverty schools, are not developing the reading skills needed for success in school. Results from the 2005 National Assessment of Educational Progress (NAEP) Reading Assessment indicate that 54 percent of fourth-grade students eligible for free or reduced-price lunches read at a Below Basic level compared to only 23 percent of fourth-graders not eligible for free or reduced-price lunches who perform at that level.8 Although these results are disappointing, these findings are an improvement over the 2000 NAEP results where 62 percent of students eligible free or reduced price lunches scored at the Below Basic level (U.S. Department of Education, 2005). Scientifically Based Reading Research The fact that substantial numbers of our nation’s primary grade students are not developing adequate reading skills occurs at a time when we have made considerable progress in understanding how to teach reading effectively in the early grades, particularly to children who are struggling academically. The National Research Council’s 1998 report, Preventing Reading Difficulties in Young Children, noted that, “the majority of the reading problems faced by today’s adolescents and adults could have been avoided or resolved in the early years of childhood.” The 8
Performance at the Below Basic level means that fourth-grade students are not performing at the Basic level. “Fourth-grade students performing at the Basic level should demonstrate an understanding of the overall meaning of what they read. When reading text appropriate for fourth-graders, they should be able to make relatively obvious connections between the text and their own experiences and extend the ideas in the text by making simple inferences.” (National Center for Education Statistics, retrieved May 10, 2006, from http://nces.ed.gov/nationsreportcard/reading/achieveall.asp#grade4).
Chapter 1: Introduction
17
report’s summary of research on the development of early reading skills concluded that many elements of effective reading instruction are already known, and that the provision of “excellent instruction is the best intervention for children who demonstrate problems learning to read.” Building on the council’s report, the National Reading Panel9 reviewed the scientific research in key areas of reading development, focusing on skills critical to the acquisition of beginning reading skills. The report found strong evidence that direct, explicit instruction is helpful to primary grade children in the development of their reading skills, particularly in the areas of phonemic awareness, phonics, vocabulary, comprehension, and fluency. The Reading First Legislation The No Child Left Behind Act of 2001 (PL 107-110) established the Reading First Program (Title I, Part B, Subpart 1) to address the fact that large numbers of our nation’s students do not develop the reading skills necessary to be successful in school. Reading First is a major federal initiative that builds on years of scientific research in reading to ensure that all children can read at or above grade level by the end of third grade. The legislation requires the U.S. Department of Education to contract with an outside entity to conduct an evaluation of, among other things, the Reading First (RF) program’s implementation (Section 1205). Reading First is predicated on research findings that high-quality reading instruction in the primary grades significantly reduces the number of students who experience difficulties in later years. The program’s overarching goal is to improve the quality of reading instruction and thereby improve the reading skills and achievement of children in the primary grades. The RF program provides substantial resources at both the state and local levels: 1) to ensure that research-based reading programs and materials are used to teach students in kindergarten through third grade; 2) to increase access to and quality of professional development of all teachers who teach K–3 students, including special education teachers, to ensure that they have the skills necessary to teach these reading programs effectively; and 3) to help prepare classroom teachers to screen, identify, and overcome barriers to students’ ability to read on grade level by the end of third grade. More specifically, the programs and the professional development provided to school staff must use reading instructional methods and materials that incorporate the five essential elements of effective primary-grade reading instruction, as specified in the legislation: 1) phonemic awareness; 2) decoding; 3) vocabulary development; 4) reading fluency, including oral reading skills; and 5) reading comprehension strategies. In April 2002, the U.S. Department of Education invited state education agencies to apply for Reading First grants. State applications submitted to the U.S. Department of Education went 9
18
The National Reading Panel (NRP) was formed under the joint auspices of the National Institute of Child Health and Human Development and the U.S Department of Education to “assess the status of research-based knowledge, including the effectiveness of various approaches to teaching children to read” (Report of the National Reading Panel: Teaching Children to Read, 2000, page 1-1.) The findings from the NRP also were instrumental in the development of the Reading First program (part of the No Child Left Behind Act), the current administration’s comprehensive effort to improve early reading instruction and student reading achievement. Chapter 1: Introduction
through an expert review process that resulted in six-year awards dependent on demonstration of progress and congressional appropriations. States, in turn, awarded subgrants to local school districts based on a competitive process. All10 states and jurisdictions have been awarded Reading First grants. To date (April 2006), states have awarded subgrants to approximately 1,550 local school districts and 5,200 schools nationwide.11 Because grants to states were awarded over an extended time period and states differed in the amount of time allotted to subgrant process, districts and schools are at various stages of implementation of their Reading First programs. The Implementation Evaluation is one of five complementary studies designed to gather information about Reading First. In addition to the Implementation Evaluation, the U.S. Department of Education’s Policy and Program Studies Service (PPSS) conducted the Analyses of State Reading Standards and Assessments that evaluated the alignment of state reading content standards for students in grades K–3 with the five key elements of reading instruction by analyzing: 1) the reading content standards of a random sample of 20 states; and 2) the role of state assessments in measuring Reading First outcomes as presented in state Reading First applications. PPSS is also conducting the study of Reading First and Special Education Participation Rates, which will use an interrupted time-series design to: 1) compare rates of learning disabilities in Reading First schools with a comparison group of schools; 2) investigate changes in these rates in RF schools before and after grants were awarded; and 3) examine the relationship between reading achievement and rates of learning disabilities. The U.S. Department of Education’s Institute of Education Sciences is conducting two studies related to Reading First. The Reading First Impact Study is a five-year rigorous evaluation designed to measure the impact of Reading First on classroom reading instruction and students’ reading achievement. The study is being conducted in more than 250 elementary schools in 18 sites and 13 states and will collect information on students and classrooms in grades 1–3 over the course of three years. The Study of Teacher Preparation in Early Reading Instruction will conduct a survey of preservice teachers at 100 schools of education to answer the question: To what extent does the content of teacher preparation programs focus on the essential components of early reading instruction? In addition, the study will administer an assessment to a random sample of 2,000 graduating preservice elementary teachers to answer the question: To what extent are graduating preservice teachers knowledgeable about the essential components of early reading instruction?
The Study Design The evaluation included the following components: 1) surveys of teachers, principals and reading coaches in nationally representative samples of Reading First schools and non-RF Title I (non–Reading First) schools; 2) interviews with Reading First state coordinators; 3) the Reading 10
Guam and Northern Mariana Islands received grants through consolidated grants to the insular areas.
11
The figures are based on current information listed on ED’s Reading First Awards Database (Retrieved April 1, 2006, from www.sedl.org/readingfirst/reports-awards.html).
Chapter 1: Introduction
19
First Awards Database that lists all RF districts and schools as well as school and district poverty rates and proportions of K–3 students reading below grade level; and 4) ED’s School-Level State Assessment Score Database (SLAD) that provides measures of poverty for all school districts nationwide. Exhibit 1.1 summarizes the primary data collection activities. The sample design calls for two nationally representative samples of Reading First schools—550 newly funded schools that are in their first year of implementation, and 550 mature schools that have been implementing RF activities for one year or more—along with 550 Title I (non–Reading First) schools.12 The principal, reading coach (if applicable), and one teacher (randomly selected) from each of the four target grades of Reading First (K–3) were sent surveys to complete. Also, the study design calls for two waves of data collection in the 2004–05 and 2006–07 school years. The present report describes findings based on the data collected in spring 2005.13 Below we describe the survey and state coordinator data collections, including brief descriptions of the measures, and include discussions of the sampling strategy and data collection along with the corresponding response rates.
12
For the purpose of recruiting these two types of RF schools, schools were designated as new or mature based on the Reading First program guidelines to states for their annual performance reports; “…schools receiving grants between July 1 and December 31 of any reporting period, the current school year will be considered in the first year of implementation.” Therefore, schools awarded subgrants before Dec. 31, 2003, were designated as mature, because when data collection occurred in spring 2005, those schools were in at least their second year of implementation. All other RF schools were classified as newly funded.
13
20
To produce national estimates from the study sample, all analyses are weighted and computed using STATA, a statistical package that generates appropriate standard errors associated with each weighted estimate by taking account of the structure of the survey sampling design. Chapter 1: Introduction
Exhibit 1.1 Data Collection Methods, Samples, and Schedule Data Collection Method Principal and Teacher Mail Survey Newly funded Reading First schools
Number of Schools
Estimated Number of Respondents
550
2,200 teachers 550 principals up to 550 reading coaches 2,200 teachers 550 principals up to 550 reading coaches 2,200 teachers 550 principals up to 550 reading coaches 53 state coordinators
Mature Reading First schools
550
Non-RF Title I schools
550
Schedule 2004–05 2006–07
b
b
b b
b
RF State Coordinator Telephone b b Interview Exhibit reads: 550 newly funded RF schools were selected for inclusion in the study sample. The expected respondents include 2,200 teachers, 550 principals, and up to 550 reading coaches. There are two waves of data collection, one in spring 2005 and one in spring 2007. Note: Four teachers per school were sampled by randomly selecting one teacher from each of grades K–3. One principal and one reading coach (if applicable) per school were surveyed. RF state coordinator interviews were conducted with respondents in all 50 states, the District of Columbia, American Samoa, and schools run by the Bureau of Indian Affairs.
Surveys Measures The primary data collection instruments for the Reading First Implementation Evaluation were surveys designed for principals, teachers in grades K–3, and reading coaches. The Principal Survey asked for background information on teacher and student characteristics, resources and support for reading instruction, reading intervention services, professional development provided to teachers and administrators, and principals’ knowledge of research-based approaches to reading. The Reading Coach Survey was targeted to school-level individuals whose primary role is to assist classroom teachers in delivering effective reading instruction. This survey included items on the coaches’ background and experience, core and supplemental reading materials, professional development offered to K–3 teachers, specific coaching activities, characteristics of reading instruction in the school, changes that have taken place in reading instruction, and areas needing improvement. The Teacher Survey addressed teachers’ background and experience, student characteristics, reading instruction (e.g., materials, content, time allocation), use of assessment, interventions for struggling readers, participation in reading professional development, and collaboration and support from other teachers and staff. The surveys also included a subset of questions tailored to specific grade levels, the answers to which allowed us to describe grade-specific instructional emphases, reflecting RF’s research-based teaching of reading. Data Collection We recruited 1,649 study schools (1,098 Reading First schools and 551 non-RF Title I schools) in early 2005. Survey packets (including principal, teacher, and reading coach surveys) were mailed to each school. All but six RF schools and 10 Title I schools (1,092 and 541 schools) Chapter 1: Introduction
21
returned at least one survey.14 Most schools (88 percent) returned completed surveys for all selected respondents in their schools; another 8 percent of schools completed all but one of the surveys and only 17 schools, or 1 percent, returned none of the surveys. Response rates were slightly higher for Reading First schools compared with Title I schools; 96 percent of Reading First schools were either complete or missing only one survey, compared with 93 percent for Title I schools. Reading First schools are required, according to the conditions of their awards, to participate in a national evaluation, whereas no corresponding requirement exists for Title I schools. The response rate across all types of respondents and all schools was 96 percent. Of 9,460 potential respondents, 9,076 individuals returned completed surveys. For teachers in Reading First schools, response rates were approximately 96 percent across the four grade levels, compared with 94 percent in Title I schools. All response rates are presented in Appendix A, Exhibit A.4.15 Reading First State Coordinator Interviews To learn about state-level administration of Reading First, we conducted a semi-structured telephone interview protocol for RF state directors. The interview protocols were developed in collaboration with the U.S. Department of Education (ED) and were aligned with topics that informed states’ development of state Reading First plans, including state context for reading education, professional development, reading and assessment plans used state-wide and differences across districts, the state’s subgrant process, technical assistance, and state management and evaluation of the program. Interviews with state Reading First coordinators in all 50 states, as well as American Samoa, the schools of the Bureau of Indian Affairs, and the District of Columbia, were conducted in April and May of 2005. Limitations There are several limitations to the findings presented in this report. First, the data sources (primarily surveys) represent respondents’ self-reported subjective perceptions and judgments about the implementation of their reading programs. The second limitation is based on the Reading First legislation which requires states to provide professional development in scientifically based reading instruction to all K–3 teachers, not only the teachers in schools that receive RF funding; this may reduce the potential to find large differences between RF and nonRF Title I schools. Third, states often require RF schools to have a designated reading coach, whereas the reading coaches in Title I schools are often classroom teachers or reading specialists with additional responsibilities. We addressed this shortcoming by limiting the Title I group of reading coaches to those respondents who reported that they routinely engage in the activities used to define the 14
In addition to the 10 Title I schools that did not complete any surveys, 67 Title I schools refused to participate in the study.
15
To generate national estimates from the RF and Title I respondent samples, we constructed and applied sets of sampling weights at two levels, school and teacher. A discussion of the rationale and method used to construct the sampling weights is presented in Appendix A.
22
Chapter 1: Introduction
responsibilities of a reading coach. Nevertheless, any observed differences between RF and reading coaches in Title I schools should be interpreted with somewhat more caution than observed differences between other respondent categories. Fourth, this report presents findings on a large number of comparisons, and the study draws from a large sample; as a result, one could expect that there would then be many statistically significant comparisons. We note in the text and accompanying tables when specific comparisons are statistically significant, and we also note when these comparisons represent statistical differences that are modest, and may not substantively meaningful. Finally, this evaluation uses a quasi-experimental design, and as such, one cannot attribute observed differences to the Reading First program.
The Presentation of Findings The report is organized into eight chapters, reflecting not only the broad evaluation questions (Questions 1 and 2), but the sub-questions related to different facets of implementation of the Reading First program as well. Chapter 1 focuses on study design, sampling, and measures. The rest of the interim report is organized as follows: Chapter 2: Composition of the study sample; Chapter 3: Reading instruction; Chapter 4: Interventions for struggling readers; Chapter 5: Assessment; Chapter 6: Oversight and classroom support activities; Chapter 7: Professional development; Chapter 8: Conclusions. The report presents two kinds of findings: descriptions of RF program implementation, and comparisons of reading programs in both RF and non-RF Title I schools. The descriptive findings use information collected from respondents in the complete sample of RF schools, both newly funded and mature, to characterize the Reading First program (Question 1). The comparisons are based on the observed differences between the sample of mature RF schools and Title I schools (Question 2). To describe the implementation of reading programs in RF schools more broadly, we used survey data to generate descriptive statistics, such as means, proportions, and frequency distributions that are weighted to produce national, population-level estimates.16 Our study sample and design allows us to generate separate findings for each grade, however, when results do not vary across grades, we aggregate teacher-level findings across the four grades and, to simplify the presentation, we display the range of grade-level means. Specific grade-level estimates are, however, presented in Appendix C.
16
All weighted analyses are conducted using STATA, a statistical package that generates appropriate standard errors associated with each weighted estimate by taking account of the structure of the survey sampling design.
Chapter 1: Introduction
23
For the purpose of recruiting the two types of RF schools, schools were designated as new or mature based on the Reading First program guidelines to states for their annual performance reports.17
17
24
“…schools receiving grants between July 1 and December 31 of any reporting period, the current school year will be considered in the first year of implementation.” Therefore, schools awarded subgrants before Dec. 31, 2003, were designated as mature, because when data collection occurred in spring 2005, those schools were in at least their second year of implementation. All other RF schools were classified as newly funded. Chapter 1: Introduction
Chapter 2: Composition of the Study Sample This chapter examines the characteristics of the sampled schools, both those that have received RF funding and the non-RF Title I schools. In this section, we present background information on school enrollment, staffing, student populations and external resources targeted to reading schools’ reading programs.
Characteristics of Reading First and Title I Schools This section describes RF and Title I schools in terms of school characteristics (e.g., size, attendance and mobility rates), staff experience, students, resources targeted to reading programs, and accountability requirements of No Child Left Behind (NCLB). Sampling weights have been applied to the survey data to provide estimates that represent the populations of RF and Title I schools. School Characteristics Exhibit 2.1 presents the distribution of schools based on school size; the distributions are similar for the populations of RF and Title I schools. There is a significantly greater proportion of very large RF schools than Title I schools (17 percent vs. 11 percent). This difference is also reflected in the mean enrollment, which, on average, is significantly higher in RF schools. Exhibit 2.1 School Enrollment and Urbanicity in Reading First and Title I Schools, 2004–05 School Year Reading First Schools
Title I Schools
513* Percent 3% 11 40 29 17*
465 Percent 3% 14* 46* 26 11
School Size Mean enrollment Very small (1–99) Small (100–249) Medium (250–499) Large (500–749) Very large (750+)
Urbanicity Urban 46%* 39% Suburban 34 33 Rural 20 28* Source: Principal Survey, Question A3a. Weight: Principal. Weighted respondents: 3,878 RF principals, 14,625 Title I principals. Nonresponse rates across survey items: < 1 percent. Exhibit reads: About 3 percent of RF and non-RF Title I schools are very small, with enrollments of less than 100. Note: The stars (*) indicate that there is a statistically significant difference (i.e., p-value ≤ .05) between RF and Title I schools.
Chapter 2: Composition of the Study Sample
25
Enrollment stability is similar for RF and Title I schools, with approximately one-quarter of the schools in each group experiencing an increase in enrollment and another quarter of the schools experiencing a decrease in enrollment over the last five years (Exhibit 2.2). Reading First and Title I schools also have similar attendance and mobility rates. Average attendance across both types of schools is about 94 percent. Mobility rates average 18 percent for RF schools and 16 percent for Title I schools. This difference, while statistically significant, is not substantively large or meaningful. Exhibit 2.2 Mobility Rates, Attendance Rates and Changes in Enrollment in Reading First and Title I Schools, 2004–05 School Year Reading First Schools Percent
Title I Schools Percent
Decreased
47%
44%
Remained stable
25
27
Increased
27
28
2
1
Change in Enrollment in Last Five Years
School is new
Mobility Rate
18%*
16%
Attendance Rate
94
95
Source: Principal Survey, Questions A3c, A3d, and A5. Weight: Principal. Weighted respondents: Mobility and attendance rates—3,186 RF principals, 12,305 Title I principals; .change in enrollment: 3,790 RF principals, 14,032 Title I principals. Nonresponse rates across survey items: 4.2 to 9.5 percent. Exhibit reads: Attendance rates in both Reading First and Title I schools during the 2004–05 school year were, on average, 94 and 95 percent, respectively. This difference is not statistically significant. Note: The stars (*) indicate that there is a statistically significant difference (i.e., p-value ≤ .05) between RF and Title I schools.
School Staff Overall, staff reports of their years of experience are similar in RF and Title I schools. There are, however, some small differences. Principals in Title I schools have significantly more experience as principal than do their counterparts in RF schools (8.5 years vs. 7.7 years). Similarly, they have been in their current schools slightly longer than principals in RF schools (5.3 years vs. 4.8 years). While these differences in experience are statistically significant, they are not substantively large (Exhibit 2.3). Although, on average, the principals appear to be experienced, about half of the principals have been in their schools for three years or less (51 percent of the RF principals and 46 percent of the Title I principals). Further, 23 percent of RF principals and 18 percent of Title I principals reported that 2004–05 represented their first year in that school as principal (Exhibit 2.3). Frequent changes in key staff, such as the principal, may well have an effect on how well new programs function in the school.
26
Chapter 2: Composition of the Study Sample
Exhibit 2.3 Years of Experience for Staff in Reading First and Title I Schools, 2004–05 School Year Reading First Schools Mean
Title I Schools Mean
Years experience as principal
7.7
8.5*
Years in this school
4.8
5.3*
Principals
Teachers Years experience Years in this school
12.8
13.2
8.0
8.5
Percent
Percent
98%*
60%
Mean
Mean
18.0
18.5
1
Reading Coaches
Schools with Reading Coaches
Years experience Years in this school
7.5
9.0*
Years as reading coach in this school
1.8
3.3*
Source: Principal, and Teacher Surveys, Question A1; Reading Coach Survey, Question A3. Weight: Principal, Teacher, and Reading coach. Weighted respondents: 3,866 RF principals, 14,485 Title I principals; 64,545 RF teachers, 201,431 Title I teachers; 3,733 RF reading coaches, 7,613 reading coaches in Title I schools. Nonresponse rates across survey items and respondents: 0.3 to 5.2 percent. Exhibit reads: Principals in Reading First schools have, on average, 7.7 years experience in that position, compared with 8.5 years for principals in Title I schools. This difference is statistically significant (p = ≤ .05). Note: The stars (*) indicate that there is a statistically significant difference (i.e., p-value ≤ .05) between RF and Title I respondents. 1 34 reading coaches in Title I schools were excluded from this analysis because based on their survey responses, they do not appear to meet the definition of “reading coach” used in this evaluation.
Teachers in RF and Title I schools are equally experienced, with about 13 years of teaching experience, on average. About one-third of teachers reported that they are relatively new to the current schools—14 percent of teachers for one year or less; 18 to 20 percent of teachers have taught in this school for between one and three years (See Appendix C.2.a for details). Reading coaches in RF and Title I schools are even more experienced than teachers in these schools; on average, they have 18 years of combined teaching or coaching experience (Exhibit 2.3). Further, 75 percent of reading coaches, whether in Reading First or Title I schools, have ten or more years of experience. Reading coaches in Title I schools reported that they have been working in their current schools for more than three years; this compares with less than two years for RF coaches, reflecting a distinction between the RF and Title I schools. Most states require RF schools to employ reading coaches to support teachers’ reading Chapter 2: Composition of the Study Sample
27
instruction; this is not the case for non-RF Title I schools, which may or may not have reading coaches. Preservice Teacher Training in the Five Dimensions of Reading A cornerstone of the Reading First program is that teachers should be knowledgeable about and well prepared to teach the five essential components of reading instruction—phonemic awareness, decoding, vocabulary, comprehension, and reading fluency. Teachers were asked to rate the extent to which their preservice training prepared them to teach the five dimensions of reading using a scale of 1 (not at all prepared) to 5 (extremely well-prepared). Generally, across the five dimensions, RF teachers rated themselves in the middle of the range—suggesting that their preservice training left them somewhat prepared to teach these skills. On all dimensions, Title I teachers rated themselves significantly higher than did the RF teachers; these differences, while statistically significant, are substantively small. (Exhibit 2.4). Exhibit 2.4 Teachers’ Self-Ratings on Their Preservice Training to Teach Five Dimensions of Reading: Teachers in Reading First and Title I Schools, 2004–05 School Year
Dimension Phonemic awareness
RF Teachers
Title I Teachers
Mean Self-Rating 2.99
Mean Self-Rating 3.15*
Decoding 3.10 3.19* Vocabulary 3.25 3.45* Comprehension 3.33 3.47* Fluency 2.89 3.09* Source: Teacher Survey, Question A5. Weight: Teacher. Weighted respondents: 64,397 RF teachers, 201,292 Title I teachers. Nonresponse rate across survey items: < 1 percent. Exhibit reads: Title I teachers rated themselves as better prepared based on their preservice training to teach phonemic awareness than did RF teachers (3.15 vs. 2.99, p is ≤ .05). Notes: The stars (*) indicate that there is a statistically significant difference (i.e., p-value ≤ .05) between RF and Title I teachers. Ratings are on a scale of 1 to 5, where 1= not at all prepared and 5 = extremely well prepared.
Student Population Principals reported that special education services are provided to roughly the same proportion of students in RF and Title I schools. In both groups of schools, this proportion increases from about 5 percent in kindergarten to almost 10 percent for third grade students (Exhibit 2.5). Principals also reported that significantly more students in RF schools are also more likely to receive English as a Second Language (ESL) education services—about 20 percent of K–3 students, compared with about 10 percent for students in Title I schools.
28
Chapter 2: Composition of the Study Sample
Exhibit 2.5 Student Characteristics in Reading First and Title I Schools, 2004–05 School Year Reading First Schools Mean Percent
Title I Schools Mean Percent
Receive Special Education Services Kindergarten 6% 6% 1st grade 7 7 2nd grade 8 9 3rd grade 10 10 Receive ESL Instruction Kindergarten 22* 12 1st grade 21* 12 2nd grade 21* 11 3rd grade 20* 10 Instruction in language other than English Kindergarten 7* 6 1st grade 7* 5 2nd grade 6 5 3rd grade 5* 4 Source: Principal Survey, Question A6. Weight: Principal. Weighted Respondents: 3,551 RF principals, 13,499 Title I principals. Nonresponse rates across survey items and grades: 7.8 to 13.5 percent. Exhibit reads: In RF schools and Title I schools, 6 percent of kindergarten students receive special education services. Note: The stars (*) indicate that there is a statistically significant difference (i.e., p-value ≤ .05) between RF and Title I schools.
External Resources to Support Schools’ Reading Programs Reading First is the signature reading program of the No Child Left Behind (NCLB). As such, it represents a substantial investment in improving the reading achievement of the nation’s students. However, states, school districts, and schools receive support for their reading programs from other sources. Interviews with state Reading First coordinators, for example, found that 30 states had separate reading initiatives based on scientifically based reading research (SBRR), and 36 states had major statewide initiatives focused on professional development in reading instruction for teachers or reading specialists and administrators, among other initiatives.18 Below, we summarize survey results about the array of funding and external support for reading for Reading First schools. Size of Reading First Grant For the total population of Reading First schools, principals reported that the median annual RF award was $138,000 for school year 2004–05 (Exhibit 2.6). Typically, schools receive funds for three years or more. The funds ranged in size from a low of $2,000 to a 18
Other initiatives include revised reading or language arts standards and accountability or assessment initiatives focused on reading proficiency (29 states), early child education and school readiness initiatives (18 states), and family literacy programs such as Even Start.
Chapter 2: Composition of the Study Sample
29
high of $854,000. About 12 percent of the awards were less than $50,000; less than 1 percent were more than $500,000. The great majority of the RF awards to schools (81 percent) were between $50,000 and $299,999. We expected that larger schools, on average, would receive larger Reading First awards, and this trend seems to hold; however, some smaller schools received larger awards as well. Exhibit 2.6 Distribution of Reading First Funds to Schools by Average Enrollment, for Reading First Schools, 2004–05 School Year Reading First Schools $138,000
Median RF award to schools
Size of annual RF award …
$2,000––$99,999
Percent of Schools
Average School Enrollment
29%
470
…$100,000–$199,999
46
490
…$200,000–$299,999
18
511
…$300,000–$399,999
4
532
…$400,000–$499,999
2
715
…$500,000 and over
1
737
Source: Principal Survey, Question B6. Weight: Principal. Weighted respondents: 2,851 RF principals. Nonresponse rate: 27.1 percent. Exhibit reads: 29 percent of Reading First schools received funds of between $2,000 and $99,999. The average school enrollment for schools receiving between $2,000 and $99,999 in Reading First funds was 470 students.
Other Sources of Financial Assistance for K–3 Reading Programs Principals of the total population of Reading First schools reported that they received funding from an average of 5.1 sources, compared with 4.5 sources reported by principals of Title I schools (Appendix C, Exhibit 2.C.6). Significantly more Title I schools than Reading First schools reported receiving funding from Title I, district general funds, state textbook funds, professional development funds, and private grants. Nonfinancial Assistance with K–3 Reading Programs Beyond financial support, RF principals were significantly more likely to report receiving substantially more external, nonfinancial assistance than Title I principals, in a variety of areas including selecting instructional programs (76 percent vs. 56 percent), diagnosing needs of struggling readers (70 percent vs. 50 percent), conducting demonstration lessons (71 percent vs. 48 percent), and reviewing the effectiveness of reading programs (71 percent vs. 47 percent) (See Exhibit 2.7).
30
Chapter 2: Composition of the Study Sample
Exhibit 2.7 Nonfinancial External Assistance for K–3 Reading Program Activities in Reading First and Non-RF Title I Schools, 2004–05 School Year Reading First Schools
Title I Schools
Type of Assistance
Percent Percent Planning professional development 84%* 73% Interpreting assessment results 84* 70 Conducting classroom observation 80* 49 Providing technical assistance in implementing core reading programs 81* 50 Selecting professional development providers 77* 57 Selecting assessment instruments 76* 56 Selecting instructional programs/materials 76* 56 Reviewing reading program effectiveness 71* 47 Conducting demonstration lessons 71* 48 Diagnosing needs of struggling readers 70* 50 Setting up intervention programs for struggling readers 70* 51 Providing technical assistance for using supplementary reading materials 69* 48 Conducting needs assessment for professional development 57* 43 Leading teacher study groups 49* 33 Recruiting staff with reading expertise 40* 25 Source: Principal Survey, Question B7. Weight: Principal. Weighted respondents: 3,850 RF principals, 14,481 Title I principals. Nonresponse rates across survey items: 1.7 to 4.4 percent. Exhibit reads: 82 percent of principals in RF schools reported receiving external assistance in interpreting assessment results, compared to 70 percent of principals in Title I schools. This difference is statistically significant (p-value ≤ .05). Note: The stars (*) indicate that there is a statistically significant difference (i.e., p-value ≤ .05) between RF and Title I schools.
NCLB Accountability All schools, including Reading First schools, must also continue to meet the accountability requirements of the NCLB legislation. NCLB mandates that states develop and implement systems of accountability to ensure that districts and schools make adequate yearly progress as measured by the academic achievement of its students (Part A, Sec. 1111, (b), (2)). States develop their own definitions of Adequate Yearly Progress (AYP) for their districts and schools by specifying the minimum levels of improvement in student performance that must be attained. The legislation also includes sanctions for schools that do not make AYP. Schools that do not make AYP for two consecutive years are designated as schools in need of improvement and are required to develop a plan to remedy the situation; they are in year 1 of school improvement. If, at the end of year 1 a school fails to make AYP, the school district is required to provide technical assistance and supplemental educational services to the eligible students in those schools. Then, if those schools fail to make AYP at the end of year 2 of improvement, the district must implement a series of ‘corrective actions’ (e.g., replacing staff, implementing new
Chapter 2: Composition of the Study Sample
31
curricula, extending the school day, restructuring the organization of the school). If a school does not make AYP after five or more years, the school must implement a restructuring plan. Of the 4,764 schools identified as RF schools during the 2004–05 school year, currently about 1,096 (or 23 percent) have been designated as schools in need of improvement, exactly the schools RF is supposed to serve (Exhibit 2.8). About 70 percent of the RF schools in need of improvement are in their first or second year of school improvement; about 19 percent are schools in which districts are required to implement corrective action to improve the school. In about 11 percent of these schools, districts are required to restructure schools in which AYP has not been accomplished for five years. Exhibit 2.8 Status of Reading First Schools Designated as in Need of Improvement, 2004–05 School Year Number of Schools
Percent
School improvement—Year 1
418
41%
School improvement—Year 2
294
29
Corrective action
189
19
Restructuring and planning
113
11
1,014
100
Total
Source: Database provided by the U.S. Department of Education. Note: 82 RF schools included in the Schools in Need of Improvement database are missing a specific status classification.
Summary The demographic characteristics of Reading First and Title I schools are similar in several areas including attendance rates, mobility, and stability of enrollment. In general, the patterns of staff experience are similar for the two groups of schools. About half of the principals and one-third of the teachers have been in their current schools for three years or less. Reading First schools, however, on average have larger enrollments and are more likely to be located in urban areas with almost half of RF schools in such a locale, compared with 39 percent of Title I schools. The K–3 student populations of RF and Title I schools are similar in terms of the proportion of students receiving special education services and instruction in a language other than English. However, these schools differ in their proportions of students receiving ESL instruction; about one-fifth of K–3 students in RF schools receive such services, compared with about 10 percent in Title I schools. The median school in the total Reading First population received $138,000 in federal Reading First funds for school year 2004–05; about 80 percent of the awards were between $50,000 and $299,999 in size. In addition to these funds, most schools in the total population of Reading First schools received support for reading programs from Title I (91 percent) and from school district 32
Chapter 2: Composition of the Study Sample
general funds (79 percent). Reading First schools also received many different kinds of nonfinancial assistance for their K–3 reading programs in the form of assistance with planning professional development, interpreting assessment results, implementing the core reading program, and conducting classroom observations. Finally, across a variety of types of nonfinancial assistance, Reading First schools were much more likely to receive such assistance than were Title I schools.
Chapter 2: Composition of the Study Sample
33
34
Chapter 2: Composition of the Study Sample
Chapter 3: Reading Instruction The purpose of Reading First is to change how reading is taught in K–3 classrooms. These changes may include how much time is allocated to reading instruction, the types of materials used for reading instruction, the strategies used for helping teachers implement reading instruction, and the specific activities teachers use to teach reading. This chapter reports findings on the amount of time spent on reading instruction in Reading First and Title I schools, changes in materials and the types of materials used for reading instruction, and the types of strategies and activities used for reading instruction in Reading First and Title I classrooms.
Instructional Time Research has shown that the amount of time that schools spend on reading is a major determinant of reading achievement (National Research Council, 1998). The Reading First program guidance notes that schools “should also consider the allocation of time, including a protected, uninterrupted block of time for reading instruction of more than 90 minutes per day.”19 This section presents results on whether uninterrupted reading blocks are scheduled, the amount of time scheduled and actually spent on reading instruction, and changes in the amount of time spent on reading instruction compared to the previous school year, as reported by reading coaches and classroom teachers. Amount of Time Spent on Reading Instruction Reading coaches in RF and Title I schools agreed that there is sufficient time during the school day allotted for reading instruction.20 As shown in Exhibit 3.1, a great majority of reading coaches and principals (88–98 percent) reported that their schools had a scheduled reading block for grades 1–3. However, mature Reading First schools were significantly more likely than Title I schools to have a scheduled reading block (98 percent vs. 92 percent). At these three grade levels, Reading First schools, on average, reported having a 15-minute longer scheduled reading block than did Title I schools. Very few grade 1–3 classrooms in mature Reading First schools (3 percent) reported having a scheduled reading block less than 90 minutes long, compared with more than 20 percent of the grade 1–3 classrooms in Title I schools. These differences between mature Reading First and Title I schools were similar for kindergarten classrooms. Kindergartens in Reading First schools were also significantly more likely to have a 19
U.S. Department of Education, Office of Elementary and Secondary Education, “Guidance for the Reading First Program.” Washington, D.C., April 2002, page 6.
20
Reading coaches were asked to indicate on a scale of one to five how accurately the statement “Sufficient time during the school day is allotted for reading instruction (Question H1)” describes their school. The average response was 4.54 for RF schools and 4.46 for Title I schools. This difference is not statistically significant.
Chapter 3: Reading Instruction
35
scheduled reading block than Title I kindergartens (98 percent vs. 88 percent). Although nearly 12 percent of RF kindergartens had scheduled reading blocks less than 90 minutes long, nearly one-third of Title I kindergartens (33 percent) had reading blocks of less than 90 minutes. Teachers in Reading First schools, at all four grade levels, reported that they spent more time on reading than did teachers in Title I schools—a difference of about 19 minutes per day, or almost 100 minutes per week (99 minutes vs. 80 minutes per day). Exhibit 3.1 Percentage of Mature Reading First Schools and Title I Schools with a Daily Scheduled Reading Block, Length of the Reading Block, and Total Length of Reading Instruction, 2004–05 School Year Grade Level Kindergarten …Schools with reading block …Schools with a reading block