Natural Hazards and Earth System Sciences, 6, 145–153, 2006 SRef-ID: 1684-9981/nhess/2006-6-145 European Geosciences Union © 2006 Author(s). This work is licensed under a Creative Commons License.
Natural Hazards and Earth System Sciences
Real-size experiments and 3-D simulation of rockfall on forested and non-forested slopes L. K. A. Dorren1 , F. Berger1 , and U. S. Putters2 1 Cemagref 2 ecoRisQ,
Grenoble, St. Martin d’H`eres cedex, France St. Martin d’H`eres, France
Received: 16 September 2005 – Revised: 24 November 2005 – Accepted: 9 December 2005 – Published: 15 February 2006 Part of Special Issue “Spatial prediction modeling in natural hazards and risk”
Abstract. Only a few rockfall simulation models take into account the mitigating effect of existing forest cover. The objective of our study was to improve the generic rockfall simulation model RockyFor, which does take the effect of forest stands into account, thereby developing a clear method for quantifying and modelling slope surface characteristics based on quantitative field data. To obtain these data we carried out 218 real-size rockfall experiments on forested and non-forested sites on a mountain slope in the French Alps. On the basis of a polygon map representing different diameter classes of the material covering the slope, we determine the mean obstacle height (MOH) for each homogeneous unit at the experimental sites. We proposed an algorithm for calculating the tangential coefficient of restitution using the MOH. Comparing the simulated and observed data from the real-size rockfall experiments showed that the 3-D combined deterministic-probabilistic rockfall simulation model RockyFor accurately predicted rockfall events on a non-forested (Root Mean Square Error = 17%) and a forested site (Root Mean Square Error = 12%). We conclude that for further improvement of rockfall-forest simulation on different slope types more quantitative data is required on (1) the energy dissipative capacity of shrubs and bushes (e.g. in coppice stands), (2) the effect of the slope material, (3) the rock shape as well as the rock size, and (4) the tangential and normal coefficient of restitution. Based on the presented results we can state that the RockyFor model could contribute to better taking into account the mitigating effect of the existing forest cover when planning protective measures.
1 Introduction To sustain and protect livelihoods in the European Alps today, forests are indispensable. They cover the steep slopes of the main valleys and protect these developed and densely Correspondence to: L. K. A. Dorren (
[email protected])
populated areas against rapid mass movements that pose risks to infrastructure and inhabitants. Well-known examples are rockfall, defined in this paper as the fall of single rocks and stones with a volume smaller than 5 m3 (Jahn, 1988; Gsteiger, 1993; Erismann and Abele, 2001; Berger et al., 2002), and snow avalanches (Berger, 1996; Weir, 2002). Without these forests, the costs of building and maintaining technical protective constructions would be unaffordable. This is recalled in the first paragraph of the Mountain Forest Protocol of the Alpine Convention: “mountain forests provide the most effective, the least expensive and the most aesthetic protection against natural hazards.” In Austria and Switzerland alone, approximately 50 million Euros are spent yearly to maintain or improve the protection provided by mountain forests (European Observatory of Mountain Forests, 2000; Swiss Federal Statistical Office, 2002). Forests cannot always provide sufficient protection. In the case of rockfall this is because slopes are too steep or too short, or the forest is degraded and its structure is not dense enough to stop falling rocks. In those cases protection could be provided by technical measures such as rockfall dams, nets, etc. Throughout the European Alps, rockfall simulation models are used in so-called trajectory studies, to estimate the hazard posed by rockfall to residential areas (hazard zonation) and traffic routes and to design such technical protective measures. A wide range of models exists, varying from 2-D statistical models to 3-D deterministic models (Guzzetti et al., 2002; Dorren, 2003). With the increasing digital mapping and spatial modelling possibilities, there is a tendency towards 3-D combined deterministic – probabilistic rockfall simulation models, both at local and regional scale (e.g. Liniger, 2000; Guzzetti et al., 2002; Dorren and Seijmonsbergen, 2003; Dorren et al., 2004; Le Hir et al., 2004). The problematic part in rockfall models is the simulation of rebounds. The majority of these models calculate a rebound by means of energy loss coefficients, also called coefficients of restitution. The most widely used ones are the tangential (rt ) and the normal (rn ) coefficient of restitution (Pfeiffer
146
L. K. A. Dorren et al.: Rockfall-forest simulation
Figure captions
on rockfall hazards by using rockfall simulation models that simulate rockfall in 3-D and explicitly take the barrier effect of protection forests into account. The second step is developing a clear method for quantifying and modelling slope surface characteristics. The objective of our study was to improve the generic rockfall simulation model RockyFor developed by Dorren et al. (2004), thereby developing a clear method for quantifying and modelling slope surface characteristics based on quantitative field data. To obtain these data we carried out 218 real-size rockfall experiments on forested and non-forested sites on a mountain slope in the French Alps.
2 Figure 1. An orthophoto and a map showing the study area. The two round white dots indicate
Fig. 1.positions An orthophoto and showing thewhich study area.ofThe the start of the two sites. Sitea1 map is an avalanche track, is denuded trees,two Site round white indicate the start of thepositions two sites. Site 2 is forested. Thedots abundant white points at Sitepositions 2 are the mapped of all the trees1 ispresent an avalanche track, which is denuded of trees, Sitepositions 2 is forested. before the experiments. The white stars indicate the camera on both The abundant experimental sites. white points at Site 2 are the mapped positions of all the trees present before the experiments. The white stars indicate the camera positions on both experimental sites.
and Bowen, 1989; Budetta and Santo, 1994; Chau et al., 1998, 2002; Guzzetti et al., 2002; Agliardi and Crosta, 2003; Schweigl et al., 2003; Dorren et al., 2004). These coefficients are generally derived from literature data, whereas the difference between the characteristics of the material cover23 ing the slope surface and those of the falling rock itself are often neglected. To account for local variation, the coefficients of restitution are often randomly varied within a given distribution. For local studies, no standard methods exist for estimating the coefficients in the field. Another parameter that is often used in rockfall simulation models is the slope variation coefficient, to account for fine scale variations in the slope topography (Pfeiffer and Bowen, 1989; Spang and Krauter, 2001; Dorren et al., 2004). This coefficient is generally calculated on the basis of the rock radius and the size of the material covering the slope surface. Only a few rockfall simulation models take into account the mitigating effect of the existing forest cover (e.g. Zinggeler et al., 1990; Liniger, 2000, Dorren and Seijmonsbergen, 2003; Dorren et al., 2004; Le Hir et al., 2004), but generally this effect is neglected. As a result, the rockfall hazard under forested slopes is often overestimated and the protective measures that are taken are too expensive. In many cases, innovative forest management could be sufficient to reach an acceptable level of safety. In the remaining cases, where technical protective measures are needed, the existing forest cover often reduces the rockfall energies and rebound heights, which would mean that more modest protective constructions would suffice. Two steps are critical for improving the earlier mentioned rockfall hazard assessment studies in the European Alps. The first one is quantifying the effect of protection forests
2.1
Materials and methods Real-size rockfall experiments
Our study area is situated in the Forˆet Communale de Vaujany in France (lat 45◦ 120 , long 6◦ 30 ) and has an altitude ranging from 1200 m to 1400 m above sea level (Fig. 1). There we threw large, individual rocks (spherical shaped rocks with a mean diameter of 0.95 m) down the slope, which has a mean gradient of 38◦ . By using field measurements and video cameras we captured the velocity and the trajectory of the rock in 3-D. In addition we mapped and measured the size of all tree damages. We carried out these experiments on two sites, of which the central downslope axes were approximately 120 m apart from each other. Site 1 (approx. 1.1 ha) covers an avalanche track and is therefore denuded of trees (unstocked). Site 2 (approx. 0.9 ha) is covered by forest, except for the upper first 40 m, which is the distance necessary for a block of 1 m3 to reach its maximal speed (Gsteiger, 1993; Brauner et al., 2005). The site is representative for active rockfall slopes in the European Alps. The main tree species in the study area are Silver fir (Abies alba – 50%), Norway spruce (Picea abies (L.) Karst. – 25%), beech (Fagus sylvatica – 17%) and Sycamore (Acer pseudoplatanus L. – 4%). The mean stand density on Site 2 before the experiments was 290 trees per hectare and the mean stem diameter at breast height (DBH) was 31 cm (standard deviation 21 cm). During all the experiments the protocol was identical. Before each single rockfall experiment, we coloured the rock to be thrown with biodegradable paint, so it left traces after rebounding on the slope surface or impacting tree stems on Site 2. A caterpillar was used to throw the rocks down the slope. After each single rockfall experiment, we captured the trajectory of the rock with an Impulse LR 200 laser distance meter manufactured by Laser Technology, Inc. (Centennial, Colorado, USA) by measuring the distance and direction between each subsequent impact on the ground or against a tree. This was done to obtain information about the rockfall trajectories in 3-D, as the five digital high-speed cameras, which were installed along the experimental site, only provide a 2-D view. The cameras were fixed at a height of 10 m in trees that are situated 30 m away from the experimental
L. K. A. Dorren et al.: Rockfall-forest simulation rockfall paths of the two sites. In addition, we described and measured all the tree impacts and the resulting damages on trees. In total, we captured the trajectories of 100 rocks on Site 1 and 118 rocks on Site 2. On Site 2, only 102 rocks could be used for analysis. Three reasons for not using the remaining 16 rocks were: 1) they stopped within the first ten meters after sliding on the slope surface, 2) their rockfall path was too far away from the cameras due to lateral deviation of the falling rock, or 3) they broke into pieces during impacts on trees or on the slope surface. On average we managed to carry out eight rockfall experiments per day. Additional details of the experiments are described in Dorren et al. (2005). Before the experiments, we made a map that covered Site 2, which depicted the surface characteristics in 70 polygons with homogeneous terrain properties. The average size of these polygons was 103 m2 , the minimal size was 7 m2 . In each polygon (n=70) we measured the mean soil depth (material consisting of gravel size class and smaller), and we estimated the mean rock diameter of 70% of the rocks covering the slope surface in the polygon and the same for 20% and 10% of the surface cover. The redistribution into these three cover classes proved to work well after extensive testing in the terrain on different slope surfaces. In parallel, we analysed the surface roughness at the positions of rock impacts on the ground by measuring the maximal height variance of the material on the ground at the impact position, which was a clear impact crater in about 20% of all cases. The latter was done to investigate if there is a relationship between the size of the material on the slope surface, the radius of the falling rock and the energy loss during a rebound on the slope surface as described by Kirkby and Statham (1975). In addition to the surface cover map, we created a Digital Elevation Model (DEM) with a resolution of 2.5 m for the two sites. This has been done with the Inverse Distance Weighted interpolation method using on average 3 points per cell. The point data has been collected in the terrain with a detailed topographical survey using the laser distance meter and a compass. 2.2
Calculating the rockfall impact energy
We analysed the digital films of the rockfall trajectories using a free downloadable program called AviStep, which has been developed by M. Delabaere (Saint Denis de la R´eunion, France). This program allows extracting the position and the velocity of a moving particle for each individual image in a digital film. The principle is as follows. First, each film has to be referenced in x and y direction, which means that in the first image of each film, we defined the distance in meters between two known points in the terrain, which were also clearly recognisable on the first film image. Then, we analysed the trajectory of each falling rock in 2-D using a sequence of movie images. Since we used high-speed digital cameras we were able to register the velocities (both in x and y direction, as well as the resultant translational velocity) of each falling rock every 1/25th second. Therefore,
147 we could accurately determine the translational velocity of a falling rock before and after impacting a tree. Determining the angular velocity was more difficult, as we had to determine the number of sequential images for the rock to rotate once, which was not always easy to recognise. Before each rockfall experiment we measured the volume of the rock. All rocks had approximately the same shape (spherical), volume (average 0.49 m3 on both sites) and density (2800 kg m−3 ). With this information we could determine the mass of the rock and therefore the translational kinetic energy (Ek−trans ) as well as the rotational energy (Erot ) at any given point in its trajectory, given that the rock was clearly visible on the movie images. 2.3
Rockfall simulation model
Within this study we improved the rockfall model developed by Dorren et al. (2004). This model, called “RockyFor”, calculates 1) runout zones of rockfall events on both forested and non-forested slopes, 2) trajectories, velocities, and translational and rotational energies of falling rocks, and 3) impacts against tree stems, potential stem breakage and the resulting energy loss. RockyFor is a process-based model that simulates rockfall in 3-D. It uses raster maps as input that describe (1) the Digital Elevation Model (DEM), (2) the rockfall source cells, (3) the elasticity of the surface material per cell, (4) the roughness of the slope surface per cell (explanation of the elasticity and the surface roughness follows), (5) the number of trees per cell, (6) the diameters of the trees in each cell, and (7) the tree species per cell. RockyFor assumes that each rockfall source cell poses the same risk and simulates, one after another, the trajectories of a given number of rocks (10. . . 100 000) per rockfall source cell. The model accounts for flying, rolling and bouncing within a raster cell. Moreover, RockyFor can explicitly simulate rockfall impacts against individual trees, as investigated by Jahn (1988), Gsteiger (1993), Berger and Lievois (1999) and Dorren and Berger (2006). The main components of the model are (1) the calculation of the rockfall trajectory, (2) the calculation of energy loss due to impact against trees, and (3) the calculation of the velocity of the falling rock. The trajectory of the simulated falling rock is primarily determined by the topography and is calculated by a multiple fall direction method. At every step in the simulation, the fall direction of the rock can be towards one of the downslope cells from the cell where the rock is located during that simulation step. The exact procedure is described by Dorren et al. (2004). Thus, other than the widely used water flow direction calculation methods, the model is able to produce diverging rockfall trajectories instead of converging patterns. A restriction enforced by the model is that, after a rebound on the slope surface, the rock cannot deviate more than 45◦ laterally from its fall direction before the rebound. Changes in the fall direction due to rebounds on the slope surface change only between two raster cells, within the raster cell the fall direction does not change unless impacts against trees occur. Observations in the field showed
148
L. K. A. Dorren et al.: Rockfall-forest simulation
Table 1. Probabilities for deviation to the left or right from the impact direction after a tree impact (for the tree impact types frontal, lateral and scratch). Impact type
Frontal Lateral Scratch
The maximum amount that can be dissipated by a specific tree with a certain diameter is determined by the stem diameter and the tree species following: max E. diss. = F E ratio × 38.7 × DBH 2.31 ,
Probabilities 0–22.5◦ deviation
22.5◦ –67.5◦ deviation
67.5◦ –76◦ deviation
44 11 72
50 84 24
6 5 4
that extreme deviations of rocks from principal fall lines are mainly caused by tree impacts, distinct changes in topography, or the rock shape (disc shaped rocks or other shapes differing significantly from spheres). The first two are integrated in our model, the latter is not.
where, max E. diss. = maximum amount of kinetic energy that can be dissipated by a tree in kJ, FE ratio = the fracture energy ratio of a given tree species to Abies alba described by Dorren and Berger (2006) and DBH = stem diameter at breast height (cm). The algorithms presented above have been developed by Dorren and Berger (2006) and are based on data obtained with the real-size rockfall experiments. By using a FE ratio of 1, Eq. (2) represents the function of the maximum energy that can be dissipated by an Abies alba in relation to its diameter. With respect to rockfall, this tree can be considered to be representative for a tree with an average energy dissipative capacity. 2.5
2.4
(2)
Velocity of the falling rock
Energy loss due to impact against trees
As observed during the experiments, after a tree impact the trajectory of a rock can be deviated laterally up to 76◦ from its fall direction before the tree impact. This accounts for the incoming and outgoing direction in a circle with a radius of 5 m around the tree. Of course, locally, meaning around the tree stem, this deviation between the fall direction before and after the impact can be even 180◦ . The deviation of the rock depends on the position of the rock with respect to the tree stem at the time of impact. Three main impact types have been defined (see Dorren et al., 2005). Based on these three types, the probabilities in Table 1 in combination with a uniformly distributed randomiser are used to calculate the deviation. The impact position is also required for calculating the energy loss due to tree impacts. In addition, the diameter of the tree and the kinetic energy of the rock before the impact are needed. An input raster for the x-coordinate and one for the y-coordinate of the centre of the tree determine the tree positions. If the exact positions of the trees in the study area are not available, trees are randomly placed within each pixel, based on the number of trees assigned to each pixel (derived from the number of trees per hectare) and the diameter distribution. As the rock is modelled in 3-D, its position is known within each raster cell. If an impact takes place, the rock loses a fraction of its kinetic energy according to the following sigmoidal function:
The velocity of the falling rock during its flight through the air is calculated with standard algorithms for a uniform accelerated parabolic movement through the air. The velocity after a rebound or bounce on the slope surface is calculated with algorithms modified from Pfeiffer and Bowen (1989), as presented in Dorren et al. (2004). During each bounce the slope angle at the exact location of the bounce is uniform randomly decreased with an angle that varied between 0 and 4◦ . This procedure is similar to the varying impact angle based on the surface roughness as described by Jones et al. (2000). Energy loss is determined by the elasticity of the surface material, defined by the so-called normal coefficient of restitution (rn ) and by the roughness of the slope surface, defined by a tangential coefficient of restitution (rt ). Dorren et al. (2004) showed that the change of velocity after a rebound is mainly determined by the tangential coefficient of restitution and the slope angle at the rebound position. Both parameters are determined by the composition and size of the material covering the surface and the radius of the falling rock itself, since for larger rocks the effective surface roughness is lower than for smaller rocks, as shown by Kirkby and Statham (1975), and analogue to the principle of the slope variation coefficient used by, e.g. Pfeiffer and Bowen (1989), Spang and Krauter (2001) and Dorren et al. (2004). Therefore, we proposed the following algorithm to calculate the rt : rt =
1E = −0.046+
0.98 + 0.046 1 + 10(0.58−((P i−CT A)/0.5×DBH ))×(−8)
, (1)
where, 1E = Percentage of maximum amount of energy that can be dissipated by the tree (%), Pi-CTA = horizontal distance between the impact and vertical central tree axis (m) and DBH = stem diameter at breast height (m).
1 , 1 + (MOH /Rrock)
(3)
where, MOH is the maximum obstacle height at the slope surface (m) and Rrock is the radius of the falling rock (m). In the actual calculation of the velocity after a rebound, RockyFor randomly varies the value of the rt with 10% using a uniform distribution, to account for the local variation in the size of material covering active rockfall slopes.
L. K. A. Dorren et al.: Rockfall-forest simulation
149
The data obtained with the rockfall experiments provide the possibility to assess the validity of this algorithm. We analysed 22 rebounds on the slope surface by using the video images and calculated the tangential coefficient of restitution taking the ratio of the tangential velocity (parallel to the slope surface) of the rock before the impact and the tangential velocity after the impact. We related these data with the maximal height variance of the material on the ground at the rebound positions. To determine the strength of relationships we calculated the coefficient of determination (R 2 ) and its level of significance (P ). It is not possible to measure the MOH everywhere on an active rockfall slope. As it is feasible to make a polygon map with mean diameters of the material covering the surface classified in different diameter classes, it would be practical if the rt could be estimated on the basis of such a map. We chose to map three different diameter classes that are representative for 70%, 20%, and 10% of the average diameters of the material covering the surface in a mapped polygon. To test this method, we related the measured MOH values at the rebound positions to the mean diameters of the material covering the slope as derived from our polygon map. For that, we tested two different approaches. Firstly, we calculated the mean diameter in a polygon following, d = 0.7 × d70 + 0.2 × d20 + 0.1 × d10 ,
(4)
where d = mean diameter of the material covering the surface in a polygon, and dx = the mean material diameter of the 70%, 20%, or 10% class in the polygon. Subsequently, the simulated rock encountered an obstacle with a height equal to the mean diameter in the raster cell derived from the polygon map during the rebound calculations. Secondly, we made the simulation program randomly choose the MOH on the basis of the three cover classes in the polygon using a uniform distributed randomiser. Here, the probability that the simulated rock encountered an obstacle with a height equal to the mean diameter representative for the 70%, 20% and 10% cover class in the terrain was respectively 70%, 20%, and 10% during each rebound calculation. The latter method only has been applied at Site 2, because Site 1 is relatively uniform regarding the material size covering the slope surface. 2.6 Validating the model output The primary output generated by RockyFor consists of the velocity in each cell after a given number of simulations (m s−1 ), the kinetic energy in each cell (kJ), the number of times a simulated rock passed in each cell (−), the rebound heights of the rock in normal direction to the slope surface and in the vertical direction (m), the impact height on trees in each cell (m), the number of tree impacts in each cell (−) and the number of rocks that stopped in each cell (−). The model uses many probabilistic functions. Therefore, repeating the simulations at least a 1000 times, but preferably 10 000 times per start cell produces reliable results. To validate the output of 10 000 simulation runs on Site 1 and Site 2, we com-
pared them with the average maximum translation velocity of all the rocks (m s−1 ), the maximum translation velocity (m s−1 ), the percentage of rocks stopped after 223.5 m, the mean number of tree impacts per falling rock and the maximal vertical rebound height of rebound (m) observed at the slopes of Site 1 (non-forested) and Site 2 (forested). In addition, to evaluate the model performance at a more detailed scale than the slope as a whole, we compared the observed and simulated translation velocity (m s−1 ), the vertical rebound height (m) and the kinetic energy (kJ) at two “evaluation screens” at Site 1. Evaluation screen 1 is located after 185 m from the starting point at Site 1, measured over the slope and evaluation screen 2 is located after 235 m. On the basis of all the observed and simulated values we calculated Errors (E) and the Root Mean Square Errors (RMSE) following, E = (C − O) ∗ 100/O v u n u1 X RMSE = t (E2 ) , n i=1
(5) (6)
where n is the number of observations, C is the calculated value and O is the observed value. 3 3.1
Results Simulated and observed rockfall events
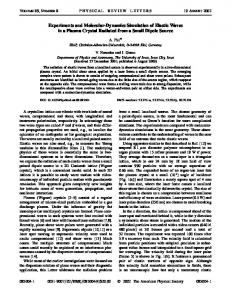
The most important results of this study are the comparison between simulated and experimentally obtained results on the non-forested and forested slope, as these indicate whether the model produces reliable results. Therefore, these results will be presented first. While presenting these results, data obtained from the real-size rockfall experiments will be presented as well. A more extensive presentation of the results of those experiments can be found in Dorren et al. (2005) and in Dorren and Berger (2006). The comparison of the simulated data and the data observed at the slopes of Site 1 (non-forested) and Site 2 (forested), which are summarised in Table 2, show that the RockyFor model produces accurate results at the slope level RMSE Site 1 = 17%, RMSE Site 2 = 13%). The largest error is produced at Site 1 by predicting the percentage of rocks surpassing the lower forest road. In reality, we observed that 74% surpassed this road, while the model predicted that 95% would surpass it, which results in an overestimation of 28.4%. Predicting the mean number of tree impacts that occur per falling rock resulted in the largest error at Site 2. In reality, 2.8 trees were on average impacted by each rock, while the model simulated on average 2.3 tree impacts per rock. This is an underestimation of 17.9%. Regarding the overall distribution of the number of tree impacts per rock as presented in Fig. 2, RockyFor reproduced the histogram quite well. The number of rocks that surpassed the lower forest road on Site 2 indicates the residual hazard of the forest including
150
L. K. A. Dorren et al.: Rockfall-forest simulation
Table 2. Summary of the observed and simulated characteristics of rockfall at Site 1 (non-forested) and Site 2 (forested).
Observed (n=100) Average maximum translation velocity of all the rocks (m s−1 ) Maximum translation velocity observed (m s−1 ) Percentage of rocks stopped within the first 223.5 m (%) Percentage of rocks surpassed the lower forest road (%) Mean number of tree impacts per falling rock Maximal height of rebound (m)
15.4 30.6 5 74 n.a. 8
Figure showing the number impacts against trees per rock as observed Fig. 2.2.Histogram Histogram showing theof number of impacts against treesduring per the real-size experiments (observed) and produced by RockyFor (simulated). rock as observed during the real-size experiments (observed)
and
produced by RockyFor (simulated).
the forest road. The model was capable to simulate this residual hazard with an error of 19%. We observed that 21% of the rocks surpassed the lower forest road at Site 2 and RockyFor predicted that 25% would surpass it. In addition, the model reproduced the spatial pattern of the observed rockfall trajectories, as presented in Fig. 3. Looking more in detail at the velocities, kinetic energies, and rebound heights that have been observed and simulated at the two evaluation screens at Site 1, it shows that RockyFor overestimates the mean velocity, and logically also the kinetic energies, and it underestimates the rebound heights (Table 3). The RMSE is 50% at evaluation screen 1, which is 185 m from the starting point measured over the slope. At screen 2, which is 235 m from the starting point mea24 sured over the slope, the RMSE is 44%. The maximum observed values, however, are well predicted at the two screens (RMSE of 12% at screen 1 and 8% at screen 2). 3.2
Simulated and observed rebounds on the slope surface
Our analyses showed that there is no relationship between the tangential (rt ) and the normal (rn ) coefficient of restitution on forested slopes (R 2 =0.06, P