lookup tables in the Soil Conservation Service (SCS) National Engineering Handbook, Section 4: .... Fulton, R.A., J.P. Breidenbach, D.J. Seo, and D.A. Miller.
CHAPTER 5
Real-Time Modeling of Natural Resources Using the Spatial Sciences Balaji Narasimhan, Pei-Yu Chen, Jennifer H. Jacobs, and Raghavan Srinivasan 1
CONTENTS Introduction Real-Time Wildfire Risk Assessment Keetch-Byram Drought Index Current Practice Real-Time Methodology Development of Real-Time System Summary Real-Time Crop Monitoring Crop Monitoring Study Results and Discussion Summary Real-Time Runoff Estimation Methodology Results and Discussion Real-Time Runoff Estimation Maps Summary Conclusions Acknowledgments References
_____________________________________________________________________________________________________________________ _____________________________________________________________
_____________________________________________________________________
___________________________________________________________________________________________________ __________________________________________________________________________________ __________________________________________________________
____________________________________________________________________________________________________________________ _________________________________________________________________________________
____________________________________________________________________________________
______________________________________________________________________________________
____________________________________________________________________________________________________________________ ______________________________________________________________________________
___________________________________________________________________________________________________________ ____________________________________________________________________________________ _____________________________________________________
__________________________________________________________________________________________________________________
______________________________________________________________________________________________________________________ ________________________________________________________________________________________________________
_________________________________________________________________________________________________________________________
51 53 53 54 54 56 56 59 59 60 63 63 63 66 66 66 67 67 67
INTRODUCTION The spatial sciences, including geographic information systems (GIS), remote sensing, and global positioning systems (GPS), have become an invaluable tool across all science and
______________ ISBN 0-00000-0000/00/ © 2005 by Texas A&M Press
52
MODELING AND REMOTE SENSING APPLIED TO AGRICULTURE (U.S. AND MEXICO)
engineering disciplines, especially in natural resource modeling. Furthermore, with the recent advancements in data collection and dissemination via the internet, there is an increasing opportunity to provide information on a real-time basis which would aid in the decision-making process for natural resource managers. Both raw and processed data can be provided to modelers for use in various applications. In natural resource modeling, elevation, soils, land use, and weather are considered to be the factors that define various processes and interactions. Of these, land use and weather are the most dynamic variables and are closely dependent on each other. Providing near real time access to dynamic resources such as vegetation and weather would greatly improve model results, and thereby management of natural resources. The Advanced Very High Resolution Radiometer (AVHRR) sensor aboard the National Oceanic and Atmospheric Administration (NOAA) series of polar-orbiting satellites, the Moderate Resolution Imaging Spectroradiometer (MODIS) instrument aboard the Terra and Aqua satellites, and the NEXt generation weather RADar (NEXRAD) of the National Weather Service (NWS) are three of the systems currently gathering near real time data. The NOAA series of Polar Orbiting Environmental Satellites (POES) have been in operation for more than three decades and are the primary source for monitoring weather across the globe. POES utilizes a near-circular, sun-synchronous orbit and views the entire surface of the Earth every one to two days. AVHRR is a broadband scanner aboard these satellites, sensing in the visible (Channel 1), near-infrared (Channel 2), and thermal infrared (Channel 3, Channel 4, and Channel 5) portions of the electromagnetic spectrum at a spatial resolution of 1000 m. Currently, NOAA satellites 14, 15, 16, and 17 are operational (NOAA, 2003). The MODIS instrument, aboard NASA’s Terra and Aqua spacecrafts (launched in December 1999 and May 2002, respectively) has a higher spectral and spatial resolution than the AVHRR sensor. MODIS acquires data in 36 spectral bands between visible and thermal infrared portions of the electromagnetic spectrum at three spatial resolutions - 250, 500, and 1000 m. In addition, the satellites are equipped with Direct Broadcast (DB) capability. In other words, data are not only stored for later downloads, but they can also be broadcast in real time to ground stations equipped to receive them (NASA, 2003). NEXRAD is a Doppler radar system, previously known as the Weather Surveillance Radar1988 Doppler (WSR-88D). NEXRAD provides precipitation data for larger areas with better spatial and temporal resolution than conventional raingauge networks. The raw data, or Stage I output, are available in 4 km x 4 km resolution grids, with cells identified by the Hydrologic Rainfall Analysis Project (HRAP) number. Stage I data are corrected using a bias adjustment factor based on available one-hour raingauge reports. The resulting correction is available as Stage II data. Finally, Stage II data for all radars are combined into one map with ground truth data from gauge stations, and overlapping areas are averaged together. The result is multi-sensor Stage III adjusted data. In this process, the combining and averaging of overlapping data, or mosaicking, helps to compensate for the overestimation or underestimation of individual radars (Jayakrishnan 2001). More detailed information about NEXRAD products and processing algorithms can be found in Crum and Alberty (1993), Klazura and Imy (1993), Smith et al. (1996), and Fulton et al. (1998). With these datasets, several real-time products have been developed, some of which are currently available via the internet at the Texas Weather Connection (TWC) Website (http://twc.tamu.edu). Among these products are a wildfire risk assessment index, a real-time crop monitoring system, and a runoff prediction map for the state of Texas.
REAL-TIME MODELING OF NATURAL RESOURCES USING THE SPATIAL SCIENCES
53
REAL-TIME WILDFIRE RISK ASSESSMENT Every year, thousands of hectares of grassland and forests are lost due to wildfires. According to the National Interagency Fire Center, about 4 million acres are scorched by wildfire every year (NIFC, 2003). These fires cost millions of dollars in economic loss and cause irreparable damage to the environment. Forest fire managers across the United States use fire potential or drought indices to assess wildfire risks and to alert local residents of potential fire threats. These indices are derived from weather data, such as temperature, rainfall, and vegetation condition, recorded by local weather stations. Weather data often come from sparsely located weather stations. The drought indices derived from these point source weather data are then manually interpolated across the entire state, based on expert judgment, at a coarse spatial resolution (county level). This procedure of calculating and interpolating drought indices across the entire state relies heavily on expert judgment and involves many uncertainties. Further, high spatial resolution data are often needed for effective wildfire risk assessment and control. During the past two decades, several advances have been made in remote sensing, GIS, and computational sciences. In addition, high spatial resolution data, such as temperature and rainfall, are readily available for use in conservation and management of natural resources, and provide the means to develop fire potential indices in real time. The objective of this research is to develop a near real time fire risk index using weather data obtained from satellites carrying the NOAAAVHRR sensor series and the NEXRAD weather radar for Texas.
Keetch-Byram Drought Index The Keetch-Byram Drought Index (KBDI) is widely used by fire managers to monitor moisture deficiency in the deep duff and upper layers of the soil profile. It is so widely used because of its simplicity and the fact that it is the only drought index that relates the effect of drought to potential fire activity. KBDI is based on a simple single- layer water balance model and indicates the amount of moisture depleted from the soil. The theory and framework of KBDI are based on the following assumptions (Keetch and Byram, 1968): 1. The rate of soil moisture loss depends on density of the vegetation cover, antecedent moisture conditions, annual rainfall, and evapotranspiration. 2. The field capacity of soil is 8 in of available water. (Eight inches of water is chosen because in many areas of the country, it takes all summer for the vegetation cover to transpire that much water. This number is reasonably well suited for use in forest fire control.) The four climatological parameters used to calculate KBDI include daily maximum temperature, daily rainfall, cumulative antecedent moisture deficiency, and annual average precipitation. Keetch and Byram (1968) explain in detail the mathematical formulations involved for computing KBDI. The result of this system is a number that represents the moisture deficiency
MODELING AND REMOTE SENSING APPLIED TO AGRICULTURE (U.S. AND MEXICO)
54
in the upper soil layer in hundredths of an inch. A scale of 0 to 800 is used to represent the moisture deficiency, with 0 being no moisture deficiency and 800 being the maximum possible moisture deficiency. These numbers are correlated with the fire potential as shown in Table 5-1.
Table 5-1. Keetch-Byram Drought Index (KBDI) and fire potential. KBDI 0 – 200
Fire potential Low
200 – 400
Moderate
400 – 600
High
600 – 800
Very high
In Texas, if the KBDI for a county is more than 500, countywide outdoor burn bans are imposed by the Texas Forest Service (TFS) to prevent wildfires in that county.
Current Practice Presently, all the climatological data needed to compute KBDI are obtained from 60 groundbased weather stations across Texas. Daily weather data for these stations are collected by the National Weather Service (NWS) and are available for download via the internet (http://iwin.nws.noaa.gov/iwin/tx/climate.html). These daily weather data are downloaded manually from the NWS and imported into a spreadsheet to calculate daily KBDI. The KBDI derived from these point data sources are then interpolated at a county scale across the entire state based on expert judgment. Some of the uncertainties involved with this procedure are the following: • Localized precipitation events are common in arid climatic zones. These precipitation events may not be captured by the sparsely located rain gauge stations. • Interpolation of KBDI from weather station data across large regions could introduce errors. • The interpolation method in use is based on human judgment. This might introduce further bias when interpolating KBDI across large areas. With advances in spatial and computational sciences, the procedure for computing KBDI can be automated, and spatial accuracy can be considerably improved (county scale to 4km × 4km) by using GIS and remote sensing technologies.
Real-Time Methodology The proposed methodology involves the use of remotely sensed data from AVHRR and NEXRAD for deriving weather parameters such as maximum air temperature and daily rainfall.
REAL-TIME MODELING OF NATURAL RESOURCES USING THE SPATIAL SCIENCES
55
Maximum air temperature (Ta), needed for calculating KBDI, is derived from land surface temperature (Ts) obtained from the thermal channels of AVHRR. Land Surface Temperature (LST) is the temperature measured just a few inches above the surface of the land or vegetation. The LST can be derived using a split window algorithm from the brightness temperatures of channels 4 and 5 of AVHRR. Several split window algorithms have been developed and used to derive LST from these channels to account for the effects of atmospheric disturbances on the satellite measurements. The split window algorithm developed by Ulivieri et al. (1994) has been used in this study to derive LST from the thermal channels. As previously mentioned, LST is different from the air temperature that is measured at a standard height of 2 m. Maximum air temperature (Ta) can be obtained from the surface temperature (Ts) using an energy balance approach. But such an approach involves many variables that cannot be readily derived from satellite measurements. According to Narasimhan et al. (2003), there is a strong linear relationship between surface temperature obtained from the satellite and the maximum air temperature measured at weather stations across the state. Hence, a simple regression approach was developed in order to derive (Ta) from (Ts). This regression model is of the form:
Ta (i ) = m(i ) Ts × Tlm + C (i )
[1]
where Ta (i) is the estimated daily maximum air temperature for climatic zone i, Ts is the land surface temperature (°C), Tlm is the long-term monthly maximum air temperature (°C), and m(i) and C(i) are regression constants for climatic zone i (where i = 1,…..10) (Table 5-2).
Table 5-2. Regression coefficients used for deriving maximum air temperature (Ta) from surface temperature (Ts). Climatic division
m(i)
C(i)
R2
1 2 3 4 5 6 7 8 9 10
0.78 0.88 0.86 0.9 0.82 0.86 0.75 0.86 0.81 0.81
5.04 3.46 4.73 4.82 2.72 4.12 7.47 5.31 5.99 6.55
0.74 0.80 0.81 0.83 0.75 0.78 0.72 0.78 0.71 0.75
Daily precipitation, again needed for calculating KBDI, was obtained from Stage III NEXRAD weather radar. Precipitation is the most sensitive parameter in the estimation of KBDI. As previously mentioned, localized precipitation events are very common in arid climatic zones. These precipitation events may not be captured by the sparsely located raingauge stations.
56
MODELING AND REMOTE SENSING APPLIED TO AGRICULTURE (U.S. AND MEXICO)
Currently, NEXRAD provides the best estimates of precipitation over large areas with high spatial resolution (4km × 4km). Since outdoor burn bans and distribution of fire personnel and resources across the state depend on KBDI estimates, accurate estimation of KBDI is essential. Hence, by using remotely sensed temperature and precipitation estimates obtained from AVHRR and NEXRAD, respectively, accurate estimation of KBDI is possible at a high spatial resolution.
Development of Real-Time System A real-time system (Fig. 5-1) has been developed for estimation of daily KBDI from remotely sensed data using Arc Macro Language (AML) scripts in ESRI’s ArcInfo software. The satellite receiving system located at the Blackland Research Center (BRC), in Temple, TX, acquires daily raw AVHRR data from NOAA-14 and NOAA-15 satellites. An automatic data processing system has been developed using PCI Geomatics’ remote sensing software for radiometric, geometric, and atmospheric corrections and computing NDVI and LST. In addition, algorithms developed by various researchers have been refined and are used for cloud detection (Chen et al., 2002). During cloudy days (cloud cover > 30%), it may not be possible to get maximum air temperature estimates from the AVHRR satellites. On these days, maximum air temperature measured at 60 NWS weather stations across Texas is interpolated using a “Regular Spline” method, available in the ArcInfo system. The resulting maximum air temperature is used as a replacement for the satellite data during cloudy days. An automatic data-capturing algorithm is used to obtain the daily maximum air temperature from the 60 NWS stations. Stage III NEXRAD data are collected and archived by the NWS. The Stage III data, obtained from the NWS River Forecasting Center (RFC) in Fort Worth, TX, through a cooperative arrangement, is in a Hydrologic Rainfall Analysis Project (HRAP) grid system, whereas the rest of the data are in a regular grid system. Hence, the precipitation data are remapped to the regular grid system using the ArcInfo. Once all of the input data are prepared, KBDI is computed using AML scripts, again, in ArcInfo. This entire system is completely automated and no longer requires manual data processing. Once the KBDI information is processed, it is distributed to forest fire managers across Texas through the World Wide Web (WWW) at http://twc.tamu.edu.
Summary A real-time system has been developed for estimation of a fire potential index (KBDI). The use of GIS and remote sensing technologies overcomes the uncertainties involved in the computation of the KBDI index. The spatial accuracy of KBDI estimates has also been improved (county scale to 4km × 4km) due to the use of real-time, and readily available, remotely sensed data and GIS (Fig. 5-2 and Fig. 5-3). Efforts are also underway for the development of a new fire potential index by incorporating NDVI estimates with that of soil moisture deficit. NDVI gives a measure of greenness/dryness of vegetation. Because this plays an important role in the ignition or spread of wildfire, it can give a better estimate of fire potential at any given place.
REAL-TIME MODELING OF NATURAL RESOURCES USING THE SPATIAL SCIENCES
57
NWS AVHRR
Data acquisition system at Blackland Research Center, Temple, TX.
Radiometric, geometric, and atmospheric correction of AVHRR. Computing LST
Daily LST from AVHRR, Ts
Climatic Division specific regression model for deriving maximum air temperature from Ts and Tlm
Extracting daily maximum air temperature for 60 NWS weather stations
Annual precipitation of Texas (PRISM)
Daily maximum air temperature, Ta without clouds
Daily maximum air temperature with clouds, Ta
Long -term monthly maximum air temperature (Tlm) for Texas from January to December
Daily precipitation from NEXRAD
Daily maximum air temperature, Ta from NWS
Interpolate temperature from 60 weather stations using "Regular Spline" method
Cumulating hourly radar rainfall estimates to 24 hr rainfall
Run the cloud smoothing algorithm to remove small clouds
Previous days KBDI
KBDI map of Texas WWW
NWS - National Weather Service, NEXRAD - Next Generation Weather Radar, LST - Land Surface Temperature
Fig. 5-1. A real-time system for computing the Keetch-Bryam Drought Index (KBDI) using remotely sensed data and geographic information systems (GIS).
58
MODELING AND REMOTE SENSING APPLIED TO AGRICULTURE (U.S. AND MEXICO)
Fig. 5-2. Keetch-Byram Drought Index (KBDI) for 30 Sept. 1999 computed by conventional methods (Courtesy of TFS).
Fig. 5-3. Keetch-Byram Drought Index (KBDI) at a resolution of 4km × 4km computed using remotely sensed data.
REAL-TIME MODELING OF NATURAL RESOURCES USING THE SPATIAL SCIENCES
59
REAL-TIME CROP MONITORING Vegetation indices (VIs) based on visible and near-infrared reflectance values are primarily acquired for vegetation studies. The Normalized Difference Vegetation Index (NDVI) is the most widely used VI for vegetation research and can be used to detect change, estimate biomass, and map land cover (Jakubauskas et al., 2002; Maselli et al., 2000; Chen et al., 1999). Most crop growth studies involve the utilization of a temporal series of NDVI values derived from the NOAA-AVHRR sensor series (Dabrowska-Zielinska et al., 2002; Rasmussen, 1998). The multitude of spectral bands in the MODIS instrument provides another data resource for near real time agricultural studies. Besides NDVI, the MODIS instrument provides the Enhanced Vegetation Index (EVI), with improved sensitivity in high biomass regions and improved vegetation monitoring through a de-coupling of the canopy background signal and a reduction in atmospheric influence (Terrestrial Biophysics & Remote Sensing Lab, 2003). The EVI contains self-correcting atmospheric and soil calibration factors and quality control diagnostics, and is derived from the visible (0.62-0.67 µm), near-infrared (0.841-0.876 µm), and blue (0.459-0.479 µm) reflectance data suggested by Huete et al. (1994). It is defined by the following equation: [2] where is the atmospherically corrected (for Rayleigh and ozone absorption) surface reflectance data, L is the canopy background adjustment, and C1 and C2 are the aerosol resistance coefficients. The blue band is used to correct for aerosol influences in the red band. The EVI values vary between -1.0 and +1.0. Negative EVI values indicate the presence of clouds, snow, or water, and positive EVI values are positively correlated to the abundance of green vegetation. Daily coverage of the earth surface is a strong advantage of MODIS data, but cloud contamination limits the data usage for environmental monitoring (Ohring and Clapp, 1980). Cloud detection is strongly recommended for real-time data such as those from AVHRR and MODIS (Gutman et al., 1994; Cihlar, 1996; Chen et al., 2002). The maximum value compositing (MVC) method is widely used to minimize the effects of cloud contamination on MODIS data (Holben, 1986). The MVC method retains the highest VI value for a given pixel over a pre-defined compositing period since the presence of clouds, smoke, haze, snow, and ice in a pixel reduces VI values. The 36-channel high spectral resolution MODIS data are used to produce the 16-d EVI and NDVI composite products at spatial resolutions of 250, 500, and 1000 m.
Crop Monitoring Study Several vegetation monitoring studies have been conducted using NDVI, based on the assumption that NDVI and leaf area index (LAI) are closely correlated to the fraction of photosynthetic active radiation (PAR) intercepted by canopies (Hatfield et al., 1984; Shanahan et al., 2001). Sorghum (Sorghum bicolor) and corn (Zea mays), two of the major crops in Mexico, are planted along the east and west coasts of Mexico, respectively. Sorghum is primarily planted between January and February and is harvested in June. Corn is planted in November and harvested in May of the next year. The NDVI composite data from AVHRR images have been used to monitor corn growth stage and to estimate corn yield in Mexico starting in 1999 (BaezGonzalez et al., 2002) to ensure food security. Since the MODIS instrument provides real-time
60
MODELING AND REMOTE SENSING APPLIED TO AGRICULTURE (U.S. AND MEXICO)
vegetation information at finer resolutions (250 and 500 m) than AVHRR, the objective of this study was to assess the suitability of the EVI temporal profiles at different resolutions for sorghum and corn monitoring in Mexico. All remote sensing procedures were done in PCI Geomatics and ERDAS systems. For this research, 16 sorghum and 16 corn locations were randomly selected from a series of field samples for 2002 provided by scientists of the National Research Institute of Forestry, Agriculture, and Livestock Production (INIFAP). Moreover, each studied location was verified using LANDSAT-7 Enhanced Thematic Mapper (ETM+) images acquired in February and May 2002 for sorghum and maize, respectively. The sorghum fields had maximum LAI values at the end of April and beginning of May, and the corn fields reached maximum LAI values between February and March. The longitude and latitude of each location were used to extract EVI values from the MODIS data. A series of 16-d EVI composite data at different resolutions were downloaded from NASA GSFC DAAC (http://modis.gsfc.nasa.gov/data/dataproducts.html) for the period from the end of 2001 to the middle of 2002 for the crop monitoring study.
Results and Discussion All 16 sampled sorghum locations had maximum EVI values occurring between the middle of April and the beginning of May, coincident with the time of maximum leaf area index (LAI) for the sorghum fields (Alma Baez-Gonzalez, personal communication; March 2003). The EVI temporal profiles for 500m MODIS pixels (EVI_500m) were similar to EVI profiles for 1000-m MODIS pixels (EVI_1000m) for sorghum growth, with maximum EVI values occurring at the same time (Fig. 5-4). Most EVI temporal profiles for 250-m MODIS pixels (EVI_250m) had maximum values that were either 16 d earlier or later than the EVI_500m and EVI_1000m data. Only three out of 16 locations had maximum EVI values occurring at the same time period for all three pixel resolutions. The EVI difference between the EVI_1000m and EVI_500m data was less than that between the EVI_500m and EVI_250m data. The EVI_500m data usually had maximum values that were similar to or greater than those of the EVI_1000m data. Maximum values of the EVI_250m data were more variable. Six EVI_250m data out of 16 had lower maximum values compared to the EVI_500m data. Eastern Mexico has several large areas of sorghum fields. Each area is divided into many small parcels of agricultural land that are rectangular in shape. Although all of the parcels were planted with sorghum, planting time and farming practice differed between parcels. In addition, a couple of urban areas were adjacent to or within agricultural areas. The TM images revealed different spectral responses for agricultural parcels of land next to each other. The EVI_1000m data were most likely to cover more than one parcel, while the EVI_250m data were almost certainly composed of a single parcel or homogeneous land-cover type. The EVI_500m may cover one or more parcels of land, depending on the parcel sizes. Five out of the 16 samples had parcel sizes less than 250m × 250m, and four out of the 11 remaining samples had parcel sizes less than 500 m × 500 m. The remaining seven samples had parcel sizes less than 1000m × 1000m. The EVI_250m data represented real-time information well, similar to field conditions of sorghum growth for every monitoring site in Eastern Mexico. The EVI_1000m data probably presented combined field situations for the monitoring spot and its neighbor parcels. The quality of EVI_500m data was between that of EVI_250m and EVI_1000m data.
REAL-TIME MODELING OF NATURAL RESOURCES USING THE SPATIAL SCIENCES
61
a
b
c
Fig. 5-4. EVI temporal profiles for sorghum fields from MODIS data at three spatial resolutions at different locations (a, b, c) in Tamaulipas in Eastern Mexico in 2002.
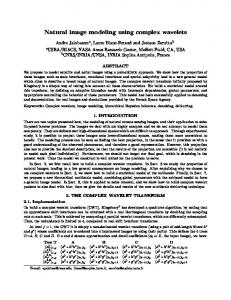
The EVI temporal profiles for sorghum (Fig. 5-4) and corn fields (Fig. 5-5) had different patterns. The EVI values for corn fields reached a plateau between 75 and 110 d after planting and declined when the corn started to mature. The period of 75 to 110 d after planting included the growing stages of silking, doughing, and denting. The EVI profiles for sorghum fields reached a peak when the sorghum started heading, around 85 d after planting, and declined immediately when sorghum started changing colors (senescing). The EVI profile for corn included a plateau because corn experiences a slower reduction in LAI and radiation use efficiency than sorghum as part of senescence after reaching maximum EVI (Kiniry et al., 1992).
MODELING AND REMOTE SENSING APPLIED TO AGRICULTURE (U.S. AND MEXICO)
62
a
b
c
Fig. 5-5. EVI temporal profiles for corn fields from MODIS data at three spatial resolutions at different locations (a, b, c) in Sonora in Western Mexico from 2001 to 2002.
The EVI_1000m data for corn had very similar behaviors for each sampled location, reaching the maximum plateau from the end of January to the end of February, when the leaf area index reached maximum values as well. Irregular up-and-down behaviors occurred frequently in the EVI_250m data for corn. These data usually had the largest EVI values before reaching the silking stage. The EVI_500m data for corn always had greater EVI values than the EVI_1000m data before silking, but both EVI values were very similar when the corn reached maturity. The EVI profiles for sorghum demonstrated the opposite behavior. At all three resolutions, these data had very similar values before reaching the maximum level, and then the EVI values diverged when the data declined.
REAL-TIME MODELING OF NATURAL RESOURCES USING THE SPATIAL SCIENCES
63
Clouds were visible in the 16-d EVI composites acquired between November and March. Moreover, visible cloud shadows frequently appeared in the EVI composites, although the cloud contamination had been effectively removed by maximum value compositing (MVC). It was apparent that the 16-d composite period may not be long enough for obtaining cloud-free information. Chen et al. (2003) recommended that cloud detection be applied to the individual scene before producing composite data. Overall, the EVI_250m data for sorghum behaved more closely to crop conditions as known to exist in the fields than the EVI_250m data for corn. The main reason was that the EVI composite data were less cloud-contaminated in the sorghum season, from February to June. Cloud and cloud shadow effects were more significant for the EVI_250m data than EVI_1000m data if the clouds and cloud shadows did not contaminate the entire pixel of 1000 m × 1000 m.
Summary Although the Normalized Difference Vegetation Index (NDVI) has been successfully applied to several agricultural studies, published research studies have concluded that NDVI values were responding to the vegetation canopy background. The Enhanced Vegetation Index (EVI) derived from the Moderate Resolution Imaging Spectroradiometer (MODIS) was improved, with increased sensitivity for biomass estimation in dense vegetation canopies, through a de-coupling of the canopy background signal and a reduction in atmospheric and soil reflectance influence. In this study, the MODIS EVI data at all three spatial resolutions provided information on sorghum growth stage consistent with actual crop conditions as reported in the fields. Our results showed that the MODIS EVI 250m composite data were not as reliable as the 500m and 1000m data for corn monitoring because of frequent cloud contamination occurring during the first three months of the growing season. Moreover, the MODIS EVI value difference among the three resolutions was attributable to the proportion of crop fields within the pixel. Overall, this study exhibited that MODIS EVI composites can be used to support real-time crop monitoring in Mexico.
REAL-TIME RUNOFF ESTIMATION The purpose of this third study was to evaluate variations of the Natural Resources Conservation Service (NRCS) curve number (CN) method for estimating near real-time runoff for naturalized flow, using high-resolution radar rainfall data in Texas. The CN method is an empirical method for calculating surface runoff, which has been tested on various systems over a period of many years. Many of the findings of previous studies indicate the need to develop variations of this method to account for regional and seasonal changes in weather patterns and land cover that might affect runoff. This study seeks to address these issues, as well as the inherent spatial variability of rainfall, in order to develop a means of predicting runoff in near real time for water resource management. In the past, raingauge networks provided data for hydrologic models. However, these networks were generally unable to provide data in real time or capture the spatial variability associated with rainfall. Radar networks, like NEXRAD, which are widely available and continue to improve in quality and resolution, can accomplish these tasks.
Methodology Ten watersheds of varying size in four river basins throughout different agro-climatic regions of Texas were used in this study in order to account for the wide variety of hydrologic conditions throughout the state (Table 5-3). These areas were chosen based on the dominant land use, soil hydrologic group, and streamgauge location for validation and calibration of model results.
MODELING AND REMOTE SENSING APPLIED TO AGRICULTURE (U.S. AND MEXICO)
64
Table 5-3. Description of watershed study areas chosen for analysis. Stream Name
Major Land Resource Area
Drainage Area (km2)
Rainfall Range (mm)
Major Land Cover Characteristics
Watershed
USGS Streamgauge
Trinity-1
8042800
West Fork Trinity River
Texas North Central Prairies
1769
550 - 750
56% herbaceous rangeland; 17% shrubland; 13% deciduous forest
Trinity-2
8065800
Bedias Creek
Texas Claypan
831
750 - 1075
76% improved pasture and hay
Trinity-3
8066200
Long King Creek
Western Coastal Plains
365
1025 - 1350
80% forested; 15% improved pasture and hay
Red-1
7311600
North Wichita River
Rolling Red Plains
1399
500 - 750
33% herbaceous rangeland; 40% row crops; 18% shrubland
Red-2
7311783
South Wichita River
Rolling Red Plains
578
500 - 750
60% herbaceous rangeland; 28% shrubland
LCR-1
8144500
San Saba River
Edwards Plateau
2940
375 - 750
71% shrubland; 21% herbaceous rangeland
LCR-2
8150800
Beaver Creek
Edwards Plateau
557
375 - 750
40% shrubland; 40% evergreen forest
LCR-3
8152000
Sandy Creek
Texas Central Basin
896
625 - 750
41% evergreen forest; 33% shrubland; 16% herbaceous rangeland
SA-1
8178880
Medina River
Edwards Plateau
850
375 - 750
60% forest; 20% shrubland; 14% herbaceous rangeland
SA-2
8178700
Salado Creek
Edwards Plateau / Texas Blackland Prairie
355
375 – 1150
50% forest; 32% urban; 10% shrub and herbaceous rangeland
Daily runoff calculations for the study sites were made using the NRCS CN method, which provided a means of estimating runoff based on land use, soil type, and precipitation. This calculation is based on the retention parameter, S, initial abstractions Ia (surface storage, interception, and infiltration prior to runoff), and the rainfall depth for the day, Rday, (all in mm
REAL-TIME MODELING OF NATURAL RESOURCES USING THE SPATIAL SCIENCES
65
H20). The retention parameter is variable due to changes in soil type, land use, and soil moisture, and is defined as Eq. [3]: [3] Average CN values (CNII) are assigned based on the land use and soil hydrologic group from lookup tables in the Soil Conservation Service (SCS) National Engineering Handbook, Section 4: Hydrology (NEH-4). CN values for wet (CNIII) and dry (CNI) antecedent moisture conditions are calculated from this average value. A more detailed description of these calculations can be found in Neitsch et al. (2001). For the actual runoff calculation, initial abstractions (Ia) are generally approximated as 0.2 S, and the basic equation becomes Eq. [4]:
[4]
where Qsurf is surface runoff in mm, and Rday is rainfall depth for the day, also in mm. Runoff will occur only when Rday > Ia (Neitsch et al., 2001). However, Ponce and Hawkins (1996) suggest that 0.2 S may not be the most appropriate number for Ia, and that it should be interpreted as a regional parameter. To test this, 0.2 S, 0.1 S, and 0.05 S were used in the runoff equation to determine the most appropriate constant for Ia in various agro-climatic regions of Texas. Stage III NEXRAD precipitation data were used as the rainfall input for the equation in order to produce runoff estimates in real time. In addition, NEXRAD is able to capture the spatial and temporal variability of rainfall more effectively than traditional raingauge networks over large areas. In such areas, rainfall contributions from heavy, localized storms can go unaccounted for based on traditional raingauge information. Runoff estimates generated by the CN method equation were compared with U.S. Geological Survey (USGS) streamflow estimates at the watershed outlets. Because streamflow is composed of baseflow and runoff portions of flow, it was necessary to process this data through a baseflow separation filter program, such as the one outlined in Arnold et al. (1995). This process allowed for direct comparison of runoff estimates to USGS data. Statistical analysis for this study consisted of basic regression analysis and estimation efficiency (Nash and Sutcliffe, 1970), which are commonly used in hydrologic model evaluation. The equation is calculated as: ⎛ n 2 ⎞ ⎜ ∑ (Oi − Ri ) ⎟ ⎟ COE = 1.0 − ⎜ in−1 ⎜ 2 ⎟ ⎜ ∑ (Oi − Om ) ⎟ ⎝ i −1 ⎠
[5]
where COE is the coefficient of efficiency, or runoff estimation efficiency, n is the number of days of comparison, Oi is the observed streamgauge runoff for a watershed for day i, Om is the mean observed streamgauge runoff for a watershed over all days, and Ri is the estimated runoff for a watershed for day i. When Ri = Oi, COE = 1. This would represent a good comparison between observed and estimated runoff values. Where COE < 1, the estimated runoff value is less
66
MODELING AND REMOTE SENSING APPLIED TO AGRICULTURE (U.S. AND MEXICO)
representative than the mean value for the dataset. In general, COE values greater than 0.4 are considered to be highly significant.
Results and Discussion In this analysis, 9 out of 10 watersheds produced statistically significant runoff results using CNI with an initial abstraction coefficient of 0.1 when compared to observed runoff (Hadley, 2003). Traditionally, CNII would be used with an Ia coefficient of 0.2. Using a dry antecedent moisture condition would decrease runoff, whereas the 0.1 coefficient would slightly increase runoff by decreasing initial abstractions. These adjustments produced runoff estimates that more closely matched observed runoff than did the traditional calculations. For these nine watersheds, the combined COE was 0.70, the slope was 0.78, and the r2 was 0.77. Based on the significance of these findings, the modified runoff equation was extrapolated to the entire state. A more detailed description of these results can be found in Hadley (2003).
Real-Time Runoff Estimation Maps The three main datasets used to generate runoff estimates using the NRCS CN method are land-cover, soils, and precipitation data. For real-time runoff estimation, the land-cover data are obtained from the 1992 USGS National Land Cover Data (NLCD) at a 30-m resolution. In addition to land cover, the soil hydrologic group classification is needed to determine the CN value for a particular area. This information is derived from the U.S. Department of Agriculture (USDA) – NRCS State Soil Geographic (STATSGO) database, which was obtained at a 250-m resolution. The final input needed for this calculation is the rainfall depth for the day. Because rainfall is the driving factor in runoff, it is altogether necessary to obtain the most accurate rainfall input available. In this case, the Stage III NEXRAD radar rainfall data are used. These data are better able to capture the spatial and temporal variability of rainfall than traditional raingauge networks and are available at a 4-km resolution. Furthermore, as more detailed input data become available, they can be easily substituted for these existing datasets. With the use of ESRI’s ArcInfo software and AML scripts, real-time runoff maps are generated daily. The land-cover and soils data are used to assign the CN value from a lookup table. This value is then converted to the CNI, or dry antecedent moisture condition, value and used with the 0.1 Ia coefficient and the daily NEXRAD rainfall data to calculate surface runoff. The result is a daily runoff map that is posted on the internet for public use. In addition, using the Dem flow direction map to summarize runoff estimation will allow routing of stream flow into river reaches in order to estimate stream flow in real time.
Summary The goal of this study was to develop a near real time method for generating runoff estimates using the NRCS CN method. This was successful, based on the statistical significance of the runoff estimates as compared with observed USGS streamflow. Providing access to such information via the internet will prove useful in all types of watershed and water resource management, including reservoir operation. In addition, as NEXRAD rainfall data are replaced
REAL-TIME MODELING OF NATURAL RESOURCES USING THE SPATIAL SCIENCES
67
with forecast information, it will be possible to translate this methodology into a tool that could be used for flood prediction and mitigation.
CONCLUSIONS The research products discussed herein use readily available remote sensing and radar-based real-time data to provide decision-making tools to natural resource managers. Many more realtime applications could be developed by combining ground- and radar-based weather station data as well as information from various remote sensing platforms and rendering the raw and processed data through the internet. Similar research works are in progress to develop additional real-time systems for applications, such as crop growth monitoring using Growing Degree Days (GDD), Potential EvapoTranspiration (PET), and severity indices for crop diseases such as Sorghum Ergot and Wheat Karnal Bunt. Developing such tools would help action agencies, such as TFS, TWDB, USDA, and river authorities make time-sensitive decisions that could have significant impact on society.
ACKNOWLEDGMENTS The authors would like to thank several groups for their support and contributions. Dr. Alma Delia Baez-Gonzalez and Dr. Mario Tiscareño-Lopez at Laboratorio Nacional de Modelaje y Sensores Remotos, Campo Experimental Pabellón, INIFAP provided locations of corn and sorghum as well as Landsat ETM+ images for the real-time crop monitoring study. The Texas Forest Service (TFS) , the Texas Agricultural Experiment Station (TAES), and the Texas Water Resources Institute (TWRI) provided partial funding for the wildfire risk assessment study. In addition, TWRI provided partial funding for the real-time runoff prediction study.
REFERENCES Arnold, J.G., P.M. Allen, R. Muttiah, and G. Bernhardt. 1995. Automated baseflow separation and recession analysis techniques. Ground Water. 33(6):1010-1018. Baez-Gonzalez, A.D., P.Y. Chen, M. Tiscareño-Lopez, and R. Srinivasan. 2002. Using satellite and field data with crop growth modeling to monitor and estimate corn yield in Mexico. Crop Sci. 42(6):1943-1949. Chen, P.Y., R. Srinivasan, G. Fedosejevs, and J.R. Kiniry. 2003. Evaluating different NDVI composite techniques using NOAA-14 AVHRR data. Int. J. Remote Sens. 24(17):34033412. Chen, P.Y., R. Srinivasan, G. Fedosejevs, and B. Narasimhan. 2002. An automated cloud detection method for daily NOAA-14 AVHRR data for Texas, USA. Int. J. Remote Sens. 23(15):2939-2950. Chen, X.W., R. Tateishi, and C.Y. Wang. 1999. Development of a 1-km land-cover dataset of China using AVHRR data. ISPRS J. Photogramm. Remote Sens. 54(5-6):305-316. Cihlar, J. 1996. Identification of contaminated pixels in AVHRR composite images for studies of land biosphere. Remote Sens. Environ. 56:149-163. Crum, T.D. and R.L. Alberty. 1993. The WSR-88D and the WSR-88D operational support facility. Bull. Am. Meteorol. Soc. 74(9):1669-1687.
68
MODELING AND REMOTE SENSING APPLIED TO AGRICULTURE (U.S. AND MEXICO)
Dabrowska-Zielinska, K., F. Kogan, A. Ciolkosz, M. Gruszczynska, and W. Kowalik. 2002. Modeling of crop growth conditions and crop yield in Poland using AVHRR-based indices. Int. J. Remote Sens. 23(6):1109-1123. Fulton, R.A., J.P. Breidenbach, D.J. Seo, and D.A. Miller. 1998. The WSR-88D rainfall algorithm. Weather and Forecasting 37:377-395. Gutman, G., A. Ignatov, and S. Olson. 1994. Towards better quality of AVHRR composite images over land: Reduction of cloud contamination. Remote Sens. Environ. 50:134-148. Hadley, J.L. 2003. Near real-time runoff estimation using spatially distributed radar rainfall data. M.S. thesis. Texas A&M Univ., College Station. Hatfield, J.L., G. Asrar, and E.T. Kanemasu. 1984. Intercepted photosynthetically active radiation estimated by spectral reflectance. Remote Sens. Environ. 14:65-75. Huete, A., C. Justice, and H. Liu. 1994. Development of vegetation and soil indices for MODISEOS. Remote Sens. Environ. 49:224-234. Holben, B.N. 1986. Characteristics of maximum values Composite images from temporal AVHRR data. Int. J. Remote Sens. 7:1417-1434. Jakubauskas, M.E., D.L. Peterson, J.H. Kastens, and D.R. Legates. 2002. Time series remote sensing of landscape-vegetation interactions in the southern Great Plains. Photogramm. Eng. Remote Sens. 68(10):1021-1030. Jayakrishnan, R. 2001. Effect of rainfall variability on hydrologic simulation using WSR-88D (NEXRAD) data. Ph.D. diss. Texas A&M Univ., College Station. Keetch, J.J., and G.M. Byram. 1968. A drought index for forest fire control. USDA-Forest Service Research Paper No. SE 38. Asheville, NC. Kiniry, J.R., J.R. Williams, P.W. Gassman, and P. Debaeke. 1992. A general, process-oriented model for two competing plant species. Trans. ASAE. 35:801-810. Klazura, G.E. and D.A. Imy. 1993. A description of the initial set of analysis products available from the NEXRAD WSR-88D system. Bull. Am. Meteorol. Soc. 74(7):1293-1311. Maselli, F., S. Romanelli, L. Bottai, and G. Maracchi. 2000. Processing of GAC NDVI data for yield forecasting in the Sahelian region. Int. J. Remote Sens. 21(18):3509-3523. Narasimhan, B., R. Srinivasan, and A.D. Whittaker. 2003. Estimation of potential evapotranspiration from NOAA-AVHRR satellite. Appl. Eng. in Agric. 19(3):309-318. Nash, J.E. and J.V. Sutcliffe. 1970. River flow forecasting through conceptual models. Part I – A discussion of principles. J. Hydrol. 10:282-290. National Aeronautics and Space Administration (NASA). 2003. MODIS Web: About MODIS [Online]. [4p.] Available at http://modis.gsfc.nasa.gov/ (Downloaded 28 Oct. 2003). National Interagency Fire Center (NIFC). 2003.Wildland Fire Statistics [Online]. [2p]. Available at http://www.nifc.gov/ (Downloaded 10 Nov. 2003). National Oceanic and Atmospheric Admistration (NOAA). 2003. Office of Satellite Operation: Polar Spacecraft and Instruments [Online].[6p.] Available at http://www.oso.noaa.gov/ (Downloaded 10 Nov. 2003). Neitsch, S.L., J.G. Arnold, J.R. Kiniry, and J.R. Williams. 2001. Soil and Water Assessment Tool (SWAT) theoretical documentation. Blackland Research Center, Texas Agricultural Experiment Station, Temple, TX. Ohring, G., and P.F. Clapp. 1980. The effects of changes in cloud amount on the net radiation at the top of the atmosphere. J. Atmos. Sci. 37(2):447-454.
REAL-TIME MODELING OF NATURAL RESOURCES USING THE SPATIAL SCIENCES
69
Ponce, V.M. and R.H. Hawkins. 1996. Runoff curve number: Has it reached maturity? J. Hydrol. Eng. 1(1):11-19. Rasmussen, M.S. 1998. Developing simple, operational, consistent NDVI-vegetation models by applying environmental and climatic information: Part II. Crop yield assessment. Int. J. Remote Sens. 19(1)119-139. Shanahan, J.F., J.S. Schepers, D.D. Francis, G.E. Varvel, W.W. Wilhelm, J.M. Tringe, M.R. Schlemmer, and D.J. Major. 2001. Use of remote-sensing imagery to estimate corn yield. Agron. J. 93:583-589. Smith, J.A., D.J. Seo, M.L. Baeck, and M.D. Hudlow. 1996. An intercomparison study of NEXRAD precipitation estimates. Water Resour. Res. 32(7):2035-2045. Terrestrial Biophysics & Remote Sensing Lab. 2003. Enhanced vegetation index (EVI) [Online].[1 p.] Available at http://tbrs.arizona.edu/project/MODIS/evi.php (Updated 1 Feb. 2003). University of Arizona, Tucson, AZ. Ulivieri, C., M.M. Castronouvo, R. Francioni, and A. Cardillo. 1994. A split window algorithm for estimating land surface temperature from satellites. Adv. in Space Res 14(3):59-65.
70
(70) Página par en blanco
MODELING AND REMOTE SENSING APPLIED TO AGRICULTURE (U.S. AND MEXICO)