Abstract. This chapter focuses on real-world applications of fuzzy techniques for .... the case in various domains, such as statistics and data analysis, psychology.
Real-World Fuzzy Logic Applications in Data Mining and Information Retrieval Bernadette Bouchon-Meunier, Marcin Detyniecki, Marie-Jeanne Lesot, Christophe Marsala, and Maria Rifqi
Abstract. This chapter focuses on real-world applications of fuzzy techniques for information retrieval and data mining. It gives a presentation of the theoretical background common to all applications, lying on two main elements: the concept of similarity and the fuzzy machine learning framework. It then describes a panel of real-world applications covering several domains namely medical, educational, chemical and multimedia.
1 Introduction Information retrieval and data mining are two components of a same problem, the search of information and knowledge extraction from large amounts of data, very large databases or data warehouses. In information retrieval, the user knows approximately what he looks for, for instance an answer to a question, or documents corresponding to a given requirement in a database. The search is performed in text, multimedia documents (images, videos, sound) or in web pages. Transmedia information retrieval takes advantage of the existence of several media to focus on a more specific piece of information, for instance using sound and speech to help retrieving sequences in a video. The main difficulty lies in the identification of relevant information, i.e. the closest or the most similar to the user’s need or expectation. The concept of relevance is very difficult to deal with, mainly because it is strongly dependent on the context of the search and the purpose of the action launched on the basis of such expected relevant information. Asking the user to elicit what he looks for is not an easy task and, the more flexible the query-answer process, the more efficient the retrieval. This is a first reason to use fuzzy sets in knowledge representation to enable the user to express his expectations in a language not far from natural. The second reason lies in the approximate matching between the user’s query and existing elements in the database, on the basis of similarities and degrees of satisfiability. In data mining, the user looks for new knowledge, such as relations between variables or general rules for instance. The search is performed in databases
220
B. Bouchon-Meunier et al.
or data warehouses. The purpose is to find homogeneous categories, prototypical behaviors, general associations, important features for the recognition of a class of data. In this case again, using fuzzy sets brings flexibility in knowledge representation, interpretability in the obtained results, in rules or in characterizations of prototypes. Looking for too strict a relation between variables may be impossible because of the variability of descriptions in the database, while looking for an imprecise relation between variables or to a crisp relation between approximate values of variables may lead to a solution. The expressiveness of fuzzy rules or fuzzy values of attributes in a simplified natural language is a major quality for the interaction with the final user. The main problems in information retrieval and data mining lie in the large scale of databases, especially when dealing with video or web resources, in the heterogeneous data of various types, numerical or symbolic, precise or imprecise, ambiguous, approximate, with incomplete files, uncertain because of the poor reliability of sources or the difficulties of measurement of observation. Another source of problems is the complexity of the user’s requests, expressed in natural language or involving various criteria for instance. The necessity to create cooperative systems, friendly and user-oriented, adapted to the user’s needs or capabilities, providing a personalized information, leads to soft approaches to man-machine interaction and to on-line or off-line learning of the best way to satisfy the demand. Fuzzy logic is very useful in this matter because of its capability to represent miscellaneous data in a synthetic way, its robustness with regard to changes of the parameters of the user’s environment, and obviously its unique expressiveness. This chapter focuses on real-world applications of fuzzy techniques for information retrieval and data mining. It first gives a brief presentation of the theoretical background common to all applications (Sect. 2), decomposed into two main elements: the notion of similarity and the fuzzy machine learning techniques that are applied in the described applications (Sect. 3). Indeed, similarity, or more generally comparison measures are used at all levels of the data mining and information retrieval tasks: at the lowest level, they are used for the matching between a query to a database and the elements it contains, for the extraction of relevant data. Then similarity and dissimilarity measures can be used in the process of cleaning and management of missing data to create a training set. In the various techniques to generalize particular information contained in this training set, dissimilarity measures are used in the case of inductive learning, similarity measures for case-based reasoning or clustering tasks. Eventually, similarities are used to interpret results of the learning process into an expressible form of knowledge, for instance through the definition of prototypes. Section 2.1 presents the similarity notion more formally. Section 2.2 considers a complementary component of similarity, the fuzzy learning techniques in which they can be used. It describes methods used in the applications presented in Sect. 3, namely fuzzy decision trees, that perform fuzzy inductive learning, fuzzy prototype extraction, that provides flexible
Real-World Fuzzy Logic Applications
221
characterization of data sets, and fuzzy clustering, that identifies relevant subgroups in data sets. Finally we describe in Sect. 3 real-world applications exploiting these methods and belonging both to the data mining and information retrieval fields. They cover several domains, such as medical (Sect. 3.1), educational (Sect. 3.2), chemical (Sect. 3.3), and multimedia (Sect. 3.4).
2 Theoretical Background In this section, we recall the theoretical background common to the applications presented in Sect. 3, considering successively the notion of similarity (Sect. 2.1) and fuzzy machine learning techniques (Sect. 2.2). 2.1 Similarity The notion of similarity, or more generally of comparison measures, is central for all real-world applications: it aims at quantifying the extent to which two objects are similar, or dissimilar, one to another, providing a numerical value for this comparison. Similarities and dissimilarities between objects are generally evaluated from values of their attributes or variables characterizing these objects. It is the case in various domains, such as statistics and data analysis, psychology and pattern recognition for instance. Dissimilarites are classically defined from distances. Similarities and dissimilarities are often expressed from each other: the more similar two objects are, the less dissimilar they are, the smaller their distance. Weights can be associated with variables, according to the semantics of the application or the importance of the variables. It appears that some quantities are used in various environments, with different forms, based on the same principles. For instance, the most classic dissimilarity measures between two objects with continuous numerical attributes are the Euclidian distance, the Manhattan distance, and more generally Minkowski distances. In the case of binary attributes, coefficients introduced by Russel-Rao, Jaccard, Dice or Ochiai are very popular. For more details, see [6, 47, 52]. Tversky’s Model A more theoretical form of similarity measure has been introduced by Tversky in a psychometrical framework within the so-called Tversky’s contrast model [52]: given two objects described by the sets of their characteristics, respectively denoted A and B, this model defines a similarity measure s(A, B) as a function of the common features of the two objects (A∩B) and their respective distinct features (A−B and B−A) that verifies the properties of monotonicity, independence, solvability and invariance [52].
222
B. Bouchon-Meunier et al.
Using this axiomatic, Tversky shows that the similarity takes the form s(A, B) = θf (A ∩ B) − αf (A − B) − βf (B − A) where f is a non-negative scale and α, β and θ are non-negative parameters. Tversky also proposed non-linear similarity measures, in the so-called ratio model that takes the form s(A, B) =
f (A ∩ B) f (A ∩ B) + αf (A − B) + βf (B − A)
Fuzzy Comparison Measures Considering Tversky’s approach and the large variety of measures existing in the literature, we proposed a unified vision of measures of comparison [6], considering both measures of similarity and dissimilarity, in the case of fuzzy set-valued variables (crisp values can be handled as well with such measures). Given a universe X, let F (X) denote its fuzzy power set. Let M be a fuzzy set measure M : F (X) → R+ and a difference Θ : F (X) × F (X) → F (X). For instance, denoting fA the membership function of a fuzzy set A, we can ' choose M (A) = X fA (x)dx and fAΘB (x) = max(0, fA (x) − fB (x)) for all x ∈ X. A measure of comparison is then defined [6] on X as a function S verifying S : F (X) × F (X) → [0, 1] such that S(A, B) = Fs (M (A ∩ B), M (BΘA), M (AΘB)) where Fs is a function Fs : R3 → [0, 1]. Depending on the properties required from the Fs , different particular cases of comparison measures can be distinguished: • A measure of similitude is such that Fs (u, v, w) is non-decreasing in u and non-increasing in v and w. • A measure of resemblance is a particular measure of similitude, reflexive (i.e. S(A, A) = 1 for any A) and symmetrical (i.e. S(A, B) = S(B, A)). For instance, one can consider ( fA∩B (u)du S(A, B) = (X fA∪B (u)du X
• A measure of dissimilarity is such that FS (u, v, w) is non-increasing in u, non-decreasing in v and w.
Real-World Fuzzy Logic Applications
223
2.2 Fuzzy Machine Learning The second part of the theoretical background common to all applications described in Sect. 3 concerns the fuzzy machine learning techniques, that use the previous similarity measures. Machine learning is an important way to extract knowledge from sets of cases, specially in large scale databases. In this section, we consider only the fuzzy machine learning methods that are used in the applications described in Sect. 3, leaving aside other techniques as for instance fuzzy case based reasoning or fuzzy association rules (for a complete review on fuzzy learning methods, the interested reader is referred to [20]). Three methods are successively considered: fuzzy decision trees, fuzzy prototypes and fuzzy clustering. The first two belong to the supervised learning framework, i.e. they consider that each data point is associated with a category. Fuzzy clustering belongs to the unsupervised learning framework, i.e. no a priori decomposition of the data set into categories is available. Fuzzy Decision Trees Fuzzy decision trees (FDT) are particularly interesting for data mining and information retrieval because they enable the user to take into account imprecise descriptions of the cases, or heterogeneous values (symbolic, numerical, or fuzzy) [22,44,54,56]. Moreover, they are appreciated for their interpretability, because they provide a linguistic description of the relations between descriptions of the cases and decision to make or class to assign [20]. The rules obtained through FDT make it easier for the user to interact with the system or the expert to understand, confirm or amend his own knowledge. Another quality of FDT is their robustness, since a small variation of descriptions does not drastically change the decision or the class associated with a case, which guarantees a resistance to measurement errors and avoids sharp differences for close values of the descriptions. For these reasons, FDT have been extensively used in the past years. What they mainly provide for knowledge extraction is, first a ranking of attributes bringing information about the importance of various criteria in the assignment of decision or class, secondly rules establishing a link between descriptions and decision. Most algorithms to construct decision trees proceed in the same way, the so-called Top Down Induction of Decision Tree (TDIDT) method. They build a tree from the root to the leaves, by successive partitioning of the training set into subsets. Each partition is done by means of a test on an attribute and leads to the definition of a node of the tree. An attribute is selected thanks to a measure of discrimination H (in classic decision tree, the Shannon entropy is generally used [8, 43], it comes from Information Theory [2]). Such a measure makes it possible to order the attributes according to an increasing accuracy when splitting the training set. The discriminating power of each
224
B. Bouchon-Meunier et al.
attribute is valued with regard to the classes. The attribute with the highest discriminating power is selected to construct a node in the decision tree. Methods to construct decision trees, whether crisp or fuzzy, differ mainly in their choice of H [34]; in the fuzzy case, two main families can be distinguished. The first one deals with methods based on a generalized Shannon entropy: the entropy of fuzzy events as a measure of discrimination [22, 44, 54, 56]. It corresponds to the Shannon entropy extended to fuzzy events by substituting probabilities of fuzzy events to classic probabilities. The second one deals with methods based on another family of fuzzy measures [7,11,38,53], namely a measure of classification ambiguity, defined from both a measure of fuzzy subsethood and a measure of non-specificity. For the practical construction of fuzzy decision trees for the applications in Sect. 3, we used our software Salammbˆ o [33]: this system implements the previous tree learning method in a flexible framework, allowing the user to choose the measure of discrimination among the previous possibilities, as well as the splitting strategy and the stopping criterion. Furthermore, it offers an internal method for the construction of fuzzy values, deduced from the universe of values of continuous attributes related to the distribution of the classes [32]. Fuzzy Prototype Construction Fuzzy prototypes [30, 46, 57] constitute another approach to the characterization of data categories: they provide descriptions or interpretable summarizations of data sets, so as to help a user to better apprehend their contents: a prototype is an element chosen to represent a group of data, to summarize it and underline its most characteristic features. It can be defined from a statistic point of view, for instance as the data mean or the median; more complex representatives can also be used, as the Most Typical Value [17] for instance. The prototype notion was also studied from a cognitive science point of view, and specific properties were pointed out [48, 49]: it was shown that a prototype underlines the common features of the category members, but also their distinctive features as opposed to other categories, underlining the specificity of the group. Furthermore, prototypes were related to the typicality notion, i.e. the fact that all data do not have the same status as regards the group: some members of the group are better examples, more representative or more characteristic than others. It was also shown [48, 49] that the typicality of a point depends both on its resemblance to other members of the group (internal resemblance), and on its dissimilarity to members of other groups (external dissimilarity). These definitions were exploited by Rifqi [46] who proposed a construction method implementing these principles and exploiting the similarity measure framework presented in Sect. 2.1. More precisely, the method consists in first computing internal resemblance and external dissimilarity for each data point: they are respectively defined as the aggregation (mean or median e.g.) of
Real-World Fuzzy Logic Applications
225
the ressemblance to the other members of the group, and as the aggregation of the dissimilarity to members of other groups, for a given choice of the resemblance and dissimilarity measures (see Sect 2.1). In a following step, a typicality degree is computed for each data point as the aggregation of its internal resemblance and external dissimilarity. In a last step, the prototype itself is defined, as the aggregation of the most typical category members. Fuzzy prototypes are defined as the application of this method to fuzzy data [46], or to crisp data that are aggregated into fuzzy sets [30]. Former case, illustrated in Sect. 3.1, corresponds to data whose attribute values are not numerical values but fuzzy subsets. Latter case, illustrated in Sect. 3.2, makes it possible to model the intrinsic imprecise nature of the prototype: it is more natural to say “the typical French person measures around 1.70m”, rather than “the typical French person measures 1.6985” (fictitious values). This implies the prototype is best described by an imprecise linguistic expression “around 1.70m” than a crisp numerical value. Now the aggregation step that builds prototypes from the most typical data can build a fuzzy set, derived from the typicality degree distribution [30]. Such fuzzy prototypes then characterize data sets, underlining both the common features of the group members and their distinctive features, and modeling their unsharp boundaries. Fuzzy Clustering Contrary to fuzzy decision trees and fuzzy prototype construction methods, clustering algorithms belong to the unsupervised learning framework, i.e. they do not consider that a decomposition of the data set into categories is available. They perform data mining as the identification of relevant subgroups of the data, determining subsets of similar data and thus highlighting the underlying structure of the data set. More precisely relevant subgroups are such that points within a group are more similar one to another than to points assigned to a different subgroup. Thus, as the previous learning methods, they rely on comparison measures as presented in Sect. 2.1. The clustering aim can also be expressed as the decomposition of the data set into subgroups that are both homogeneous and distinct: the fact that clusters are homogeneous implies that points in the same subgroup indeed resemble one another, which justifies their grouping. The fact that they are distinct justifies the individual existence of each cluster that captures different characteristics of the data. Through this decomposition, clustering leads to a simplified representation of the data set that can be summarized by a reduced number of clusters instead of considering each individual data point. The fuzzy set theory proves its advantage in this framework through the notion of membership degrees: in crisp clustering algorithms, such as the kmeans or hierarchical methods (see e.g. [21]), a point is assigned to a single cluster. Now this is not adapted to the frequent case where clusters overlap and points have partial memberships to several subgroups. Ruspini [50] first proposed to exploit fuzzy set theory to represent clusters, so as to model
226
B. Bouchon-Meunier et al.
unclear assignments and clusters with unsharp boundaries. Dunn [16] proposed the first fuzzy clustering algorithm, called fuzzy c-means (FCM), that was generalized by Bezdek [3, 4]. Since then, many variants have been proposed to address specific aims (e.g. noise handling [12, 26], adapting to other data or cluster types [18, 24, 55], or considering fuzzy clustering at a more formal level [23]), leading to the vast fuzzy clustering domain (see e.g. [19]).
3 Real-World Applications In this section, a panel of real-world fuzzy logic applications is presented, based on the similarity framework and the fuzzy learning methods described in the previous section. They belong both to the data mining and information retrieval fields, and cover several domains, namely medical (Sect. 3.1), educational (Sect. 3.2), chemical (Sect. 3.3) and multimedia (Sect. 3.4). For each application, the objective of the task, the considered data, the applied method and the obtained results are successively described. 3.1 Medical Applications Medical applications are good cases where Fuzzy Set Theory can bring out enhancement as compared to classic algorithms because most of the attributes used here to characterize cases are associated with imprecise values. In this section, we present three applications of data mining, respectively to prevent cardio-vascular diseases, to measure asthma severity and to detect malign microcalcifications in mammographies. Data Mining to Prevent Cardio-Vascular Diseases This project was done thanks to financial supports by INSERM and was led by M.-C. Jaulent (INSERM ERM 0202). Researchers from several French universities collaborated with a medical scientist on a well-known database to prevent cardio-vascular diseases. Objective The main objective here was to find discriminating features in order to prevent cardio-vascular diseases. Predictions should help medical scientists to detect and prevent cardio-vascular diseases for hypertensive patients. Data The used data were the INDANA (INdividual Data ANalysis of Antihypertensive intervention) database. This database is composed of ten therapeutic samples based on cardio-vascular risks for patients. For each patient, a set of
Real-World Fuzzy Logic Applications
227
classic features is combined with a set of medical measurements on several years and leads to the conclusion for this patient (death or not). The particular database used for our experiments was composed by the features for patients. In this set, 107 patients died of a cardio-vascular disease, and 2132 were alive at the end of the experiment. Method One of the main problems to solve here comes from the fact that the proportion of classes is heavily unbalanced, which makes it impossible to use classic decision tree algorithms. We focused on the use of fuzzy decision trees in order to obtain an interpretable set of fuzzy rules. The working plan was the following. First of all, one hundred pairs of sets (dual training set and test set) was generated randomly from the initial data set. In a second step, each training set was used to construct a fuzzy decision tree, as detailed in the sequel. Afterwards, each fuzzy decision tree was used to classify the corresponding test set. In the last step an aggregation was performed: for each case of the initial set, a set of classification degrees was obtained (from the 100 fuzzy decision trees). The final class associated with the case was the one that obtained the highest aggregation degree. The construction of the fuzzy decision trees was done as presented in Sect. 2.2: we used the Salammbˆ o software [33] (see Sect. 2.2), choosing star entropy as discrimination measure, α−cut strategy as splitting strategy and a criterion based on the Shannon information measure and the number of examples in the local training set [33] as stopping criterion. Results The obtained global good classification rate for the cardio-vascular rate was around 70%. More interesting was the analysis of the details of the classification: it showed the existence of high disparities among the patients. Indeed, it highlighted the existence of patient subsets that were very hard to classify and others that obtained 100% good classification. Data Mining for Assessing Asthma Severity Objective The main objective in this study [31], conducted in collaboration with Dr Alain Lurie1 , was to identify variables and decision pathways patients use 1
(1): Service de Pneumologie, Hˆ opital Cochin, Assistance Publique-Hˆ opitaux de Paris, 27 rue du Faubourg Saint-Jacques, F-75679 Paris Cedex 14, (2): Laboratoire d’Explorations Fonctionnelles Respiratoires et du Sommeil, Hertford British Hospital, 3 rue Barb`es, F-92300 Levallois-Perret
228
B. Bouchon-Meunier et al.
to determine the severity of their asthma (perceived severity of the asthma). In a second step, the identified variables were compared to those involved in the assessment of asthma severity according to the National Asthma Education and Prevention Program (NAEPP) Guidelines (objective severity of the asthma). Data The database was composed by a set of 113 outpatients (51 men, 62 women), with (% patients) mild intermittent (6.2), mild persistent (15.9), moderate (65.5) and severe (12.4) asthma. A questionnaire was filled for each patient with several features, among which the patient’s sociodemographic characteristics and his asthma characteristics. For the latter, two parts are to be distinguished, respectively assessed by the patient himself and by the doctors: the patient had to assess his perceived asthma severity (rated as mild intermittent, mild persistent, moderate or severe), the response to treatment (perceived treatment efficiency), the quality of his life, and the rating of its medical adherence by the patient. The doctor part concerned the objective asthma severity (also rated as mild intermittent, mild persistent, moderate or severe) derived from medical criteria and the valuation of the respiratory functions. All these variables were pooled, and considered as potential variables patients might use to determine the perceived severity of their asthma. Method A fuzzy decision tree was constructed thanks to the Salammbˆ o software (see Sect. 2.2) in order to obtain a fuzzy rule set to identify a set of variables and decision pathways patients use to determine the severity of their asthma. Results A 4-fold cross validation was undertaken to validate the obtained model. This cross-validation evaluated the accuracy and the robustness of the model, and highlighted the usefulness of the decision tree for patients outside the training set. A fuzzy decision tree predicted the decision class with a mean rate of 73%. Learning to Detect Malign Microcalcifications in Mammographies One woman in 8 in the United States and one woman in 10 in Europe has a breast cancer during her life. Nowadays, mammography is the primary diagnostic procedure for the early detection of breast cancer. Until recently, all information in mammography was acquired, fused and evaluated by the doctor. Today however, with the increasing performance of image processing techniques, we are at a point where doctors using a computer
Real-World Fuzzy Logic Applications
229
aided detection (CAD) system perform better in some aspects than the doctors by themselves. The strong points of CAD systems are their precision and repeatability. Logically, efforts are being made to combine the expert knowledge of the doctor with the precision and repeatability of the CAD system. Microcalcification2 clusters are an important element in the detection of breast cancer. This kind of finding is the direct expression of pathologies which may be benign or malignant. Objective The objective of the project, conducted in collaboration with General Electric Medical Systems, was to provide an automatic classification of microcalcifications. Such a tool provides to the radiologist: • an objective description, • a systematic classification of every microcalcification in the image. These two characteristics are the foundations for a good diagnosis. Furthermore, providing a good description of the relevant classes to the radiologists enables them to improve their performances. Fuzzy logic is a powerful tool for the formulation of expert knowledge and the combination of imprecise information from different sources. To achieve meaningful results the imprecision in all information used to come to a conclusion should be taken into account. Data The description of microcalcifications is not an easy task, even for an expert. If some of them are easy to detect and to identify, some others are more ambiguous. The texture of the image, the small size of objects to be detected (less than one millimeter), the various aspects they have, the radiological noise, are parameters which impact the detection and the characterization tasks. More generally, mammographic images present two kinds of ambiguity: imprecision and uncertainty. The imprecision on the contour of an object comes from the fuzzy aspect of the borders: the expert can approximately define the contour but certainly not with a high spatial precision. The uncertainty comes from the microcalcification superimpositions: because objects are built from the superimpositions of several 3D structures on a single image, we may have a doubt about the contour position. The first step consists in finding automatically the contours of microcalcifications. This segmentation is also realized thanks to a fuzzy representation of imprecision and uncertainty (more details in [45]). Each microcalcification 2
The microcalcifications are small depositions of radiologically very opaque materials that can be seen on mammography exams as small bright spots
230
B. Bouchon-Meunier et al.
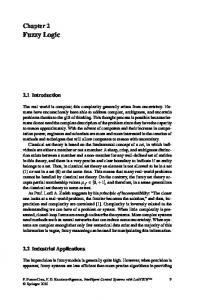
is then described by means of 5 fuzzy attributes computed from its fuzzy contour. These attributes enable us to describe more precisely: • the shape (3 attributes): elongation (minimal diameter/maximal diameter), compactness1, compactness2. • the dimension (2 attributes): surface, perimeter.
1.2
1.2
1
1 Membership degree
Membership degree
Figure 1 shows an example of the membership functions of the values taken by a detected microcalcification. One can notice that the membership functions are not ”standard” in the sense that they are not triangular or trapezoidal (as it is often the case in the literature) and this is because of the automatic generation of fuzzy values (we will not go into details here, interested readers may refer to [5]).
0.8 0.6 0.4
0.8 0.6 0.4 0.2
0.2
0
0 0
10
20
30
40
50
60
70
140 160 180 200 220 240 260 280 300
80
Elongation
Surface
1.2
1.2 1 Membership degree
Membership degree
1 0.8 0.6 0.4 0.2
0.8 0.6 0.4 0.2
0
0 100
120
140 160 180 200 Compactness1
220
240
0
2
4
6 8 10 Compactness2
12
14
1.2
Membership degree
1 0.8 0.6 0.4 0.2 0 0
10
20 30 Perimeter
40
50
Fig. 1. Description of a microcalcification by means of fuzzy values
Real-World Fuzzy Logic Applications
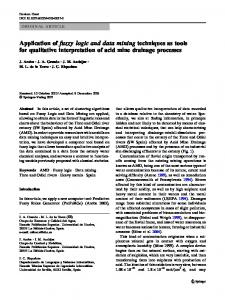
231
Method Experts categorised microcalcifications into 2 classes: round microcalcifications and not round, because this property is important to qualify the malignancy of the microcalcification. Each class was described by means of fuzzy prototypes, as described in Sect. 2.2, with the median as the aggregation operator for both internal similarity and external dissimilarity. Details about the specific similarity and dissimilarity are given in [45]. Results Figure 2 gives the obtained fuzzy prototypes describing the two classes. It can be seen that on the attributes elongation, compactness1 or compactness2, the typical values of the two classes round and not round, are quite different: the intersection between them is low. This can be interpreted in the following way: a round microcalcification has typically an elongation approximatly between 100 and 150 whereas a not round microcalcification has typically an elongation approximatly between 150 and 200, etc. For the attributes surface and perimeter, at the opposite of the previously attributes, the typical values of the two classes are superimposed, it means that these attributes are not typical. 3.2 Educational Applications Providing Interpretable Characterizations of Students In this section, we consider another domain application for fuzzy machine learning methods, namely the educational domain. The presented application was performed in the framework of a project with the schoolbook publisher Bordas-Nathan. Objective The considered task consists in characterizing students, through the identification of relevant groups of students having the same characteristics, and the comparison of several student classes, to determine whether the classes present the same characteristics or not. Of special importance is the interpretability of the results, to enable a teacher to exploit the information and the structure identified in the student data. Data The considered data are descriptions of students, each student being represented as the vector of its results to several exams. No category information is provided, i.e. no knowledge about the decomposition of the data into categories is available.
B. Bouchon-Meunier et al. NOT ROUND
1.2
1.2
1
1 Membership degree
Membership degree
ROUND
0.8 0.6 0.4 0.2
0.6 0.4
0 0
10
20 30 Surface
40
50
0
1.2
1.2
1
1 Membership degree
Membership degree
0.8
0.2
0
0.8 0.6 0.4 0.2
10
20 30 Surface
0.8 0.6 0.4
150
200
250
300
100
150
200
Elongation
250
300
200
250
15
20
Elongation
1.2
1.2
1
1 Membership degree
Membership degree
50
0 100
0.8 0.6 0.4 0.2
0.8 0.6 0.4 0.2
0
0 50
100
150
200
250
50
100
Compactness1
150
Compactness1
1.2
1.2 1 Membership degree
1 Membership degree
40
0.2
0
0.8 0.6 0.4 0.2
0.8 0.6 0.4 0.2
0
0 0
5
10
15
20
0
5
Compactness2
10 Compactness2
1.2
1.2 1 Membership degree
1 Membership degree
232
0.8 0.6 0.4 0.2
0.8 0.6 0.4 0.2
0
0 0
5
10
15 Perimeter
20
25
30
0
5
10
15
20
25
30
Perimeter
Fig. 2. Fuzzy prototypes of the classes “round” and “not round”
Real-World Fuzzy Logic Applications
233
For the dissimilarity measure, we simply use the Euclidean distance between the vectors representing the students. In the case where more information is available (for instance information about the relationships between the exams), more sophisticated similarity measures can be used [27]. Method To perform data mining with these data, several methods were combined, namely fuzzy prototypes, fuzzy clustering and exceptionality coefficients. Fuzzy prototypes, as detailed in Sect. 2.2, correspond to flexible data characterizations, that underline the common features of the group members, as well as their distinctive features as compared to other groups. Fuzzy clustering (see Sect. 2.2) is applied to identify relevant subgroups in the student set; the chosen algorithm is the Outlier Preserving Clustering Algorithm, opca [29]. This combination of FCM and hierarchical clustering with single linkage offers a particular outlier handling: contrary to the general case, it does not consider outliers as noisy points or aberrations that must be identified and excluded from the data, but interprets them as specific cases, that are as significant as classic clusters to summarize and describe the data. Thus it handles outliers as clusters reduced to a single point, and preserves them in the final data decomposition. Finally, exceptionality coefficients [28] are tools to further characterize clusters, indicating the extent to which a cluster is exceptional or representative of the data: it makes it possible to distinguish major trends and atypical behaviors and models intuitive descriptions: consider for instance a device having three modes, described as “high”, “low” and “abnormally low”. The exceptional case “abnormally low” is part of the system description, which is indeed necessary, but the adverb “abnormally” underlines its specificity. Exceptionality coefficients quantifies this notion, allowing to identify the most representative clusters for the whole data set. Results First, we consider the task of characterizing a set of students, at a semantic and interpretable level, using fuzzy prototypes: Figure 3 shows the level lines of the fuzzy prototypes describing the data set containing the results obtained by 150 students at 2 exams. It was decomposed into 5 categories by the FCM algorithm: the central cluster corresponds to students having average results for both exams, the 4 peripheral clusters correspond to the 4 combinations success/failure for the 2 exams. The obtained fuzzy prototypes capture the semantics of the subgroups: they are approximately centered around the group means, but take into account the discriminative features of the clusters and underline their specificity. Indeed, they influence each other and are further apart than the averages would be. In the case of the lower left cluster for instance, the student having obtained twice the mark 0 totally belongs to the prototypes, which corresponds to the group interpretation as students having
234
B. Bouchon-Meunier et al. 1
20 0.9
18 16
0.8
14
0.7
12
0.6
10 0.5
8 6
0.4
4
0.3
2
0.2
0 0
5
10
15
20
0.1
Fig. 3. Fuzzy prototypes characterizing students described by their results on two exams [28]
failed at both exams and underlines its specificity. Furthermore, the fuzzy properties of these prototypes indicate the transitions between the groups and model their unsharp boundaries, providing richer information than a single numerical value. Figure 4 illustrates the task of class comparison: two classes were evaluated for the same exam and are to be compared. To that aim, the two classes are first decomposed using the opca algorithm, clusters are then represented through their fuzzy profiles [29], as shown on the first row of Fig. 4, and 1
1
0.8
0.8
0.6
0.6
0.4
0.4
0.2
0.2
0 0
5
10
15
20
0 0
5
10
15
20
5
10
15
20
50 50
40 40
30
30
20
20
10
10 0 0
5
10
15
20
0 0
Fig. 4. Fuzzy profiles and exceptionality coefficients for two student classes [28]
Real-World Fuzzy Logic Applications
235
finally enriched by exceptionality coefficients, as shown on the second row. As expected, opca identifies both classic clusters and one-point cluster corresponding to specific cases: for instance in the left case, two students having especially big difficulties are identified; in the right case, three levels of especially brilliant students are detected. The fuzzy profiles show that the two classes have the same global structure, made of a large middle group, with some smaller groups. The class represented on the left appears less homogeneous, as it contains two students having difficulty but it has a more important best student group. Exceptionality coefficients enrich this description and modify the impression, showing that the two classes are actually different: the left class can be globally characterized as having better results. In both cases, the group with the lower exceptionality coefficient is the middle group, which indeed is the most representative cluster for the whole class. Yet differences are to be observed for the other groups: in the right-hand case, the best students have high exceptionality coefficients, i.e. they appear as outliers. In the lefthand case, the exceptions correspond to the lower results, and the high ones have lower exceptionality coefficients, indicating they are more characteristic of the whole class. 3.3 Chemical Applications Management of Sensorial Information This project was conducted in collaboration with the chemistry and computer science departments of the Science and Technique faculty of the Mohammedia university (Morocco). Objective In order to be discerned, volatile compounds, pure chemicals or miscellanies, are elated by the air to the nose where they are warmed and humidified. The birth of olfactory message results from the adsorption of the arriving smelling molecules to the nasal mucus. Several theories of olfaction were suggested but, until now, the mechanism of perception stays unrecognized although progress have been made in different disciplines related to the chimioreception. Chemists attempt to contribute to the understanding of the mechanisms implied in the olfaction by the investigation of the links that bind the chemical structure of the smelling to the quality of their odors. To this academic goal, a convenient and commercial interest can be added as the rational design of new molecules which could be used in the industry of fragrance, aromas and cosmetic. Thus the aim of the study [37] is to extract relationships between the molecule properties and its odor. The first difficulty of this task deals with the translation of the structure of chemicals in a set of parameters containing the usable information to solve
236
B. Bouchon-Meunier et al.
the problem. Among other methods, the auto correlation [58] and the fragmentation method [9,25] have been applied and obtained a satisfactory degree of success. More recently, artificial neural networks have been applied [10]. Yet they allow neither to establish mathematical equations between the studied odor and the used descriptors, nor to give off any rules allowing to know the role and the influence of every used descriptor. While descriptors generally used in this domain are of precise nature -continuous or discrete- the made decisions are shaded. Experts always classify the quality of an odor by some symbolic descriptors on some numeric scales such as “strong or weak odor of musk”, or “absence or presence of studied odor”. Classic systems do not allow the treatment of this double description of the odor. Data The set of studied compounds is constituted by 99 aliphatic alcohols. The odor of these alcohols was described in details by Schnabel et al. [51] using 16 symbolic descriptors on an active scale valued from 1 to 5. We focus here on the odor of camphor, considering as camphoraceous the 58 compounds that have a score between 1 and 5 on the Schnabel’s scale, and as non-camphoraceous the 41 compounds with score 0. The molecules are represented using a descriptive model obtained by the GESDEM method (Generation and selection of descriptor and pattern elaboration) [59], combined to geometric and physico-chemical characteristics. The GESDEM methodology uses as descriptors the groups of atoms held together by bonds and constituting specific subgraphs of the considered molecule (see [37] for more details). The geometric and physico-chemical information is made of 10 attributes such as the molecule length, its width, its depth, its molecular refraction, its density, its aqueous solubility, an indication of its relative lipophilicity, and some ratios between these quantities. Method The method used here was the construction and the use of fuzzy decision trees thanks to the Salammbˆ o software (see Sect. 2.2). Results First a 4-fold cross-validation test using all attributes was conducted, leading to 88.0% good classification rate, and showing an improvement when compared to crisp decision trees. Figure 5 shows the obtained tree: within each node of the tree, the number of molecules pertaining to this node is given. On each vertex going out of a node, a test on the value of an attribute is given. This test can be a crisp one (e.g. ≤ 1) or a fuzzy one (e.g. small), in this case, the membership partition constructed by the Salammbˆ o software is shown. The root of the tree tests the 4D4 attribute, which is related to bonds of the type C-C(C)-C: it indicates the number of atoms of tertiary carbons and quaternary carbons and gives an idea on the global shape of the molecule.
Real-World Fuzzy Logic Applications
237
99 1
1
4D4
37 6
62 6
1D2
12
25 1
large
7
5
1
>1
3D1
19
6
large
13
49
aLogP small
d
small
=1
4D3 6D6
6D1
(C) 0
6D1
>4
6
17
32 1
4
>1
2
1
6D1 =1
7 1
aLogP small
large
0.96
0.94 small
d
4
14
4
12
1
5
1
1 0
large
6D3
1
6 Non Camphoraceous 32 Camphoraceous
3
1
0.800 0.810
Fig. 5. Fuzzy decision tree to classify camphoraceous data
Tests were also performed using only the attributes of the descriptive model of molecules or only the geometric and physico-chemical attributes. They showed that the descriptive model is efficient to determine attributes to predict the camphoraceous odor of a molecule. Moreover, these attributes are more easily evaluated than geometric attributes which are more complex to measure and that do not improve greatly the prediction of the odor. 3.4 Multimedia Applications In this section, we consider applications in data mining and information retrieval in the multimedia field. We describe first an image retrieval application based on a visual similarity navigation paradigm and second a learning approach for a semantic annotation of a video signal, based on some examples. Searching in a Clothes Catalogue by Visual Similarity This work is part of the results of the ITEA European project: KLIMT KnowLedge InterMedation Technology. Although in this project several laboratories and industry partners were involved to accomplish what follows, the company Sinequa played a significant role.
238
B. Bouchon-Meunier et al.
Objective The main objective of this work was to enhance a classic text search engine of an on-line clothes catalogue, with an image search tool. A prototype was developed that illustrated the complementarities between the two navigation schemas: text queries and visual-similarity browsing. Data The data was provided by an on-line store client of Sinequa: La Redoute. For the development of the prototype we disposed of a database of 5000 products. For each of them, we had one or two images and the associated text description. The text was semi-structured in an XML format (title, price, description, etc) and the images were generally of low quality and of mid-size (around 300 x 300). Method We were responsible for the image search and the fusion of the information. The text search was based on Sinequas engine: Intuition. It works very similarly any other text based engine, with a strong focus on linguistics and semantics. When searching based on visual features, it is extremely difficult to specify the query. In fact, we do not have any keywords that could be found, in a way or another, inside a targeted text. One idea is to use an example as starting point and then look for images similar to this initial one. In order to achieve this, we need two keystones: on the one hand, we need to define a numerical description of the image and a similarity that will translate the fact that two images are visually similar. Traditionally histograms of colors, textures and forms are used to describe the image; then a classic distance (usually Euclidean) is used to compare them. The main disadvantage of using distances is that they are very sensitive to the number of dimensions used to describe the histogram. Therefore we used Tversky’s ratio model (see Sect. 2.1), which is not only stable in this respect, but is also based on a psychological framework. Searching visually-similar clothes based on an example is interesting as long as we can isolate the clothes from the rest of the image. To achieve this, we developed a segmentation algorithm, which is fast and robust with respect to textures (prints on the clothes, etc). During the indexation phase (offline), we applied the segmentation algorithm to all images and we described all segments based on their colors, forms and position. In a second phase (on-line), we compute on the fly the similarities of the example segment with all other segments. This computation for the size of the database is instantaneous.
Real-World Fuzzy Logic Applications
239
Results As a result we developed an image and text search engine, with a look and feel of the La Redoute on-line store. On Fig. 6 we can see part of the interface, where the user chooses the region of the image of his interest. Although no usability tests were driven, we observed that users, when looking for something specific, prefer to use text queries. But when lounging around they do like the possibility to find visually similar clothes. This is particularly true for descriptions that are difficult to translate into text, as for instance specific color patterns or prints. More details about this specific work and further results on text and image fusion can be found in [39]. The reader interested on further results on image search based on segments can read [40] and if interested on the theoretical consequences of using Tversky’s similarities in the general case of information retrieval refer to [41]. Learning to Label a Video Signal with High Level Features This application was conducted for the TREC Video Retrieval 2005 challenge organized yearly by the NIST institute [1]. Objective In order to retrieve specific information in a video, we need to index it. The index consists of a set of labels and attached to each label a set of time locator. These labels may be of different type and we focus here on high level features, as for instance: the presence of a map in the segment, the presence of
Fig. 6. On the left we observe the part of the interface allowing the user to choose the region he would like to focus on and the weights he would give to the color, form and position aspects. On the right we see the result
240
B. Bouchon-Meunier et al.
a particular person (politician, sportsman,. . . ), the occurrence of an explosion, the fact that the segment has been recorded outside or inside a building, etc. Our approach consists in learning, from a set of examples, how to label a video signal, with high level features, in particular here the presence of a map on the screen. The TRECVID challenge is decomposed into 2 steps: a model has to be built according to a training set of video, and this model should enable the ranking of a set of test videos. The objective is to propose a ranking of all the segments of the test videos according to the presence of a given high level feature. Data The TRECVID challenge offers a video database in order to train and test each method. The data are composed of more than 200 video news (each of around 30 minutes length) that represent more than 100 hours of video data. Moreover, some additional data is proposed: a set of XML files that describes the cutting into shot of each video, the set of all of the image files representing keyframes, and the set of annotations files for development keyframes [1, 42]. Each keyframe is represented by two sets of numerical values, the Visual Information Descriptors and the Video Information Descriptors. The Visual Information Descriptors are obtained directly from the keyframes. To obtain visual spatial-related information from the keyframe, the image is cut into 5 pieces (see Fig. 7). Each piece corresponds to a spatial part of the keyframe: top, bottom, left, right, and middle. The five regions do not have the same size in order to reflect the importance of the contained information based on its position. Afterwards, for each region, the associated histogram in the HSV
Fig. 7. Spatial decomposition of a keyframe
Real-World Fuzzy Logic Applications
241
space was computed. Depending on the area of the region, the histogram is defined more or less precise (based on the number of bins): 6x3x3 for Middle, Top, and Bottom, 4x2x2 for Left and Right. At the end, a first set of numerical values (each one ranging from 0 to 1) is obtained that characterizes every keyframe: the Visual Information Descriptors. The Video Information Descriptors are obtained from the information associated with the video and given by means of the shot detection process. They correspond to the temporal information associated with the shot from which the keyframe was extracted. For a given keyframe, these descriptors are extracted from the XML file associated with a video and obtained from shot detection process. The XML tags associated with each shot enables us to obtain the following information for every keyframe: • • • •
the the the the
name of the keyframe and its kind timecode of the keyframe in the video timecode of the beginning of the shot containing the keyframe duration of the shot containing the keyframe
At the end, a second set of numerical values is obtained that characterizes the keyframe and the shot to which it belongs: the Video Information Descriptors. Finally, each keyframe is associated to a Class Descriptor, obtained from the indexation of the video. It corresponds to the feature(s) that should be associated with a shot. It is extracted from the file obtained from the (human) indexation process of the training videos. A keyframe can be associated with more than one feature depending on the result of the indexation process. The set of experiments that has been conducted this year focuses on the detection of the presence of a map in a segment. Method The method used in the NIST TRECVID’2005 evaluation task is based on the use of Fuzzy Decision Trees (see Sect. 2.2 and [13–15, 35]). For more details on the approach, please refer to [36]. First of all, a training set was constructed by means of a set of descriptors that can be extracted from the video data. It enabled us to obtain a classifier used afterwards to classify and rank the test keyframes. In order to use the FDT learning method, which is a supervised learning method, the training set must contain cases with the feature to be recognized and cases that do not possess that feature. Moreover, decision tree construction methods are based on the hypothesis that the value for the class is equally distributed. This hypothesis is not valid when considering the TRECVID’05 data set: for instance, for the Map feature, in the whole development set of indexed keyframes, there are 940 keyframes with the Map feature and 61273 keyframes without the Map feature. Thus, to have a valid training set for the construction of a fuzzy decision tree, the number of keyframes of each class have to be balanced. In our experiment, 900 keyframes with each class (with the Map
242
B. Bouchon-Meunier et al.
feature, or without the Map feature) have been selected in order to build a training set with 1800 keyframes. The Salammbˆ o software (see Sect. 2.2) was used to train and test the data. A cross validation was conducted, as follows: Step 1 The training set is composed of 900 keyframes with the Map feature and 900 keyframes without the Map feature. Each of these keyframes is randomly selected in the corresponding set of keyframes, Step 2 An evaluation set is composed using the rest of the keyframes (40 with the Map feature, and 60373 without the Map feature). Step 3 A FDT is constructed by means of the training set, and is used to classify the evaluation set (the presence of the feature for a keyframe is predicted by means of the FDT, and the result is compared with the indexation of this keyframe). These 3 steps are renewed 3 times in order to obtain several results, which are then averaged. The final FDT were obtained by using the whole set of training keyframes with the Map feature: Step 1 The training set is composed of 940 keyframes with the Map feature and 940 keyframes without the Map feature. The keyframes without the Map feature are randomly selected in the whole set of keyframes without the Map feature, Step 2 A FDT is constructed by means of the training set, and is used to classify the whole test set of keyframes from video 1 to video 140. As the random selection of a subset of 940 keyframes without the Map feature from the set of 61273 ones enables us to obtain several subsets, these 2 steps were renewed 5 times in order to obtain several runs. After the construction of the FDT as explained in Sect. 2.2, each FDT is used to classify the whole test set of keyframes. First of all, Visual Information Descriptors and Video Information Descriptors are extracted for all the keyframes from the test set. This enables us to obtain vectors of numerical data that can be classified with the FDT. By means of the classification, each keyframe e from the test set is associated with a membership degree FDeg(ce ) to the Map feature. At the end, each shot from the test video set is associated with a membership degree FDeg(ce ) of its keyframe e. All test shots can thus be ranked by means of these membership degrees. We assumed that the higher the membership degree, the more confident the FDT is of the presence of the feature in the shot. This ranking method is the one used for all runs submitted to TRECVID 2005. Results The global results obtained using extremely simple visual description and outof-the-box fuzzy decision tree software were encouraging. The use of this type
Real-World Fuzzy Logic Applications
243
of algorithm is a novelty on this kind of application. This approach provides classification rules which are human understandable, thus allowing further developments. The presented runs are an underestimation of what could be easily obtained. In fact, the FDT optimizes the classification of all the examples and not the ranking of the results. It appeared in the results below: 21 teams participated in the NIST TRECVID’2005 Challenge [1]. For the feature “Maps”, the results obtained by our approach were: • Average precision: 0.163 (range of the whole results: [0.001, 0.526], mean: 0.24). • Number of hits within the 100 first shots: 69 hits (range of the whole results: [0, 100], mean: 81). • Number of hits within the 1000 first shots: 411 hits (range of the whole results: [32, 897], mean: 491). • Number of hits within the 2000 first shots: 683 hits (range of the whole results: [49, 1095], mean: 651). Further developments on the adaptation of fuzzy decision trees to ranking problems (instead of just classification) are under study.
4 Conclusion Real world applications address a double challenge. On the one hand they are responses to specific problems with their specific constraints and on the other hand they have to build on solid and general theoretical foundations. In this paper we briefly present first two of these essential pillars: fuzzy comparison measures and fuzzy machine learning. Then, based on these two strongly interrelated bases, a set of applications in domains ranging from medical to educational but also chemical and multimedia domains illustrate specific solutions. All these applications focus on information retrieval or data mining, which are in fact, as we saw in this chapter, two components of a same challenge: the search or the extraction of information and knowledge from large amounts of data. For each of the presented solutions, we focused only on how the theory supported the application, ignoring a large set of other difficulties, appearing when dealing with real world challenges: as for instance technical issues, solutions for fast execution (essential in the case of large data sets), management of large data bases, corrupted data, etc. For more details on each of theses applications please refer to the corresponding publications. Finally, what makes all these applications unique is the use of fuzzy logic. In fact, their success is due, to some extent, to its capability to represent diverse types of data in a synthetic way, its robustness with regard to changes or noise, and obviously its unique expressiveness, crucial for the understanding of the results.
244
B. Bouchon-Meunier et al.
References 1. Guidelines for the TRECVID 2005 evaluation - National Institute of Standards and Technology, 2005. http://www-nlpir.nist.gov/projects/tv2005/tv2005.html. 2. J. Aczel. Entropies, characterizations, applications and some history. In Modern Information Processing, from Theory to applications. Elsevier, 2006. 3. J. Bezdek. Fuzzy mathematics in pattern classification. PhD thesis, Applied Mathematical Center, Cornell University, 1973. 4. J. Bezdek. Pattern Recognition with Fuzzy Objective Function Algorithm. Plenum, New York, 1981. 5. S. Bothorel, B. Bouchon-Meunier, and S. Muller. Fuzzy logic-based approach for semiological analysis of microcalcification in mammographic images. International Journal of Intelligent Systems, 12:814–843, 1997. 6. B. Bouchon-Meunier, M. Rifqi, and S. Bothorel. Towards general measures of comparison of objects. Fuzzy sets and systems, 84(2):143–153, 1996. 7. X. Boyen and L. Wehenkel. Automatic induction of fuzzy decision tree and its application to power system security assessment. Fuzzy Sets and Systems, 102(1):3–19, 1999. 8. L. Breiman, J.H. Friedman, R.A. Olshen, and C.J. Stone. Classification And Regression Trees. Chapman and Hall, New York, 1984. 9. W. E. Brugger and P. C. Jurs. Extraction of important molecular features of musk compounds using pattern recognition techniques. J. Agric. Food Chem., 25(5):1158–1164, 1977. 10. M. Chastrette, D. Zakarya, and J. P. Peyraud. Structure-musk odor relationships for tetralins and indans using neural networks. Eur. J. Med. Chem., 29:343–348, 1994. 11. K.J. Cios and L.M. Sztandera. Continuous ID3 algorithm with fuzzy entropy measures. In Proceedings of the first International IEEE Conference on Fuzzy Systems, San Diego, 1992. 12. R. Dav´e. Characterization and detection of noise in clustering. Pattern Recognition Letters, 12:657–664, 1991. 13. M. Detyniecki and C. Marsala. Fuzzy inductive learning for multimedia mining. In Proc. of the EUSFLAT’01 conference, pages 390–393, Leicester (UK), September 2001. 14. M. Detyniecki and C. Marsala. Fuzzy multimedia mining applied to video news. In Proc. of the 9th IPMU’00 Conf., pages 1001–1008, Annecy, France, July 2002. 15. M. Detyniecki and C. Marsala. Discovering knowledge for better video indexing based on colors. In Proc. of the Fuzz-IEEE’03 conference, pages 1177–1181, St Louis (USA), May 2003. 16. J.C. Dunn. A fuzzy relative of the isodata process and its use in detecting compact well-separated clusters. Journal of Cybernetics, 3:32–57, 1973. 17. M. Friedman, M. Ming, and A. Kandel. On the theory of typicality. International Journal of Uncertainty, Fuzzyness and Knowledge-Based Systems, 3(2):127–142, 1995. 18. E. Gustafson and W. Kessel. Fuzzy clustering with a fuzzy covariance matrix. In Proc. of IEEE CDC, pages 761–766, 1979. 19. F. H¨ oppner, F. Klawonn, R. Kruse, and T. Runkler. Fuzzy Cluster Analysis, Methods for classification, data analysis and image recognition. Wiley, 2000.
Real-World Fuzzy Logic Applications
245
20. E. H¨ ullermeier. Fuzzy methods in machine learning and data mining: Status and prospects. Fuzzy Sets and Systems, 156(3):387–406, 2005. 21. A. Jain, M. Murty, and P. Flynn. Data clustering: a review. ACM Computing survey, 31(3):264–323, 1999. 22. C.Z. Janikow. Fuzzy decision trees: Issues and methods. IEEE Transactions on Systems, Man and Cybernetics, 28(1):1–14, 1998. 23. F. Klawonn. Understanding the membership degrees in fuzzy clustering. In Proc. of the 29th Annual Conference of the German Classification Society, GfKl 2005, pages 446–454. Springer, 2006. 24. F. Klawonn, R. Kruse, and H. Timm. Fuzzy shell cluster analysis. In Learning, networks and statistics, pages 105–120. Springer, 1997. 25. G. Klopman and D. Ptchelintsev. Application of the computer automated structure evaluation methodology to a QSAR study of chemoreception- aromatic musky odorants. J. Agric. Food Chem., 40:2244–2251, 1992. 26. R. Krishnapuram and J. Keller. A possibilistic approach to clustering. IEEE Transactions on fuzzy systems, 1:98–110, 1993. 27. M.-J. Lesot. Kernel-based outlier preserving clustering with representativity coefficients. In B. Bouchon-Meunier, G. Coletti, and R. Yager, editors, Modern Information Processing: From Theory to Applications, pages 183–194. Elsevier, 2005. 28. M.-J. Lesot and B. Bouchon-Meunier. Cluster characterization through a representativity measure. In Proc. of Flexible Query Answering Systems, FQAS’04, pages 446–458. Springer, 2004. 29. M.-J. Lesot and B. Bouchon-Meunier. Descriptive concept extraction with exceptions by hybrid clustering. In Proc. of the IEEE Int. Conf. on Fuzzy Systems, Fuzz-IEEE’04, pages 389–394. IEEE Press, 2004. 30. M.-J. Lesot, L. Mouillet, and B. Bouchon-Meunier. Fuzzy prototypes based on typicality degrees. In Proc. of the 8th Fuzzy Days 2004, pages 125–138. Springer, 2005. 31. A. Lurie, C. Marsala, S. Hartley, B. Bouchon-Meunier, F. Guillemin, and D. Dusser. Patients’ perception of asthma severity. (to be published). 32. C. Marsala. Fuzzy partitioning methods. In W. Pedrycz, editor, Granular Computing: an Emerging Paradigm, Studies in Fuzziness and Soft Computing, pages 163–186. Springer-Verlag, 2001. 33. C. Marsala and B. Bouchon-Meunier. An adaptable system to construct fuzzy decision trees. In Proc. of the NAFIPS’99 (North American Fuzzy Information Processing Society), pages 223–227, New York, USA, June 1999. 34. C. Marsala, B. Bouchon-Meunier, and A. Ramer. Hierarchical model for discrimination measures. In Proc. of the IFSA’99 World Congress, pages 339–343, Taiwan, 1999. 35. C. Marsala and M. Detyniecki. Fuzzy data mining for video. In Proc. of the EUSFLAT’03 conference, pages 73–78, Zittau, (Germany), September 2003. 36. C. Marsala and M. Detyniecki. University of Paris 6 at TRECVID 2005: Highlevel feature extraction. In TREC Video Retrieval Evaluation Online Proceedings, 2005. http://www-nlpir.nist.gov/projects/tvpubs/tv.pubs.org.html. 37. C. Marsala, M. Ramdani, D. Zakaria, and M. Toullabi. Fuzzy decision trees to extract features of odorous molecules. In B. Bouchon-Meunier, R.R. Yager, and L.A. Zadeh, editors, Uncertainty in Intelligent and Information Systems, volume 20 of Advances in Fuzzy Systems - Applications and Theory, pages 235–249. World Scientific, 2000.
246
B. Bouchon-Meunier et al.
38. C. Olaru and L. Wehenkel. A complete fuzzy decision tree technique. Fuzzy Sets and Systems, 138(2):221–254, 2003. 39. J.-F. Omhover and M. Detyniecki. Combining text and image retrieval. In Proceedings of the EUROFUSE Workshop on Data and Knowledge Engineering, pages 388–398, 2004. 40. J.-F. Omhover, M. Detyniecki, and B. Bouchon-Meunier. A region-similaritybased image retrieval system,. In B. Bouchon-Meunier, G. Coletti, and R. Yager, editors, Modern Information Processing: From Theory to Applications. Elsevier, 2005. 41. J.-F. Omhover, M. Detyniecki, M. Rifqi, and B. Bouchon-Meunier. Image retrieval using fuzzy similarity: measure equivalence based on invariance in ranking. In Proc. of the IEEE Int. Conf. on Fuzzy Systems - Fuzz-IEEE’04, pages 1367–1372, 2004. 42. C. Petersohn. Fraunhofer HHI at TRECVID 2004: Shot boundary detection system. Technical report, TREC Video Retrieval Evaluation Online Proceedings, TRECVID, 2004. URL: www-nlpir.nist.gov/projects/tvpubs/ tvpapers04/fraunhofer.pdf. 43. J. Ross Quinlan. Induction of decision trees. Machine Learning, 1(1):86–106, 1986. 44. M. Ramdani. Une approche floue pour traiter les valeurs num´eriques en apprentissage. In Journ´ees Francophones d’apprentissage et d’explication des connaissances, 1992. 45. A. Rick, S. Bothorel, B. Bouchon-Meunier, S. Muller, and M. Rifqi. Fuzzy techniques in mammographic image processing. In Etienne Kerre and Mike Nachtegael, editors, Fuzzy Techniques in Image Processing, Studies in Fuzziness and Soft Computing, pages 308–336. Springer Verlag, 2000. 46. M. Rifqi. Constructing prototypes from large databases. In Proc. of IPMU’96, 1996. 47. M. Rifqi. Mesure de comparaison, typicalit´ e et classification d’objets flous : th´eorie et pratique. PhD thesis, Universit´e de Paris VI, 1996. 48. E. Rosch. Principles of categorization. In E. Rosch and B. Lloyd, editors, Cognition and categorization, pages 27–48. Lawrence Erlbaum associates, 1978. 49. E. Rosch and C. Mervis. Family resemblance: studies of the internal structure of categories. Cognitive psychology, 7:573–605, 1975. 50. E. Ruspini. A new approach to clustering. Information control, 1(15):22–32, 1969. 51. K.O. Schnabel, H.D. Belitz, and C. Ranson. Untersuchungen zur StrukturActivit¨ at-Beziehung bei Geruchsstoffen. Z. Lebensm Unters Forsch, 187: 215–233, 1988. 52. A. Tversky. Features of similarity. Psychological Review, 84:327–352, 1977. 53. X. Wang, B. Chen, G. Qian, and F. Ye. On the optimization of fuzzy decision trees. Fuzzy Sets and Systems, 112(1):117–125, May 2000. 54. R. Weber. Fuzzy-ID3: A class of methods for automatic knowledge acquisition. In IIZUKA’92 Proceedings of the 2nd International Conference on Fuzzy Logic, pages 265–268, 1992. 55. Z. Wu, W. Xie, and J. Yu. Fuzzy c-means clustering algorithm based on kernel method. In Proc. of ICCIMA’03, pages 1–6, 2003. 56. Y. Yuan and M.J. Shaw. Induction of fuzzy decision trees. Fuzzy Sets and systems, 69:125–139, 1995.
Real-World Fuzzy Logic Applications
247
57. L.A. Zadeh. A note on prototype theory and fuzzy sets. Cognition, 12:291–297, 1982. 58. D. Zakarya. Use of autocorrelation components and Wiener index in the evaluation of the odor threshold of aliphatic alcohols. New J. Chem., 16:1039–1042, 1992. 59. D. Zakarya, M. Chastrette, M. Tollabi, and S. Fkih-Tetouani. Structurecamphor odor relationships using the generation and selection of pertinent descriptors approach. Chemometrics and Intelligent Laboratory Systems, 48: 35–46, 1999.