RECOGNIZING EMOTION IN SPEECH USING NEURAL NETWORKS Keshi Dai1, Harriet J. Fell1, and Joel MacAuslan2 College of Computer and Information Science, Northeastern University, Boston, MA, USA1 Speech Technology and Applied Research, Bedford, MA, USA2 Email: [daikeshi, fell]@ccs.neu.edu1,
[email protected]
ABSTRACT Emotion recognition is an important factor of affective computing and has potential use in assistive technologies. In this paper we used landmark and other acoustic features to recognize different emotional states in speech. We analyzed 2442 utterances from the Emotional Prosody Speech and Transcripts corpus and extracted 62 features from each utterance. A neural network classifier was built to recognize different emotional states of these utterances. We obtained over 90% accuracy in distinguishing hot anger and neutral states, over 80% accuracy in distinguishing happy and sadness as well as in distinguishing hot anger and cold anger. We also achieved 62% and 49% accuracy for classifying 4 and 6 emotions respectively. We had 20% accuracy in classifying all 15 emotions in the corpus which is a large improvement over other studies. We plan to apply our work to developing a tool to help people who have difficulty in identifying emotion. KEY WORDS Voice recognition software, emotion recognition, speech landmarks, neural networks
1. Introduction Affective computing is a field of research that deals with recognizing, interpreting and processing emotions or other affective phenomena. It plays an increasingly important role in assistive technologies. With the help of affective computing, computers are no longer indifferent logical machines. They may be capable of understanding a user’s feelings, needs, and wants and giving feedback in a manner that is much easier for users to accept. Emotion recognition is an essential component in affective computing. In daily communication, identifying emotion in speech is a key to deciphering the underlying intention of the speaker. Computers with the ability to recognize different emotional states could help people who have difficulties in understanding and identifying emotions. We plan to apply the work in this study to the development of such a tool.
of them [1, 2, 3, 4, 5] used acoustic features such as Melfrequency cepstral coefficients (MFCCs) and fundamental frequency (pitch) to detect emotional cues, while other studies [6, 7] employed prosodic features in speech to achieve higher accuracy of the classification. Various classifiers were applied to recognizing emotions, Hidden Markov Models (HMM) in [1, 3, 6], Naïve Bayes classifier in [2], and decision tree classifier in [5, 7]. In addition, studies [8, 9] used same data that we used in this paper. In [9], 75% accuracy was achieved for classifying two emotional categories (negative and positive). The studies in [8] were mostly comparing neutral with a single other emotional state. Their best result was 90% accuracy in distinguishing hot anger and neutral. They also did an experiment of classifying all 15 emotions but achieved only 8.7% accuracy. Our emotion recognition is speaker and speech-content independent, and does not use any linguistic knowledge. The classification performance largely relies on the kind of features we can extract. In this paper, apart from basic acoustic and prosody features, we also used landmark features as described in [10]. Landmark features have already proved to be a good cue to identify emotional stress in speech [11]. We have built an automatic emotion classifier by using neural networks and tested it on various emotional utterances extracted from the Prosody Speech and Transcripts corpus. We did several experiments comparing pairs of emotional states as well as experiments classifying 4, 6, or all 15 states.
2. Feature Extraction We first find landmarks in the acoustic signal and then use them to extract other features. A total of 62 features are extracted from each utterance, including 12 landmark features like the number of each landmark type and voice onset time, 11 syllable features such as syllable rate and syllable duration, 21 timing features including unvoiced duration and voiced duration, 7 pitch features, and 11 energy features. 2.1 Landmarks
Many studies have been conducted in an attempt to automatically determine emotional states in speech. Some
Before extracting features from the speech signal, our
landmark detector was used. It is based on Liu-Stevens landmark theory [10]. Essential to this theory are landmarks, pinpointing the abrupt spectral changes in an utterance, which mark perceptual foci and articulatory targets. Listeners often focus on landmarks to obtain acoustic cues necessary for understanding the distinctive features in the speech.
•
Voice Onset Time: the distance between +b and +g, which is the time between when a consonant is released and when the vibration of the vocal folds begins.
•
Landmark rate: the rate of each landmark type in an utterance.
In this work, we use three types of landmarks: •
2.2 Syllables Glottis (+g/-g): marks a time when glottal vibration turns on or off.
•
Sonorant (+s/-s): marks a sonorant consonantal closure or release that only happens in voiced parts of speech.
•
Burst (+b/-b): marks an affricate or aspirated stop burst or closure that only happens in unvoiced parts of speech. they enjoy it when i audition
Using our automatic syllable detector, we have extracted 4 types of syllable features that are important prosodic cues for deciphering the underlying emotion in speech.
0.4 0.3 +b
+s
-s +b
-s
-s
+b
+b
-b
A syllable is a unit of sound, and is typically made up of a vowel with optional initial and final margins. A sequence of detected landmarks can be considered as a translated signal. In our syllable detector, finding syllables is based on the order and spacing of detected landmarks. A syllable must contain a voiced segment of sufficient length. 38 possible syllables were recognized. 11 syllables begin with +g landmark, 22 begin with +b/-b, and 5 begin with +s.
-b
0.2
In syllable level, we are interested in 4 types of features:
0.1 0 -0.1 +g
-0.2
-g +g
-g +g
they
-0.3
-g +g
it enjoy
0
i when
0.5
audition 1
1.5
Syllable rate: the rate of syllable in an utterance
•
Syllable number: the number of each syllable type
•
Landmarks per syllable: the number of landmarks in each syllable
•
Syllable duration: the mean, minimum, maximum, and the standard deviation of the duration of each syllable.
2
8000 Frequency
• -g +g -g
6000 4000 2000 0 0.2
0.4
0.6
0.8
1
1.2 Time
1.4
1.6
1.8
2
2.2
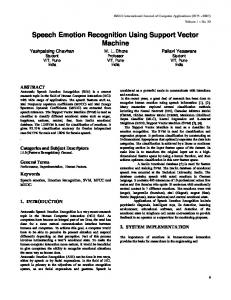
Figure 1: Landmark plot produced by our landmark detector
2.3 Other Features In Figure 1, we can see that the regions between +g and -g are voiced regions. While +s/-s landmarks only happen in voiced regions, +b/-b landmarks only appear in unvoiced region. In the spectrogram, the energy of the fundamental frequency in voiced region is the strongest. The +s landmark happens when there is an increase in energy from the Bands 2 (0.8-1.5 kHz) to Bands 5 (3.5-5.0 kHz) and the –s landmark signifies energy decrease in these frequency bands. A +b landmark is detected when a silence interval is followed by a sharp energy increase in high frequency from Bands 3 (1.2-2.0 kHz) to Bands 6 (5.0-8.0 kHz). On the contrary, a –b landmark signifies a sharp energy decrease in high frequency followed by a silence interval. We used three measurements relating to landmarks. They are: •
Landmarks per word and landmarks per utterance.
Some other basic acoustic and prosodic features were also extracted. They can be divided into 3 types: timing features, pitch features, and energy features. 2.3.1 Timing We extracted a set of timing features, which display prosodic characteristics of the utterance. •
Voiced duration: the mean, minimum, maximum, the standard deviation of the voiced duration.
•
Unvoiced duration: the mean, minimum, maximum, the standard deviation of the unvoiced duration.
•
The ratio of the voiced duration and the unvoiced duration.
•
The ratio of the voiced duration and the duration of the corresponding utterance.
•
The ratio of the unvoiced duration and the duration of the corresponding utterance.
2.3.2 Pitch Pitch is the perceptual correlate of the fundamental frequency (F0) of voice. We extract the pitch contour from voiced regions in every utterance. The following are features relating to pitch. •
Pitch contour: 10 percentile, 50 percentile, and 90 percentile values.
•
Pitch statistic information: mean, minimum, maximum, the standard deviation of the pitch
•
Emotion
Pitch slope: the slope between the 10 percentile and 50 percentile values, the slope between the 10 percentile and 90 percentile values, and the slope between the 50 percentile and 90 percentile values.
2.3.3 Energy We calculate the energy value from the first derivatives of the smoothed speech signal instead of the absolute value of signal amplitude in order to remove the influence of the loudness. From the energy, we obtain following features: •
Energy contour: 10 percentile, 50 percentile, and 90 percentile values.
•
Energy statistic information: mean, minimum, maximum, the standard deviation of the energy
•
For our experiment, we extracted all 4-syllable utterances from the recordings according to the time alignment files. All processing and analysis were based on the left channel of the recording signal. We have restricted this study to 7 actor participants (3 males: CC, MF, CL; 4 females: JG, GG, MM, MK) and primarily on 6 emotional states: neutral, hot anger, happy, sadness, interest, and panic. CL, MF, and MK read the script A, and CC, GG, JG, and MM read script B. Two scripts have different words for each emotion type. In the recording, actors were allowed to repeat the emotional phrase on the script for a few times, so the number of utterances for different speakers varies. Table 1 shows the number of utterances for each emotional state and speaker we used in our experiment.
Energy slope: the slope between the 10 percentile and 50 percentile values, the slope between the 10 percentile and 90 percentile values, and the slope between the 50 percentile and 90 percentile values.
3. Data We are mainly using 6 types of emotional speech from the Emotional Prosody Speech and Transcripts corpus (LDC2002S28) [12]. This corpus contains 15 audio recordings of 8 professional actors (5 female, 3 male) reading 4-syllable semantically neutral utterances (dates and numbers, e.g., “December first”, “Nine thousand two”) spanning 15 distinct emotional categories: neutral, disgust, panic, anxiety, hot anger, cold anger, despair, sadness, elation, happy, interest, boredom, shame, pride, and contempt. The utterances were recorded directly into WAVES+ data files, on 2 channels with a sampling rate of 22.05 KHz.
happy
sadness
hot anger
neutral
interest
panic
CL
24
17
14
19
26
21
MF
25
21
22
10
19
12
MK
42
22
22
8
44
21
CC
24
17
14
19
17
18
GG
30
33
22
9
30
27
JG
20
19
18
8
20
14
MM
19
23
16
9
21
32
Speaker
Table 1: The number of utterances used in our experiment
4. Experiment and Results 4.1 Classifier In this work, we used a neural network classifier from the MATLAB Neural Network Toolbox. The network used in our experiment was composed of 3 layers: the input layer, the hidden layer, and the output layer. The input layer takes the 62 feature values for each utterance. Input features were normalized to values in the range of -1 to 1. The hidden layer has 20 nodes, and uses a sigmoid transfer function. The number of nodes in the output layer depends on how many emotional categories to recognize. We use a resilient backpropagation training algorithm in the network. The advantage of this training algorithm is that it can eliminate harmful effects of the magnitudes of the partial derivatives. Only the sign of the derivative determines the direction of the weight update. The size of the weight change is determined by a separate update value. The update value for each weight and bias is increased whenever the derivative of the performance function with respect to that weight has the same sign for two successive iterations. The update value is decreased
whenever the derivative with respect to that weight changes sign from the previous iteration. 4.2 Training, Validation and Testing Data Because the corpus used in our experiment is relatively small, a 10-fold cross validation technique was applied to increase the reliability of the results. We split the data into ten sets; eight of which are used in the training session, the ninth for the validation and the tenth for the testing. We repeat 10 times and use different one-tenth subsets of the data for testing and take a mean accuracy. The validation data used in training is to prevent overfitting. The training, test and validation data sets are mutually exclusive in each run.
181 happy utterances and 121 out of 162 sadness utterances were detected correctly. We also found that more sadness utterances were misrecognized than happy utterances. Output happy
sadness
happy
155
26
sadness
41
121
Input
Table 3: The result of recognizing happy and sadness
The results of each test are illustrated in Figure 3. The accuracy of recognizing happy and sadness is 80.46%.
4.3 Recognizing Two Emotional States
1 0.9 0.8 0.7 0.6 Accuracy
In the first experiment, we attempted to distinguish two emotional types. We used all 62 features and a three-layer neural network with 20 nodes in the hidden layer to distinguish hot anger from neutral, which is considered as the easiest classification task. The testing result is shown in Table 2. 140 utterances labelled as hot anger and 80 utterances labelled as neutral were tested. 128 hot anger utterances and 72 neutral utterances are classified correctly.
0.5 0.4 0.3 0.2 0.1
Output hot anger
neutral
hot anger
128
12
neutral
8
72
0
1
Input
2
3
4
5 6 Test number
7
8
9
10
Figure 3: 10 testing results of recognizing happy and sadness
4.4 Recognizing More Emotions
Table 2: The result of recognizing hot anger and neutral
From the results of each test (Figure 2), we can see the classification performance is stable, and the average accuracy is 90.91% 1
In this experiment, we study the recognition of more emotions. We have performed two experiments, one to recognize 4 emotions and one to recognize 6 emotions. The emotions are happy, sadness, hot anger, neutral, interest, and panic. Tables 4 and 5 list the corresponding classification results.
Accuracy
0.9 0.8
Output
0.7
Input
0.6 0.5
happy
sadness
hot anger
neutral
happy
108
22
40
11
sadness
41
97
5
19
hot anger
28
6
106
0
neutral
11
29
0
40
0.4 0.3 0.2 0.1 0
Table 4: The result of recognizing 4 emotions 1
2
3
4
5 6 Test number
7
8
9
10
Figure 2: 10 testing results of recognizing hot anger and neutral
We then performed another experiment to identify happy and sadness emotions. As shown in Table 3, 155 out of
The accuracy of recognizing 4 and 6 emotions is 62%, and 49% respectively. We can see that the classification accuracy decreases with the increase of emotional categories.
happy
sadness
hot anger
neutral
interest
panic
happy
67
12
35
8
30
29
sadness
21
94
4
8
34
1
We also studied the classification performance on emotion intensity. Cold anger and hot anger are in the same emotional category. The only difference between them is emotion intensity, which can be seen as the extent to which speakers express emotion. Our accuracy of classifying these two emotional types is 82.4%.
hot anger
26
3
81
0
8
22
4.7 The Importance of Landmark Features
neutral
7
28
1
28
15
1
interest
20
34
9
7
96
11
panic
13
2
39
2
22
67
Output Input
Table 5: The result of recognizing 6 emotions
In this experiment, we study the importance of landmark features in emotion recognition. We compared the performance of recognizing 4 and 6 emotions with analyzing all features and the performance without analyzing landmark features. Results are shown in Table 7. We can see that landmark features improve the performance of classification.
4.5 Recognizing Confusing Pairs From Table 4 and 5, we can see that there are several pairs of emotions that are mutually confusing. For instance, happy utterances were easily confused with hot anger by our classifier. The same applies to happy and interest, happy and panic, interest and sadness, panic and hot anger. Similar results were reported in [8]. We also trained 5 classifiers to identify these 5 difficult pairs of emotions. Results are in Table 6. Accuracies are relatively low compared to the classification outcome of hot anger and neutral or happy and sadness pair.
with landmark features
without landmark features
4 emotions
62.30%
59.84%
6 emotions
48.95%
47.80%
Table 7: Recognizing with or without landmark features
4.8 Recognizing 15 Emotions In the last experiment, we tested the classification performance on all 2442 utterances with 15 emotions in the corpus. We still employed the 10-fold cross validation technique, using different 10% of the data to test and the rest 90% to train at each time. The average accuracy of recognizing 15 emotions is 19.27%, representing a 12.60% improvement over chance performance.
Emotion pair
Accuracy
happy and interest
77.31%
happy and hot anger
74.72%
panic and hot anger
72.64%
happy and panic
72.46%
5. Conclusion and Discussion
interest and sadness
71.04%
Within this paper we combine basic acoustic features and prosodic features with our landmark and syllable features to recognize different emotional states in speech. We analyzed 2442 utterances extracted from the Emotional Prosody Speech and Transcripts corpus. A total of 62 features were calculated from each utterance. A neural network classifier was applied to this work and the 10fold technique was employed to evaluate the classification performance.
Table 6: Recognizing emotion pairs
Hot anger and neutral is the easiest pair to recognize. In Table 5, they are mutually exclusive. Happy is the most difficult emotional type to recognize according to this experiment. It is confused with three other emotions: hot anger, interest, and panic. Besides, here is a very interesting result. Happy and interest as well as interest and sadness both are confusing pairs, but the classification performance on happy and sadness is not bad. It is because these three pairs do not share the same type of confusing features. We found that timing features are the main factors to bewilder the classifier when it classifies interest and sadness, but the key confusing features are largely relating to energy and pitch for happy and interest pair. 4.6 Recognizing Cold Anger and Hot Anger
Based on our experiment, over 90% accuracy can be achieved for recognizing hot anger and neutral, over 80% accuracy for identifying happy and sadness, and over 62% and about 49% accuracy for classifying 4 and 6 emotions respectively. In addition, emotions with different intensity like cold anger and hot anger can be also recognized with over 80% accuracy. We also found that there exist several confusing emotion pairs such as happy and interest, happy and panic, interest and sadness, panic and hot anger. The accuracy of
classifying these pairs was relatively low due to the limitation of emotion representing ability of current features. Emotion composition and how to extract more distinctive features for different types of emotions should be studied in the future.
Annoyance and Frustration in Human-Computer Dialog, Proc. ICSLP, Denver, Colorado, USA, 2002, 2037-2040. [8] S. Yacoub, S. Simske, X. Lin, & J. Burns, Recognition of Emotions in Interactive Voice Response Systems, Proc. European Conference on Speech Communication and Technology, Geneva, Switzerland, 2003, 729-732.
6. Future Work The purpose of this work is to study the emotion recognition method and its performance. Based on this study, we plan to develop an automatic emotion recognizer, which can help people who have difficulties in understanding and identifying emotions to improve their social and interaction skills. Research [13, 14, 15, 16, 17, 18] found people with autism had more difficulties in social emotion understanding if the emotion was not explicitly named. On the other hand, they have a desire to be socially involved with their peers. Such an assistive emotion recognition tool might help people with autism to study and practice social interactions.
References [1] C. M. Lee, S. Yildirim, M. Bulut, A. Kazemzadeh, C. Busso, Z. Deng, S. Lee, & S. Narayanan, Emotion recognition based on phoneme classes, Proc. ICSLP, Jeju, Korea, 2004, 889-892. [2] T. Vogt & E. André, Improving Automatic Emotion Recognition from Speech via Gender Differentiation, Proc. Language Resources and Evaluation Conference, Genoa, Italy, 2006, 1123-1126. [3] D. Jiang & L. Cai, Speech Emotion Classification with the Combination of Statistic Features and Temporal Features, Proc. IEEE International Conference on multimedia, Taipei , Taiwan, China, 2004, 1967-1970. [4] B. Schuller, S. Reiter, R. Muller, M. Al-Hames, M. Lang, & G. Rigoll, Speaker Independent Speech Emotion Recognition by Ensemble Classification, Proc. IEEE International Conference on Multimedia and Expo, Amsterdam, the Netherlands, 2005, 864-867. [5] M. Kurematsu, J. Hakura, & H. Fujita, The Framework of the Speech Communication System with Emotion Processing, Proc. WSEAS International Conference on Artificial Intelligence, Knowledge Engineering and Data Bases, Corfu Island, Greece, 2007, 46-52. [6] F. Dellaert, T. Polzin, & A. Waibel, Recognizing Emotion in Speech, Proc. ICSLP, Philadelphia, PA, USA, 1996, 1970-1973. [7] J. Ang, R. Dhillon, A. Krupski, E. Shriberg, & A. Stolcke, Prosody-Based Automatic Detection of
[9] J. Liscombe, Detecting Emotion in Speech: Experiments in Three Domains. Proc. HLT/NAACL, New York, NY, USA, 2006, 231-234. [10] S. Liu, Landmark detection of distinctive featurebased speech recognition. Journal of the Acoustical Society of America, 100(5), 1996, 3417-3430. [11] H.J. Fell & J. MacAuslan, Automatic Detection of Stress in Speech, Proc. of MAVEBA, Florence, Italy, 2003, 9-12. [12] Linguistic Data Consortium, “Emotional Prosody Speech“,www.ldc.upenn.edu/Catalog/CatalogEntry.jsp?c atalogId=LDC2002S28, University of Pennsylvania. [13] R.P. Hobson, The autistic child's appraisal of expressions of emotion. Journal of Child Psychology and Psychiatry, 27, 1986, 321-342. [14] R.P. Hobson, The autistic child's appraisal of expressions of emotion: A further study. Journal of Child Psychology and Psychiatry, 27, 1986, 321-342. [15] D. Tantam, L. Monaghan, H. Nicholson, & J. Stirling (1989). Autistic children's ability to interpret faces: A research note. Journal of Child Psychology and Psychiatry, 30, 1989, 623-630. [16] K.A. Loveland, B. TUNALI-KOTOSKI, Y.R. Chen, J. Ortegon, D.A. Pearson, K.A. Brelsford, & M.C. Gibbs, Emotion recognition in autism: Verbal and nonverbal information, Development and Psychopathology, 9(3), 1997, 579-593. [17] A.L. Bacon, D. Fein, R. Morris, L. Waterhouse, & D. Allen, The responses of autistic children to the distress of others. Journal of Autism and Development Disorders, 28, 1998, 129–142. [18] M. Sigman, & E. Ruskin, Continuity and change in the social competence of children with autism, Downs syndrome, and developmental delays. Monographs of the Society for Research in Child Development, 64 (1, Serial No. 256), 1999.