Reference List
\mire\\. D.L. Lenore. S.C .. Eugene. W.R .. Arnold. LCJ .. 2005. ·standard Method for tk 1.:-.:amination of \Vater and \\astewater.· 21 ' 1 Edition. American Public Health \sstlciation. \\"ashington.
lh.:~. \.li .. Okuda. 1.. ~ishijima. \\ .. Shoto. L... Okada. \1.. 1997. ·Adsorption and ion L'\:change of some ground\\ater anion contaminants in amine modified coconut coir·. II utcr ,\'cience & Technology .. voi.J5. p. 89-95.
J)incsh. M .. Singh. K. P. and Singh. V. K .. 2005. ·Jri\alent Chromium removal fi·om using lm\ cost acti\atcd carbon deri\ed rrom agricultural \\aste and ~tL'li\ a ted carbon bbric cloth.·. Journul o/Hccurdon1 \luteriul. Elsevier. India. \\~hlL'\\illcr
1.1 Nemr. A. A. K .. Ola. A .. and Amany. E. S .. 2007. "Treatment of \vastewater containing toxic Chromium using new activated carbon developed ii·om date palm SL'L'd.' . .!oumul o/Hccwdous .\lolcriul. Vol. 152:1 . p. 26:1-275. Else\ ier. India.
I 11\ ironmental Protection Agency (EPA). 1998. Human I lealth ract Sheet: Chromium. 111 \\\\\\ -crc.J:lrc. \ ic\\ eel on the 15 January 2005.
rent initial chromium concentration at pH -UJ for bare PAC
I
PAC g/L
Initial cr• 6/ ppm
NaN03 mole/L
pH
Remaining total Chromium /ppm
1
5.0
20.0
0.01
4.0
0.844
i
Sample No
i
i
13
I
4
r~\p!'rimental
I:'
5.0
40.0
0.01
4.0
9.729
30.271
5.0
80.0
0.01
4.0
34.590
45.410
4
5.0
120.0
0.01
4.0
64.578
55.422
5
5.0
160.0
0.01
4.0
87.805
72.195
6
5.0
200.0
0.01
4.0
108.939
91.061
Experimental Results ojdifferent pH ofthe solution at O.Or\1 ionic strengtlzjiJr HA treated PAC
Sample No
PAC lg/L
HA/ ppm
NaN03 mole/L
pH
Remaining total Chromium/ ppm
1
5.00
100.0
0.01
20.0
2.35
1.706
18.294
91.47
2
5.00
100.0
0.01
20.0
3.48
1.332
18.668
93.34
I
!
19.156
2
I
'
Adsorbed total Chromium/ ppm
3
I
I
Adsorbed total Chromium/ ppm
PAC g/L
Sample No
rI
I
I
remaining total Chromium /ppm
i
Initial cr·•, ppm
Adsorb total Chromium I ppm
Cr removal
%
3
5.00
100.0
0.01
20.0
5.45
1.456
18.544
92.72
4
5.00
1000
0.01
20.0
6.89
5.93
14.07
70.35
5
5.00
100 0
0.01
20.0
8.7
13.11
6.89
34.45
6
5.00
100.0
0.01
20.0
9.59
17.278
2.722
13.61
7
5.00
100.0
0.01
20.0
10.20
19.102
0.898
4.49
47
LY:perimental Results ofdijJerent pH ofthe solution at 0.001 lvf ionic strength for HA treated PAC
I -1.
I
II Sample I
i I
pH
Remaining total Chromium/ ppm
100 0
0.001
i
20.0
2.35
0.322
9.6780
100 0
0.001
'
20.0
3.48
0.012
9.9876
0.001
20.0
5.45
0.138
9.8625
0.001
20.0
6.89
0.252
9.7484
i
I
No
i
PAC /g/L
1
i
5.0
r
2
5.0
~
3
5.0
4
5.0
100.0
i
100.0
cr• 6t
NaN03 mole/L
I HA/ ppm i
Initial
I
i I
ppm
! I i
!
'
Adsorb total Chromium I ppm
Cr removal % 96.78 99.88
i
98.63 97.48
5
5.0
100 0
0.001
20.0
8.7
0.490
9.5104
95.10
6
5.0
100.0
0.001
20.0
9.59
0.795
9.2055
9206
7
5.0
100 0
0.001
20.0
10.2
0.959
9 0406
90.41
Experimental Results of d1jJerent contact time oj' the solution for HA treated PAC with initial Cr (i'l) 20J!
I 5.
mg/L
I I
Sample No
1--
I I
Initial Cr. ppm
6
NaN03 mole/L
Remaining total Chromium I ppm
Adsorbed total Chromium/ ppm
Cr removal %
PAC g/L
HA/ ppm
1 2
5.0
100.0
20.0
0.01
5
8.7028
11.30
56.49
5.0
100.0
20.0
0.01
30
7.2252
12.77
63.87
/
Time/min
3
5.0
100.0
20.0
0.01
60
5.88058
14.12
70.60
4
5.0
100.0
20.0
0.01
90
4.4773
15 0557
77.61
5
5.0
100.0
20.0
0.01
120
4.601
15.1455
77.00
6
5.0
100.0
20.0
0.01
150
5.462
15.1546
72.69
7
5.0
100.0
20.0
0.01
180
5.462
15.1545
72.69
8 9
5.0
100 0
20.0
0.01
210
5.461
15.44
72.69
5.0
100.0
20.0
0.01
1440
5.462
15.44
72.69
Experimental Results oj' different contact time of the solution for IIA treated PAC with initial Cr {I'I) 50.0
I (J
mg/L
Sample No
1
-
NaN03 mole/L
Time/min
Remaining Total Chromium I ppm
Adsorbed Total Chromium/ ppm
Cr removal %
PAC g/L
HA/ppm
Initial cr· 6 / ppm
5.0
100 0
50.0
0.01
5
21.7475
28.2525
56.505
30
17.0795
32.9205
65.841
2
5.0
100.0
50.0
0.01
3
5.0
100.0
50.0
0.01
60
15.696
34.304
68.608
4 5
5.0
100.0
50.0
0.01
90
12.4375
37.5625
75.125
5.0
100 0
50.0
0.01
120
11.4975
38.5025
77.00
6
5.0
100 0
50.0
0.01
150
11 1744
38.8256
77.65
7
5.0
100.0
50.0
0.01
180
11.1745
38.8255
77.65
8 9
5.0
100 0
50.0
0.01
210
11 1746
38.8254
77.65
5.0
100 0
50.0
0.01
1440
11.1744
- _38.8256
77.65
48
1-
t\paimental Rn·u/ts a( different contact time a(the solution/or HA treated PAC with initial Cr (I'!) 80.0 mgL
!
I
Sample No
1
I r-
' i
I
L.
18.
J
PAC g/L
I
I
Initial cr• ppm
HA/ppm
5.0
100.0
2[
5.0
100.0
3
5.0
4
!
80.0 80.0
i
6
/
i
NaN OJ mole/L
Time/min
Remaining total Chromium I ppm
i
0.01
5
34.242
45.758
57.1975
0.01
30
i
24.2245
55.7755
69.71938
0.01
60
i
21.0455
58.9545
73.69313
I I I
Adsorbed total Chromium/ ppm
Cr removal %
100.0
80.0
5.0
1000
80.0
0.01
90
18.0465
61.9535
77.44188
5
5.0
100.0
80.0
0.01
120
15.6945
64.3055
80.38188
6
5.0
100 0
80.0
0.01
150
12.6925
67.3075
84.13438
6 6 6
5.0
100 0
80.0
0.01
180
12.6925
67.3075
84.13438
5.0
1000
80.0
0.01
210
12.692
67.3080
84.135
5.0
100 0
80.0
0.01
12.692
67.3080
84.135
I
1440
I
Experiment results of different initial Cr (VI) concentration at pH .f.(}
PAC g/1
HA/ ppm
initial cr· 6/ ppm
NaNOJ/ mole/1
pH
remaining total Chromium I ppm
1
5.0
100 0
20.0
0.01
4.0
0.397
19.603 31.720
I I
Sample No
Adsorbed total Chromium/ ppm
2
5.0
100 0
40.0
0.01
4.0
8.280
3
5.0
100.0
80.0
0.01
4.0
25.354
54.646
4
5.0
100.0
120.0
0.01
4.0
48.564
71.436
5
5.0
100.0
160.0
0.01
4.0
66.411
93.589
6
5.0
100.0
200.0
0.01
4.0
83.029
116.971
Lxperinu'nl results oj different ofinitial Cr I 1I! concentration at pH 9. 0
I()
Sample No
PAC g/L
HA/ ppm
1
5.0
100.0
2
5.0
3
5.0
initial cr· ppm
6
remaining total Chromium I ppm
Adsorbed total Chromium/ ppm 0.320
NaNOJ/ mole/L
pH
20.0
0.01
9.0
19.680
100 0
40.0
0.01
9.0
34.486
5.514
100 0
80.0
0.01
9.0
53.531
26.469
/
4
5.0
100 0
120.0
0.01
9.0
72.487
47.513
5
5.0
100.0
160.0
0.01
9.0
92.867
67.133
6
5.0
100 0
200.0
0.01
9.0
121.912
78.088
49
20
Experimental data and ,l1odeling data for bare PAC at pH 6.5
~
1m pie: carbon ) g/L
1
'
2
pH
remaining total Chromium/ ppm
6.5
4.6542462
15.35
8.95E-05
0.089504 735
0.0002951
1.18E-07
0.01
6.5
12.425175
27.57
0.0002389
0.238945673
0.0005303
2.12E-07
initial Cr+ 6 /ppm
NaNO, mole/L
5
20.0
0.01
5
40.0
I
I
I I
1
i i
Adsorbed [ I total Chromium/ Cr ppm eql(moi/L)
Cr 3 eql(mol/m )
Cr adsorb(moi/L)
Ads density (mol/m- 2 )
3
i
5
80.0
0.01
6.5
28.964371
51.04
0.000557
0.557007135
0.0009815
3.93E-07
4
I
5
120.0
0.01
6.5
41.864469
78.14
0.0008051
0.805085942
0.0015026
6 01 E-07
5
i
5
160.0
0.01
6.5
55.666921
104.33
0.0010705
1 070517712
0.0020064
8 03E-07
5
200.0
0.01
6.5
66.803867
133.2
0.0012847
1.28468975
0.0025615
1.02E-06
6
2I
Experimental data and Jlodeling data/or bare PAC at pH 9JJ
~
Sampl~ carbon
NaNO, mole/L
pH
remaining total Chromium /ppm 2.2393019
no
'
g/L
initial Cr+ 6 /ppm
1
!
5
20.0
0.01
9
Cr eql(moi/L)
Cr 3 eql(mol/m )
Cr adsorb(moi/L)
Ads density (mol!m. 2 )
17.76
4.31 E-05
0.043063498
0.0003416
1.37E-07
2
5
40.0
0.01
9
7.353323
32.65
0.0001414
0.141410058
0.0006278
2.51 E-07
3
5
80.0
0.01
9
15.020669
64.98
0.0002889
0.288859019
0.0012496
5.00E-07
4
5
120.0
0.01
9
25.117494
94.88
0.000483
0.483028731
0.0018247
7.30E-07
0.0006954
0.695374154
0.0023815
9.53E-07
0.0008372
0.837166096
0.003009
1.20E-06
5 6
I
5
160.0
0.01
9
36.159456
123.84
5
200.0
0.01
9
43.532637
156.47
22.
Experimental data and .1/od!'!ing data }or bare PAC at pi I-/. 0
-----r nple 10
1
Adsorbed total Chromium/ ppm
I
carbon g/L
initial Cr+ 6 /ppm
NaNO, mole/L
pH
Remaining total Chromium /ppm
I
5
20.0
0.01
4
2.781
17.2189
5.35E-05
0.053483506
5
40.0
0.01
4
7.547
32.453
0.0001451
0.145134394
0.0006241
2.50E-07
0.0011977
4.79E-07
0.0015996
6.40E-07
1
Adsorbed total Chromium/ ppm
Cr eql(moi/L)
Cr 3 eql(mol/m )
Cr adsorb(moi/L)
Ads density (mollm- 2 )
0.0003311
1.32E-07
I
2 3
5
80.0
0.01
4
17.721
62.2788
0.0003408
0.340791942
4
5
120.0
0.01
4
36.818
83.1816
0.000708
0.708046385
5
5
160.0
0.01
4
50.762
109.238
0.0009762
0.9761905
0.0021007
8.40E-07
5
200.0
0.01
4
57.264
142.736
0.0011012
1.101227885
0.0027449
1.1 OE-06
6
50
Experimental dato and .\lode ling data for I r~ treatai PAC at pi I .f. 0
2 3.
l
i I
I I
I
PAC giL
I
HA fppm
I
I
5.0
I
i
100.0
L
5.0
i
i
100 0
20.0
0.224
40.0
4.682
I I
I
I
initial cr• 6 tppm
'
I,
i
I
remaining total Chromium fppm
I1 Adsorbed total I Chromiumfpp
I
'
Cr adsorption (molfL)
Ads density (molfm- 2 )
m
Cr eql(molfL)
Cr eql 3 (mollm )
I
19.776
4.31279E-06
0.004312788
4.31279E-06
1.72512E-09
i
35.318
9.00312E-05
0 090031154
9.00312E-05
3 60125E-08
I
I
5.0
100 0
80.0
14.335
65.665
0.000275673
0.275673269
0.000275673
1.1 0269E-07
5.0
100.0
120.0
27.457
92.543
0.000528025
0.528024615
0.000528025
2.1121 E-07
5.0
100.0
160.0
37.548
122.452
0.000722072
0.722071538
0.000722072
2.88829E-07
5.0
100.0
200.0
46.943
153.057
0.000902759
0.902759231
0.000902759
3.611 04E-07
Cr adsorption (molfL)
Ads density (molfm' 2 )
2./.
I
Experimental data and .\lodcling data(or H. I treated P.IC at plf Y.O
PAC giL
HA I ppm
initial cr• 6tppm
remaining total Chromium I ppm
5
100
20.0
11.127
8.873
0.000213972
0.213972308
0. 000853215
3.41286E-07
5
100
40.0
19.498
20.502
0.000374961
0.3754960962
0.000985675
3.9427E-07
5
100
80.0
30.265
49.735
0.000582027
0.582027115
0.001295543
4.78217E-07
5
100
120.0
40.983
79.017
0.000788131
0.788131154
0.001266301
5.0652E-07
5
100
160.0
52.506
107.494
0.001009723
1.0097225
0.001292
5.1687E-07
5
100
200.0
68.927
131.073
0.001325523
1.3255225
0.001260316
5.04126E-07
Adsorbed total Chromiumfppm
Cr eql(molfL)
Creql (mollm 3 )
Experimental results o(differe/11 concentration ofP.-IC at plf .f.O
25.
I I
Sample no
carbon giL
Cr (mgfL)
NaN OJ molef L
pH
remaining total Chromium I ppm
Adsorbed totlal Chromium ppm
Cr removal %
1
5.0
20.0
0.01
4.0
15.078
4.9
24.61
2
5.0
20.0
0.01
4.0
11.220
8.8
43.9
3
5.0
20.0
0.01
4.0
8.919
11.1
55.405
4
5.0
20.0
0.01
4.0
7.518
12.5
62.41
5
5.0
20.0
0.01
4.0
5.774
14.2
71.13
51
I
26
L\periment results o/differr!l1t concf'ntration o(HA trf'att'd PAC at pH ./.0 T
1
/ Sample / carbon i g/L / no
/
HA /ppm
NaN03/ mole/ L
pH
remaining total Chromium /ppm
/ Adsorbed totlal Chromium/ ppm
Cr removal
%
I
1 I
i
5.0
20.0
0.01
4.0
10.631
9.4
2l
5.0
46.845
20.0
0.01
r
4.0
9.723
10.3
3
51.385
5.0
20.0
0.01
4.0
6204
13.8
41
68.98
I
5.0
20.0
r
4.0
2.52
17.5
5
I
0.01
5.0
4.0
1.728
18.3
r
I
i
2o.o
I
0.01
i
I
87.4 91.36
52
Appendices B
Reading 2
MOISTURE% CBD gfcc DINE NO mg/g
56.3
7.1
7.3
0.56
0.57
1115
1107
4.6
0/o
PARTICLE
55.5
. . . . . . .ioo ---··················
SIZE
I ·······-~-~~.!
I
DISTRIBUTION (ASTM)
I
-5001
I
0.0 2.6 7.3 8.4 81.7
0.0 3.0 6.8 8.8 81.4
10.0
SURFACE AREA, m 2 /g (CALCULATED)
1165
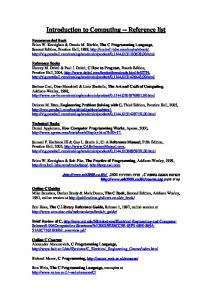
HAYCARB PLC. 400, DEANS ROAD, COLOMBO 10, SRI LANKA.
PHONE: +94 112 687565, E-MAIL.
[email protected], FAX.+94 112 699630
)3
Appendices C CEA effluent discharges limits
0 I. Ciencral standards criteria for the discharge or industrial cttluents in to inland surbcc \\aters. (pagl' )))
02. Tolerance limits l"or industrial effluents discharged on land Cor irrigation purpose.
(page 56)
0~.
Tolerance limits for industrial and domestic enlucnts discharged
111
to manne
coastal areas. (page 57)
O.f. Tolerance limits !en effluents in to public SC\\ers \\ith central treatment plants.
(page 58)
05. Tolerance limits !c1r efJluents Crom text tile industr\ being discharged in to inland surL1cc \\i:lters. (page 59)
).f
GENERAL STANDARDS CRITERIA FOR THE DISCHARGE OF INDUSTRIAL EFFLUENTS INTO INLAND SURFACE WATERS NO
PARAMETER
UNIT TYPE OF LIMIT
TOLERANCE LIMIT VALUES
01
Total suspended solids
mg/1, max
50
02
Particle size of the total suspended solids
,urn, less than
850
03
pH at ambient temperature
0-l
Biochemical oxygen demand (BOD 5 in five days at 2Cfl Cor BOD 3 in three days at 27°C)
mg/1, max
05
Temperature of discharge
°C, max
06
Oils and greases
mg/1, max
10
07
Phenolic compounds (as CfiHpH)
mg/1, max
1
08
Chemical oxygen demand (COD)
mg/1, max
250
09
Colour
Wavelength Range 436 nm (Yellow range) 525 nm (Red range) 620 nm (Blue range)
6.0- 8.5
30 Shall not exceed 40°C in any section of the stream within 15 m down stream from the effluent outlet.
Maximum spectral absorption coefficient 7m· 1
Sm· 1 3m· 1
10
Dissolved phosphates (asP)
11
Total kjeldahl nitrogen (as N)
mg/1, max
12
Ammoniacal nitrogen (as N)
mg/1, max
50
mg/1, max
0.2
mg/1, max
.
5 !50
13
Cyanide (as CN)
14
Total residual chlorine
mg/1, max
1.0
15
Fluorides (as F)
mg/1, max
2.0
16
Sulphide (as S)
mg/1, max
2.0
17
Arsenic (as AS)
mg/1, max
0.2
18
Cadmium (as Cd)
mg/1, max
0.1
19
Chromium, total (as Cr) C~·)
mg/1, max
0.5
mg/1, max
0.1 3.0
20
Chromium, Hexavalent (as
21
Copper (as Cu)
mg/1, max
22
Iron (as Fe)
mg/1, max
3.0
23
Lead (as Pb)
mg/1, max
0.1
24
Mercury (as Hg)
mg/1, max
0.0005
25
Nickel (as Ni)
mg/1, max
3.0
26
Selenium (as Se)
mg/1, max
0.05
27
Zinc (as Zn)
mg/1, max
2.0
28
Pesticides
mg/1, max
0.005
29
Detergents/surfactants
mg/1, max
30
Faecal Coliform
MPN/1 00 ml, max
40
31
Radio Active Material: (a) Alpha emitters (b) Beta emitters
Micro curic/ml, max Micro curie/ml, max
J08 J0-1
5
55
Note 1
All efforts should be made to remove unpleasant odour ad dar as possible.
Note 2
These value are based on dilution of effluents by at least 8 volumes of clean receiving water. If the dilution is below 8 times, the permissible limits arc multiplied by the 1/8 of the actual dilution
Not..: 3
The above mentioned general standards shall cease to apply with regard to a particular indusrty when industry ~pccific standards are notified for that industry ·
Note 4
Pesticides as per World Health Organization (WHO) and Food and Agriculture Organization (FAO) requirements
TOLERANCE LIMITS FOR INDUSTRIAL EFFLUENTS DISCHARGED ON LAND FOR IRRIGATION PURPOSE
UNIT TYPE OF LIMIT
PARAMETER
NO
TOLERANCE LIMIT VALUES
1
Total dissolved solids
2
pH at ambient temperature
3.
mg/1, max
250
4.
Biochemical oxygen demand (BOD 5 in five days at 20° Cor BOD 3 in three days at 27°C) Oils and greases
mg/1, max
10.0
5.
Chemical Oxygen Demand (COD)
mg/1, max
400
6.
Chlorides (as Cl)
mg/1, max
600
7.
Sulphates (as S04 )
mg/1, max
1000
8.
Boron (as B)
mg/1, max
2.0
9.
Arsenic (as As)
mg/1, max
0.2
10.
Cadmium (as Cd)
mg/1, max
2.0
11.
Chromium, total (as Cr)
mg/1, max
1.0
12.
Lead (as Pb)
mg/1, max
1.0
13.
Mercury (as Hg)
mg/1, max
14.
Sodium adsorption ratio (SAR)
15.
Residual sodium carbonate (RSC)
moV1, max
2.5
16.
Electrical conductivity
f.lS/cm, max
2250
17.
Faecal coliform
MPNIJOOml, max
40
18.
Copper (as Cu)
mg/1, max
1.0
19.
Cyanide (as CN)
mg/1, max
0.2
20.
Radio Active Material: (a) Alpha emitters (h) Reta emitters
mg/1, max
!
2100
-
5. 5 - 9.0
. 0.01
-
10-15
I
i !
'
I
I
1o-9 1o-&
micro curie/ml, max micro curie/m1, max
I
I
Hydrualic loading applicable for different Solis. Soil Texture Class
Recommended dosage of settled industrial effluents (m 3/hectare,day)
I. Sandy
225- 280
2. Sandy loam
170-225
3. loam
110 - 170
4. clay loam
55- 110
5. clay L-
------
35- 55 --
-
56
TOLERANCE LIMITS FOR INDUSTRIAL AND DOMESTIC EFFLUENTS DISCHARGED INTO MARINE COASTAL AREAS
UNIT TYPE OF LIMIT
PARM\ETER
NO 01
Total suspended solids
mg/l, max
02
Particle size of(a) Floatable solids
mm, max
(b) Settlable solids
{.1m,
TOLERANCE LIMIT VALUES
'
!50 3
max
850
-
03
pH at ambient temperature
04
Biochemical oxygen demand (BOD 5 in five days at 20°C or BOD 3 in three days at 27°C)
mg/l, max
100
05
Temperature of discharge
°C, max
45°C at the point of discharge
06
Oils and greases
mg/l, max
20
07
Phenolic compounds (as Phenolic OH)
mg/1, max
5.0
08
Chemical oxygen demand (COD)
mg/1, max
250
09
Total residual chlorine
mg/l, max
1.0
10
Ammoniacal Nitrogen (as N)
mg/1, max
50
II
Cyanide (as N)
mg/1, max
0.2
5.5 - 9.0
30
12
Sulphides (as S)
mg/1, max
5.0
13
Fluorides (as F)
mg/1, max
15
14
Arsenic (as As)
mg/1, max
0.2
15
Cadmium (as Cd)
mg!l, max
2.0
16
Chromium, total (as Cr)
mg/1, max
17
Chromium, Hexavalent (as Cr"•)
mg/1, max
1.0
18
Copper (as Cu)
mg/1, max
3.0
19
Lead (as Pb)
mg/1, max
1.0
20
Mercury (as Hg)
mg/1, max
0.01
21
Nickel (as Ni)
mg/1, max
5.0
22
Selenium (as Se)
mg/1, max
0.1
23
Zine (as Zn)
mg/1, max
5.0
24
Pesticides
mg/1, max
0.005
25
Organo-Phosphorus compounds
mg!l, max
1.0
26
Chlorinated hydrocarbons (as Cl)
mg/1, max
0.02
27
Faecal coliform
mg/1, max
60
28
Radio Active Material: (a) Alpha emitters (b) Beta emitters
I
I
~~-'
micro curie/ml, max micro curie/ml, max
.
2.0
___ I
10 8 w~1
~-J
Note l
All efforts should be made to remove unpleasant odour and colour as far as practicable.
l"ote 2
These value are based on dilution of efnuents by at least 8 volumes of clean receiving water. if the dilution is below 8 times, the permissible limits are multiplied by the l/8 of the actual dilution
57
TOLERANCE LIMITS FOR EFFLUENTS INTO PUBLIC SEWERS WITH CENTRAL TREATMENT PLANTS
NO
UNIT TYPE OF LIMIT
PARAMETER
TOLERANCE LIMIT VALUES
I
i
01
Total suspended solids
mg/1, max
02
pH at ambient temperature
mg/1, max
5.5- 10. 0
03
Temperature
°C, max
45
04
Biochemical oxygen demand (BOD 5 in five days at 2CJlC or BOD 3 in three days at 27°C)
mg/1, max
350
05
Chemical oxygen demand (COD)
mg/1, max
850
06
Total kjeldahl nitrogen (as N)
mg/1, max
500
07
Free ammonia (as N)
mg/1, max
50
08
Ammoniacal nitrogen (as N)
mg/1, max
50
09
Cyanide (as CN)
mg!l, max
2
10
Total residual chlorine
mgll, max
3.0
II
Chlorides (as Cl)
mg/1, max
900
12
Fluorides (as F)
mg/1, max
20
13
Sulphide (as S)
mg/1, max
14
Sulphates (as S04 )
mg/1, max
15
Arsenic (aas AS)
mg/1, max
0.2
16
Cadmium (as Cd)
mg/1, max
1.0
17
Chromium, total (as Cr)
mg/1, max
2.0
18
Copper (as Cu)
mg/1, max
3.0
19
Lead (as Pb)
mg/1, max
1.0
20
Mercury (as Hg)
mg/1, max
0.005
21
Nickel (as Ni)
mg/1, max
3.0
Selenium (as Se)
mg/1, max
0.05
mg/1, max
5.0
22 -~--
-~-
-.
5.0 1000
-----
Zine (as Zn)
23
500
24
Pesticides
mg/1, max
0.2
25
Detergents/surfactants
mg/1, max
50
26
Phenolic compounds (as phenolic OH)
mg/1, max
5
27
Oil and Grease
mg/1, max
30
28
Radio Active Material: (a) Alpha emitters (b) Beta emitters
Micro curie/ml, max Micro curie/ml, max
I
lQ-8
IQ-7
58 Notes :The Following conditions should be met:
+
discharge of high viscous material should be prohibited
+
Calcium Carbide sludge should not be discharged
·l·
Substances producing inflammable vapours should be absent
TOLERANCE LIMITS FOR EFFLUENTS FROM TEXTILE INDUSTRY BEING DISCHARGED INTO INLAND SURFACE WATERS
UNIT TYPE OF LIMIT
PARAMETER
NO
TOLERANCE LIMIT VALUES
I.
pH at ambient temperature
2.
Temperature
°C, max
40 measured at site of sampling
3.
Total suspended solids
mg/1, max
50
4.
Biochemical oxygen demand (BOD5 in five days at 20°C or BOD 3 in three days at 270C)
mg/1, max
60
5.
6.5 to 8.5
Clour
Wavelength Range 436nm (Yellow range) 525 nm (Red range) 620nm (Blue range)
Maximum spectral absorption coefficient 7m· 1 5rri·l 3m·'
6.
Oils and grease
mg/1, max
10
7.
Phenolic compounds (as phenolic OH)
mg/1, max
l.O
8.
Chemical oxygen demand (COD)
mg/1, max
250
9.'
···Sulphides (as S)
I
..
.
.•
mg/1, max
2.0
mgll,max
2.0
mg/1, max
0.5
10.
Chromium total (as Cr)
11.
Hexavalent Chromium (as Cr+'/
.-.
· ·
.,.
•
'.
::-rs 201.
Urir;_"1 : .'/
""j
;. •.,.:·
11
J
.• , '
"-1 .
, .... ...-~·
\ ·(..l ';.. ,~,.,. (.,\." \' / ·, :7 .•. •' ·{';"" • . • . .• 1 . l '' . ,.