review
Reference values for maximal inspiratory pressure: A systematic review Isabela MB Sclauser Pessoa PT PhD1, Verônica Franco Parreira PT PhD2, Guilherme AF Fregonezi PT PhD3, A William Sheel BPE PhD4, Frank Chung PT MSc5, W Darlene Reid PT PhD6,7,8 IMB Sclauser Pessoa, V Franco Parreira, GAF Fregonezi, AW Sheel, F Chung, WD Reid. Reference values for maximal inspiratory pressure: A systematic review. Can Respir J 2014;21(1):43-50. BACKGROUND: Maximal inspiratory pressure (MIP) is the most commonly used measure to evaluate inspiratory muscle strength. Normative values for MIP vary significantly among studies, which may reflect differences in participant demographics and technique of MIP measurement. OBJECTIVE: To perform a systematic review with meta-analyses to synthesize MIP values that represent healthy adults. METHODS: A systematic literature search was conducted using Medline, EMBASE, Cochrane, Cumulative Index to Nursing and Allied Health (CINAHL) and Sport Discus databases. Two reviewers identified and selected articles, and abstracted data. Methodological quality was assessed using the Quality Assessment of Diagnostic Accuracy Studies (QUADAS) tool. A random-effects model was used to calculate overall means and 95% CIs. RESULTS: Of 22 included articles, MIP data were synthesized according to age group and sex from six reports (n=840) in the meta-analyses. The mean QUADAS score was 3.5 of 7. The age range was between 18 and 83 years (426 men, 414 women). MIP began to decrease with age in the 40 to 60 years age range and continued to fall progressively with age. For the same age group, men tended to have higher MIPs than women. Sensitivity analysis of withdrawing studies from the meta-analysis identified one study that contributed more to heterogeneity in some age groups. DISCUSSION: MIP was higher in men and decreased with age, which was initially apparent in middle age. Several characteristics of participants and MIP technique influence values in healthy individuals. CONCLUSIONS: The present meta-analysis provides normative MIP values that are reflective of a large sample (n=840) and likely represents the broadest representation of participant characteristics compared with previous reports of normative data. Key Words: Adults; Muscle strength; Reference values; Respiratory muscles
I
mpairment of the respiratory muscles compromises ventilation, gas exchange and oxygen delivery to tissues (1). Respiratory muscle weakness has been reported in several conditions including those that are cardiovascular (2,3), pulmonary (4) and neuromuscular (5,6) in origin. Inspiratory muscle strength is reflected by the pressure developed within the thorax; these pressure measures are informative for clinical evaluation as well as physiological studies (1). Measurement of maximal inspiratory pressure (MIP) is a straightforward test in which individuals are asked to perform a forceful inspiration against an occluded mouthpiece (1,7). The advantages of this test are that it is noninvasive and performed quickly. On the other hand, its dependence on voluntary effort and the wide range of normative values limit the clinical utility of MIP. Consequently, a low value can reflect inspiratory muscle impairment but also can be due to poor test performance (8-10). Even a well-performed MIP test is difficult to interpret due to uncertainty of the most representative normative values.
Les valeurs de référence de la pression inspiratoire maximale : une analyse systématique HISTORIQUE : La pression inspiratoire maximale (PIM) est la mesure la plus utilisée pour évaluer la force des muscles inspiratoires. Les valeurs normatives de PIM varient considérablement selon les études, ce qui reflète peut-être des différences dans la démographie des participants et dans la technique pour mesurer la PIM. OBJECTIF : Effectuer une analyse systématique au moyen de méta-analyses pour synthétiser les valeurs de PIM qui représentent des adultes en santé. MÉTHODOLOGIE : En vue de l’analyse systématique, les chercheurs ont fouillé dans les bases de données Medline, EMBASE, Cochrane, Cumulative Index to Nursing and Allied Health (CINAHL) et Sport Discus. Deux analystes ont déterminé et sélectionné les articles et synthétisé les données. Ils ont évalué la qualité méthodologique au moyen de l’outil QUADAS d’études d’évaluation de la qualité et d’exactitude diagnostique. Ils ont utilisé un modèle à effets aléatoires pour calculer les moyennes globales et les IC de 95 %. RÉSULTATS : Les données de PIM ont été synthétisées selon le groupe d’âge et le sexe dans six des 22 articles inclus (n=840) dans la méta-analyse. L’indice QUADAS moyen était de 3,5 sur 7. La fourchette d’âge se situait entre 18 et 83 ans (426 hommes, 414 femmes). La PIM maximale s’est mise à diminuer avec le vieillissement dans la fourchette des 40 à 60 ans et a continué à dégresser progressivement avec l’âge. Dans le même groupe d’âge, les hommes avaient tendance à présenter des PIM plus élevées que les femmes. Les analyses de sensibilité pour retirer des études de la méta-analyse n’ont pas permis de repérer une seule étude qui contribuait davantage à l’hétérogénéité que les cinq autres. EXPOSÉ : La PIM était plus élevée chez les hommes et diminuait avec l’âge, une tendance qui a commencé à être apparente à l’âge mur. Plusieurs caractéristiques des participants et la technique de PIM influaient sur les valeurs chez les personnes en santé. CONCLUSIONS : La présente méta-analyse fournit des valeurs de PIM normatives qui reflètent un énorme échantillonnage (n=840) et représentent probablement la plus vaste représentation des caractéristiques des participants par rapport aux rapports antérieurs de données normatives.
Numerous sets of reference values for MIP have been reported (5,7-30); however, the usefulness of normal MIP values is obscured by the large variability among studies. The variation among these reports likely indicates differences in participant demographics and technical aspects of test performance (1,7). Participant characteristics that have been considered to influence MIP include effort and understanding of test performance, age, sex, height, weight, fitness level and smoking status (31-33). Apparatus set-up and test performance issues that can affect MIP values include type of mouthpiece, presence of a small leak, pressure evaluated (ie, peak or plateau), number of trials and lung volume at the starting point of test performance (1,7,19,27,34,35). Due to the large interstudy variation of normative values for MIP, the data from a single study may not be appropriate to establish the lower limit indicating respiratory muscle weakness (25). The American Thoracic Society (ATS)/European Respiratory Society (ERS) (1)
1Rehabilitation
Sciences Graduation Program, School of Physical Education, Physiotherapy and Occupational Therapy; 2Department of Physical Therapy, Universidade Federal de Minas Gerais, Belo Horizonte; 3Department of Physical Therapy, Universidade Federal do Rio Grande do Norte, Natal, Brazil; 4School of Kinesiology, University of British Columbia, Vancouver; 5Department of Physical Therapy, Burnaby Hospital, Burnaby; 6Department of Physical Therapy, University of British Columbia; 7Vancouver Coastal Health Research Institute; 8Institute for Heart and Lung Health, University of British Columbia, Vancouver, British Columbia Correspondence: Dr Darlene Reid, Muscle Biophysics Laboratory, 617 – 828 West 10th Avenue, Vancouver, British Columbia V5Z 1M9. Telephone 604-875-4111 ext 66056, e-mail
[email protected]
Can Respir J Vol 21 No 1 January/February 2014
©2014 Pulsus Group Inc. All rights reserved
43
Sclauser Pessoa et al
of trials, criterion for stopping, instruction and demonstration, interval between manoeuvres, screen incentive and calibration of the instrument. MIP was also abstracted and, when possible, MIP and other data were abstracted according to age per decade (eg, 20 to 29 years) and sex. Due to the different definitions reported for peak, plateau and average pressures in the 22 studies, the following definitions were operationalized: plateau pressure was reported as the highest pressure that could be sustained for a defined minimum period (7,16,25,27); and peak pressure was defined as the highest value reached during MIP (1,18,19). Authors of two studies (9,23) were contacted to provide additional information for missing data.
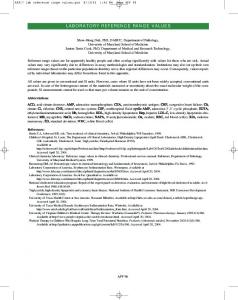
Figure 1) Flow diagram indicating articles identified, screened and included. CINAHL Cumulative Index to Nursing and Allied Health Literature statement on respiratory muscle testing states that the normal ranges of MIP are wide, and the values in the lower quartile of the normal range can be consistent with either normal strength or mild to moderate weakness. This guideline states that an MIP of −80 cmH2O usually excludes clinically important inspiratory muscle weakness; however, this threshold does not consider age and sex, and is higher than the mean predicted values for older men, and middle-age and older women (8,10,13). Unfortunately, universally applicable normal values for MIP resulting from prediction equations and, specifically, agreement on the lower limits of normal, are not available. Because the application and interpretation of MIPs for clinical evaluation is complicated by the extremely wide range of reported normative values, the purpose of the present meta-analysis was to synthesize and to evaluate the quality of study design and methodology to determine normative MIP values in healthy adults.
METHODS
Search strategy and selection criteria A search of the Medline, EMBASE, Cochrane, Cumulative Index to Nursing and Allied Health (CINAHL) and Sport Discus databases (from inception to May 2012) was conducted. Inclusion criteria were as follows: participants were healthy adults (>18 years of age); the purpose of the study was to determine reference values for MIP; and published in English or Portuguese. Articles were excluded if they were a review article, thesis or dissertation; and the measurement was assessed in a standing position rather than sitting. The search strategy used the following terms: “respiratory muscles” combined with “maximal inspiratory pressure” and “reference values”. These terms were modified to meet the requirements of the different databases. Details of search strategies are available on request from the corresponding author. Additional studies were identified by examining the reference list of all included articles. Duplicates were removed, and two authors independently reviewed titles and abstracts of citations retrieved from the search. Disagreements were discussed until consensus for inclusion or exclusion was reached. Subsequently, two authors reviewed the full text of all selected articles to determine whether they met the inclusion criteria. Data abstraction Five authors (AWS, WDR, FC, ISP and VFP) abstracted data from the included articles regarding subject characteristics and technical aspects of test performance including: age, sex, height, weight, lung function, presence of diseases, fitness, smoking status, race, mouthpiece type, small leak, pressure evaluated, gauge type, lung volume of test performance, noseclip, total time of the MIP manoeuvre, number
44
Methodological quality of included studies Methodological quality of each study was independently assessed by two authors using the relevant items of the Quality Assessment of Diagnostic Accuracy Studies (QUADAS) scale (36,37). QUADAS is an evidence-based, validated, quality assessment tool used specifically for systematic reviews to evaluate risk of bias and study accuracy (36,37). Given that MIP was not compared with another reference standard in the retrieved articles, seven of the 14 items were relevant for quality assessment. Additional items specific to the quality of MIP testing methodology were also abstracted. Synthesis and meta-analysis Subject characteristics and technical aspects of the test, including quality assessment, were synthesized in tabular format. Meta-analyses were performed on MIP by inputting mean and SD of MIP (cmH2O) values that were categorized according to age (divided into six ranges) and sex. Studies were included in the meta-analyses if data were reported in comparable age ranges and sex. Six studies reported data in comparable age ranges (12,15,24,26,29,30). The random-effects model was selected for the meta-analyses to examine methodological variation in the included studies (38-40). The inverse variance and variance component (τ2) were used to calculate the weight applied in the random-effects model (39-41). The method of moments estimate were used to calculate individual τ2 (39,40). The homogeneity statistic, Q, was calculated to provide a measure of the heterogeneity of MIP among studies. A sensitivity analysis was performed to determine whether one or more studies contributed more to hetereogeneity.
RESULTS
Search and selection A flow diagram depicting the search and selection of studies is shown in Figure 1. The search of databases identified 4367 titles and abstracts, of which 19 full-text articles were reviewed. Eleven additional articles were identified from the reference lists of articles (manual search). Of the 30 full-text articles reviewed, eight were excluded because the study purpose was not to determine reference values of MIP (31,33,35,42,43); it was a review (43); the MIP manoeuvre was performed at functional residual capacity rather than residual volume (9) or in a standing rather than sitting position (20,44). Methodological quality of studies Methodological quality, as assessed according to seven items of the QUADAS, ranged between 0 and 7, with a mean score of 3 (Table 1). The most common items that were reported included: similar data available during test results and in practice (15 of 22 studies); study participants were representative of participants who would be tested in practice (12 of 22 studies); and the selection criteria were clearly described (12 of 22 studies). The quality criteria that were least often reported were whether the reference standard was likely to correctly classify the target condition (six of 22 studies); and whether uninterpretable/intermediate tests results were reported (six of 22 studies). Other issues that affected methodological quality were patient characteristics and MIP technique not queried by QUADAS. These issues are described in more detail in the following two sections and in Tables 2 and 3.
Can Respir J Vol 21 No 1 January/February 2014
Maximal inspiratory pressure: A systematic review
TABLE 1 Ratings of Quality Assessment of Diagnostic Accuracy Studies (QUADAS) QUADAS rating Author (reference), year
1
2
3
9
12
13
14
Total (of 7)
Cook et al (11), 1964
No
No
No
No
No
No
Unclear
0
Ringqvist (12), 1966
No
No
No
No
Yes
No
Yes
2
Black and Hyatt (5), 1969
No
No
No
Unclear
No
No
Unclear
0
Leech et al (13), 1983
Yes
Yes
No
No
Yes
Yes
Yes
5
Wilson et al (14), 1984
No
No
No
No
No
No
Unclear
0
Camelo Jr et al (15), 1985
No
No
No
Yes
No
Yes
Unclear
2 1
Vincken et al (16), 1987
No
No
No
Yes
No
Unclear
Unclear
McElvaney et al (17), 1989
Yes
Yes
Yes
Yes
Yes
No
Yes
6
Bruschi et al (18), 1992
No
No
No
Yes
No
Yes
Yes
3
Enright et al (19), 1994
No
No
No
Yes
Yes
No
Yes
3
Enright et al (21), 1995
Yes
Yes
Yes
Yes
Yes
Yes
Yes
7
Johan et al (22), 1997
Yes
Yes
Unclear
Unclear
Yes
No
Unclear
3
Pande et al (23), 1998
Yes
Yes
No
No
Yes
No
Unclear
3
Harik-Khan et al (8), 1998
Yes
Yes
Yes
Yes
Yes
Yes
Yes
7
Neder et al (24), 1999
Yes
Yes
No
No
Yes
No
Unclear
3
Hautmann et al (25), 2000
Yes
Yes
No
No
Yes
Unclear
Yes
4
Wohlgemuth et al (26), 2003
Yes
Yes
Yes
Yes
Yes
No
Unclear
5
Windisch et al (27), 2004
Yes
Yes
Yes
Yes
Yes
No
Unclear
5
Sachs et al (28), 2009
No
No
No
No
Yes
Yes
Yes
3
Simões et al (29), 2010
Yes
Yes
Yes
Yes
Yes
No
Yes
6
Costa et al (30), 2010
Yes
Yes
No
No
Yes
No
Unclear
3
Gopalakrishna et al (10), 2011
No
No
No
No
No
No
Unclear
0
Subtotals for items
12
12
6
10
15
6
10
QUADAS Items (36): 1. Was the spectrum of persons representative of the demographics of the patients who will receive the test in practice?; 2. Were selection criteria clearly described?; 3. Is the reference standard likely to correctly classify the target condition?; 9. Was the execution of the reference standard described in sufficient detail to permit its replication?; 12. Were the same clinical data available when test results were interpreted as would be available when the test is used in practice?; 13. Were uninterpretable/intermediate test results reported?; 14. Were withdrawals from the study explained?
Characteristics of participants The characteristics of the participants are summarized in Table 2. All studies used convenience samples except one (24), which used a random sample procedure. The total number of participants was 9723. Age ranged between 18 and 90 years. The number of men and women ranged from 23 to 1269, and nine to 1602, respectively. Most studies had more women except four (11,12,22,23). Nine studies were performed in North America (5,8,11,13,16,17,19,21,28), four in Brazil (15,24,29,30), three in India (10,22,23), two in Germany (25,27), and one in Italy (18), Sweden (12), England (14) and The Netherlands (26). Only seven studies reported the height and weight for each age group (10,12,13,24,26,29,30). Most studies included normal and overweight participants (body mass index [BMI] between 18.5 kg/m2 and 24.9 kg/m2 and between 25.0 kg/m2 and 29.9 kg/m2, respectively). Some participants in two reports were obese (21,27). Five studies reported other pulmonary function measures apart from forceded expiratory volume in 1 s (FEV1) (11,12,19,22,26). There were 10 studies that did not perform any subgroup analyses on smokers and nonsmokers (5,8,13-16,18,25-27). Of these, six studies did not report FEV1 values to substantiate the absence or presence of respiratory disease (5,14-16,18,26). Seventeen of the 18 studies stated that individuals with comorbidities, such as cardiac, neuromuscular or endocrine diseases, renal failure and active cancer treatment, were excluded (5,8,10,12,14, 16,17,21-30). Characteristics of MIP technique The methodology for measuring MIP varied considerably (Table 3). A flanged mouthpiece was used in five studies (14,16,22,24,27). A small leak was reported in 18 studies but the size was not specified in four (14,22,24,25). Most studies reported using nose clips (16 of 22) and
Can Respir J Vol 21 No 1 January/February 2014
provided instructions (18 of 22). The number of repetitive manoeuvres to obtain MIP was at least five in two studies (12,18) and at least seven in two others (25,27). In six studies, the authors considered the learning effect for MIP test; it was reported that the final manoeuvre was not the best manoeuvre in five studies (12,16,24,25,28), the test could be stopped when the subject considered him or herself unable to perform better (22). Several studies considered the highest value within two or three measures that were within 5% to 10% (Table 3). The lower limit of normal was reported in nine studies (8,19,21,24,25,27-30). Most used the fifth percentile of the negative residuals of MIP (8,19,21,25,27,30), which was calculated in each age group for both sexes in one report (27). In contrast, two studies provided an alternative definition (Table 3) and one did not define the lower limit of normal (28). Meta-analyses MIP values for men and women in different age groups derived from the random-effects analysis are shown in Table 4. Each age range reflected data from 59 to 96 subjects from at least five of the six studies (12,15,24,26,29,30). The total number of participants was 840. These six studies had an average QUADAS quality score of 3.5 of 7 (range 2 to 6). MIP decreased with age for both men and women. For the same age group, men tended to have a higher MIP than women. Sensitivity analysis of withdrawing studies from the meta-analysis often lowered the Q statistic. One study (26) contributed more to the Q statistic than the other five. MIP values from this report were within the range of the other five studies. As mentioned in the methods section, the random-effects model (40) was selected for the meta-analyses to examine methodological variations of the included studies.
45
Sclauser Pessoa et al
TABLE 2 Characteristics of participants BMI, kg/m2, FEV1, mean ± SD mean ± SD or 95% CI or 95% CI
Author (reference), year
Age, years (range)
Height, cm, mean ± SD
Weight, kg mean ± SD
Lung disease Smoking status
Cook et al (11),1964; n=32 (23M/9F)
M: Gp 3 18–47, Gp 4 49–64; F: Gp 6 17.5–32
M: Gp 3 181; Gp 4 177 F: Gp 6 164
NR
NR
NR
NR
NR
Ringqvist (12), 1966; n=200 (106M/94F)
18–83
Reported according to age
Reported according to age
NR
NR
No
NR
Black and Hyatt (5), 1969; n=120, (60M/60F)
20–74
NR
NR
NR
NR
No
Nonsmokers, smokers
Leech et al (13), 1983; n=595 (252M/343F)
15–35
Reported according to age
Reported according to age
NR
M: 4.5–4.6 L*
NR
Former and current smokers
Wilson et al (14), 1984; n=135 (48M/87F)
18–49 >50
M: 179±6
M: 74.5±8.5
NR
NR
No
F: 163±7
F: 61.4±9
M: 20, F: 23
Former and current smokers
Camelo Jr et al (15), 1985; n=60 (30M/30F)
20–49
M: 170±7.7
M: 70.0±10.8
NR
F: 56.0±9.1
NR M: 24, F: 22
NR
F: 160.2±6.2
Former, current and never smokers
Vincken et al (16), 1987; n=106 (46M/60F)
16–79
F: 3.2–3.4 L
M: 172±7
M: 74±9
No
F: 59±10.0
NR M: 25, F: 23
NR
F: 160±7
Nonsmokers and smokers
M: 174±7
M: 107±10
NR
M: 120±13%
No
NR
F: 161±6
F: 112±12
18–70
NR
NR
NR
NR
No
Nonsmokers and smokers
Enright et al (19), 1994; n=2871 (1269M/1602F)
>65
M: 173.2±6.59
M: 79.5±11.6
M: 26.5, F: 26.3
NR
NR
F: 158.8±6.30
F: 66.2±12.5
Nonsmokers and former smokers
Enright et al (21), 1995; n=228 (112M/176F)
>65
M: 171.25
M: 79.7
M: 26.4 (22,32)
M: 2.9 (2.0–3.7) L
No
F: 157
F: 65.7
F: 26 (20,34)
F: 1.9 (1.2–2.6) L
Nonsmokers and former smokers
Johan et al (22), 1997; n=452 (277M/175F)
20–80
M: 164–167*
M: 64.1–67.21
M: 23.0, 24.31
NR
No
F: 155–157*
F: 53.6–57.81
F: 21.9, 24.11
Nonsmokers and former smokers
Pande et al (23), 1998; n=273 (153M/120F)
20–65
M: 165.6±6.1
M: 62.5±11.7
M: 22.8±3.8
M: 2.15±0.48 L
No
Nonsmokers
F: 153.5±5.2
F: 57.5±10.9
F: 24.6±4.8
F: 3.18±0.64 L
M: 164.2±7.3
M: 64.7±11.9
M: 25.8±3.6
M: 91.7±12.0%
No
F: 177.6±6.6
F: 81.7±13.3
F: 23.9±4.1
F: 98.0±10.3%
Nonsmokers, former, occasional, current smokers
M: 168.4±6.2
M: 73.8±10.7
M: 25.3±3.9
M: 2.51–4.14 L*
No
Nonsmokers
F: 157.1±7.1
F: 62.5±10.8
F: 24.7±4.0
F: 1.85–3.01 L
M: 176.9±6.82
M: 78.3±10.9
M: 25±3.4
No
F: 164.9±6.37
F: 66.4±10.8
F: 24.5±4.0
F: 3.01±0.71 L
Smokers, former and nonsmokers
McElvaney et al (17), 1989; n=104 (40M/64F) Bruschi et al (18), 1992; n=669 (290M/379F)
Harik-Khan et al (8), 1998; n=267 (139M/128F)
>55
75
F: 117±17%
Neder et al (24), 1999; n=100 (50M/50F)
20–80
Hautmann et al (25), 2000; n=504 (248M/256F)
18–82
Wohlgemuth et al (26), 2003; n=252 (126M/126F)
18–80
Reported according to age
Reported according to age
NR
NR
No
Former and current smokers,
Windisch et al (27), 2004; n=490 (204M/286F)
10–90
M: 179.5±7.7
M: 77.9±11.2
M: 24.2±3.1
99.8±10.6%
No
F: 166.4±7.0
F: 66.0±10.9
F: 23.9±4.1
Never, former and current smokers
Sachs et al (28), 2009; n=1755 (872M/883F)
45–84
M: 172 F: 158
M: 80.45 F: 68.18
M: 27.19; F: 27.31
>65%
No
Nonsmokers
Simões et al (29), 2010; n=140 (70M/70F)
20–89
Reported according to age
Reported according to age
Reported according to age
M: 92±8% F: 93±7%
No
Nonsmokers
Costa et al (30), 2010; n=120 (60M/60F)
20–80
Reported according to age
Reported according to age
Reported according to age
NR
No
Nonsmokers
Gopalakrishna et al (10), 2011; n=250 (125M/125F)
20–70
M: 165.70±7.56
M: 64.62±9.73
M: 23.54±3.21
NR
No
Nonsmokers
F: 155.99±5.81
F: 56.41±9.90
F: 23.17±3.89
M: 106±21 L
*Range of mean data shown for different subgroups. BMI Body mass index; F Female; FEV 1 Forced expiratory volume in 1 s; Gp Group; M Male; NR not reported
46
Can Respir J Vol 21 No 1 January/February 2014
Maximal inspiratory pressure: A systematic review
TABLE 3 Technical aspects that influence maximal inspiratory pressure (MIP) Author (reference), year
Mouthpiece
Pressure Small leak (size) evaluated
Starting volume
Time of MIP
Trials, n
Criterion for stopping
LLN (percentile or cmH20)
Cook et al (11), 1963
Tube
NR
Peak
RV and FRC Without control Min of 2
NR
NR
Ringqvist (12), 1966
Tube
Yes (2 mm)
Peak
RV
Max 1.5 s
Min of 5
Highest value
NR
Black and Hyatt (5), 1969
Tube
Yes (2 mm)
Peak
RV
Min of 1 s
Min of 2
Highest value
NR
Leech et al (13),1983
NR
Yes (0.90 mm)
Peak
RV
NR
Max of 3
Highest value
NR
Wilson et al (14), 1984
Flanged
Yes, size NR
Peak
RV
Min of 1 s
Min of 3
2 identical readings
NR
Camelo Jr et al (15), 1985
Tube
Yes (2 mm)
Peak
RV
Min of 1 s
Min of 4
Highest value
NR
Vincken et al (16), 1987 Flanged
Yes (1.27 mm)
Plateau
RV
Min of 1 s
Min of 4
Highest 2 values within NR 5% difference
McElvaney et al (17), 1989
Yes (0.6 mm)
Peak
RV
Min of 1s
Min of 3
Highest 3 values within NR 5% difference
Tube
Bruschi et al (18), 1992 Tube
Yes (1.06 mm)
Peak
RV and FRC Min of 1 s
Min of 5
Highest value
Enright et al (19),1994
Tube
Yes (1 mm)
Peak
RV
2s
3–5
Highest 2 values within Yes (5th %); 10% difference M: −41; F: −32
NR
Enright et al (21),1995
Tube
Yes (1 mm)
Peak
RV
2s
5
Highest 2 values within Yes (5th %); 10% difference M: −42; F: −38
Johan et al (22), 1997
Flanged
Yes, size NR
Peak
RV
Min of 1 s
3–5
Highest value of 3 similar trials
NR NR
Pande et al (23), 1998
NR
Yes (1.27 mm)
Peak
RV
Min of 2 s
NR
Highest value
Harik-Khan et al (8), 1998
Tube
Yes (1 mm)
Peak
RV
2s
Max of 5
Highest 2 values within Yes (5th %); 10% difference M: −37; F: −32
Neder et al (24),1999
Flanged
Yes, size NR
Peak
RV
Min of 1 s
3–5
Highest value.