Abstractâ Heart rate variability (HRV) has been used in many studies to assess the effects of autonomic regulation on the heart rate. A 1996 task force specified ...
Reliability and Accuracy of Heart Rate Variability Metrics Versus ECG Segment Duration J. McNames1, T. Thong2, B. Goldstein3 1
Biomedical Signal Processing Laboratory, Electrical and Computer Engineering, Portland State University, Portland, OR, USA Biomedical Engineering, OGI School of Science and Engineering, Oregon Health & Science University, Portland, OR, USA 3 Complex Systems Laboratory, Pediatrics, Oregon Health & Science University, Portland, OR, USA
2
Abstract— Heart rate variability (HRV) has been used in many studies to assess the effects of autonomic regulation on the heart rate. A 1996 task force specified standards for calculating HRV metrics and reporting results. The standards focused on metrics calculated from short-term (5 min) and long-term (24 h) recordings of the electrocardiogram (ECG). We compared the accuracy of nine HRV metrics calculated from ECG records spanning 10 s to 10 min to that calculated from a 5 min record. We also estimated the reliability of all nine metrics calculated from 5 min records. We found that high frequency power (HF) and the root mean square of successive NN interval differences (RMSSD) were substantially less sensitive to the segment duration and more reliable than the other seven metrics. Keywords— Electrocardiogram (ECG), heart rate variability (HRV), interbeat intervals (IBI), intraclass correlation coefficient (ICC), reliability.
I. I NTRODUCTION EART rate variability (HRV) has received a tremendous amount of attention since the seminal work of [1]. Despite the exponential growth in HRV research, it has had only a modest impact on clinical practice. The only established clinical applications are for risk assessment of patients after myocardial infarction and early diagnosis of diabetic autonomic neuropathy [2], [3]. The physiologic mechanisms of HRV continue to be debated [4]–[7]. A task force of the European Society of Cardiology and the North American Society of Pacing and Electrophysiology published standards of measurement, interpretation and use of HRV in 1996 [2]. The task force specified many different HRV metrics for both short-term records (5 min) and longterm records (24 h). Although many other measures of HRV have been proposed and investigated, those specified by the task force have been the most widely applied. The task force did not fully address how long electrocardiogram (ECG) records must be in order to obtain reliable measures of HRV. In some cases, it may not be possible to obtain 5 min records due to instrumentation constraints or study design [8]. For example many 12-lead ECG instruments are often configured to acquire records that are only 10 s. In this paper, we address how the accuracy of nine HRV metrics varies with the record duration and estimate the reliability of metrics calculated from 5 min records.
H
II. M ETHODOLOGY A. Patient Population We used the Normal Sinus Rhythm RR Interval Database posted on PhysioNet [9]. The database includes the beat times
0-7803-7789-3/03/$17.00 ©2003 IEEE
of 54 long-term ECG recordings (21.4–24.2 h, 1280 h total) of subjects in normal sinus rhythm. The recordings were acquired from 30 men (ages 28.5–76) and 24 women (ages 58–73). The original recordings were sampled at a rate of 128 Hz. The annotations were generated by an automatic algorithm and then manually reviewed and corrected. B. Record Sampling We randomly selected 1000 15-min records with replacement from the database. For each case, we randomly selected a subject and a 15 min record from the entire recording. If the record contained any arrhythmias, we discarded it and repeated the random selection process. C. Time Domain Metrics We studied three time-domain and six frequency-domain HRV metrics recommended by the task force for short-term ECG records. We denote each of the N beat times as t(n) for n ∈ {1, . . . , N }. We denote the interval between beats as δ(n) = t(n) − t(n − 1). As recommended by the task force, we define the time of occurrence of each interval δ(n) as t(n). 1) SDNN: We calculated the standard deviation of the normal-to-normal (NN) intervals (SDNN) as � � N � 1 � � �2 δ(n) − δ¯ (1) SDNN = � N − 2 n=2 where δ¯ is the average NN interval, δ¯ =
N 1 � δ(n). N − 1 n=2
(2)
The scaling factor is N − 2 because there are N − 1 intervals in the record and one degree of freedom is used to estimate the mean NN interval. 2) HRVTI: The HRV triangular index (HRVTI) is a measure of the shape of the NN interval distribution. Generally, uniform distributions representing large variability have large values and distributions with single large peaks have small values. The metric is defined in terms of a histogram of the NN intervals. Here, we represent the number of intervals in the ith bin centered at t i as b(ti ). HRVTI is then defined as �Nb b(ti ) N −1 = (3) HRVTI = i=1 maxi b(ti ) maxi b(ti )
212
EMBC 2003
where Nb is the number of bins. We used a constant bin width of 1/fs = 8 ms. The task force did not specify how to align the bins. We chose to locate the bin centers at integer multiples of 1/fs so that each bin only contained equal intervals. 3) RMSSD: We calculated the root mean square of successive NN interval differences (RMSSD) as � � N � 1 � [δ(n) − δ(n − 1)]2 . (4) RMSSD = � N − 2 n=3 D. Frequency Domain Metrics All frequency domain HRV metrics are based on the estimated power spectral density (PSD) of the NN intervals. Although the task force gave specific definitions of the metrics, it did not specify how to estimate the PSD. There are many methods of estimating PSD and each generates different HRV metric values. If the NN interval series is not well behaved or too short, as in our case, these differences can be substantial. In this section we give a complete description of our PSD estimator, as required by the task force. We smoothed and uniformly resampled the NN intervals at a rate of 3 Hz with a kernel smoother, � �N |kTs −t(n)| δ(n) b n=1 σb � (5) d(k) = � N |kTs −t(n)| b n=1 σb where Ts = 1/3 s is the resample interval, σb is the kernel width, and b(·) is a clipped Gaussian kernel function
exp(−u2 /2) −5 ≤ u ≤ 5 b(u) = (6) 0 Otherwise. We generated the uniformly resampled signal d(k) over the duration of the ECG record. The kernel smoother also acts like a lowpass filter with a cutoff frequency determined by σb . Large values of σ b reduce aliasing but can bias HRV metrics that rely on accurate estimates of the PSD at higher frequencies. We used σ b = 0.25 s for the results reported here. We applied Welch’s nonparametric method of Periodogram averaging to estimate the PSD of d(k). This estimate is calculated as the average of Periodograms calculated from overlapping segments of d(k), � �2 K−1 � � ��L−1 �� � 1 � ˆ ejω ) = d(k + iL) − d¯ w(k) e−jωk � (7) R( � � � KL i=0
k=0
where K is the number of segments, L is the number of samples in each segment, d¯ is the sample average of d(k) over the full record, and w(m) is a window function that determines the tradeoff between main lobe width and sideband leakage. We used a Blackman window with a length of 20 s or the duration of the record, whichever is shorter. We allowed a 50% overlap between segments. Each segment was padded with zeros to a total length of 4096 samples to minimize the error in estimating the signal power over specified frequency ranges with Riemann sums. 4) LF: The low frequency (LF) power was calculated as the total signal power in the frequency range of 0.04–0.15 Hz.
5) HF: The low frequency (HF) power was calculated as the total signal power in the frequency range of 0.15–0.40 Hz. 6) LF Norm: The low frequency normalized (LF norm) power was calculated as LF (8) TP − VLF where TP is the total signal power is defined below and VLF is defined as the total signal power at frequencies less than 0.04 Hz. 7) HF Norm: The high frequency normalized (HF Norm) power was calculated LF norm = 100 ×
HF . (9) TP − VLF 8) LF/HF: The low frequency-high frequency ratio (LF/HF) was calculated as LF/HF. 9) TP: The total power (TP) was calculated as the integral of the PSD estimate over the full frequency range of 0.0– 1.5 Hz. This is approximately equal to the variance of d(k). HFNorm = 100 ×
E. Duration Analysis We calculated each of the nine HRV metrics using segments of each 15 min ECG record. The segment durations ranged from 10 s to 10 min. We treated a 5 min segment in the center of each 15 min record (300–600 s) as a short-term ECG baseline record. We selected segments of 5 min or less randomly from the 5 min baseline. We selected segments of more than 5 min randomly from the 15 min record, but the selection was constrained to include all of the 5 min baseline. For each duration, we calculated the percent difference between the HRV metric calculated from the randomly selected segment and the 5 min baseline, �(i, τ ) = 100 ×
m(i, τ ) − mBL (i) σBL
(10)
where �(i, τ ) is the percent difference, i ∈ {1, . . . , 1000} is the record index, τ is the duration of the randomly selected segment, m(i, τ ) is the metric calculated from the randomly selected segment, mBL (i) is the metric calculated from the baseline, and σBL is the sample standard deviation of the metric calculated from the baselines of all 1000 records. F. Reliability Analysis Reliability analysis is a means of assessing what fraction of the variability in observed values is due to measurement error. We used intraclass correlation coefficients (ICC) as our measure of reliability [10], [11]. The ICC is defined as a ratio of explained variation to total variation. The calculation of these coefficients requires repeated measurements of the same entity, but allows for random errors in each measurement. There are several types of ICC that one may choose from depending on the statistical model of the study. We chose a one-way random effects model that can be estimated with an analysis of variance (ANOVA) model II with random factor levels. This treats each observation as a realization of the following random process
213
yij = µi + εij
(11)
TABLE I S UMMARY OF A RELIABILITY ANALYSIS BASED ON A ONE - WAY RANDOM EFFECTS MODEL APPLIED TO MEAN HEART RATE (MHR) AND THE NINE METRICS OF
Metric MHR SDNN HRVTI RMSSD LF HF LFNorm HFNorm LFvsHF TP
σ ˆ 0.068 17.872 2.756 11.547 12.208 9.859 0.089 0.075 28.054 43.532
Hz ms ms s2 s2
s2
HRV.
σ ˆµ 0.149 Hz 19.908 ms 2.631 26.999 ms 14.735 s2 22.007 s2 0.098 0.077 12.877 50.118 s2
ICC (%) 90.6 % 71.3 % 64.6 % 91.6 % 74.4 % 90.9 % 71.0 % 67.7 % 29.6 % 72.6 %
segments. HF and RMSSD had the best overall performance because they both effectively highpass filter the NN interval series and are thereby less sensitive to these effects than the other metrics. The bias and variance of HF and RMSSD were small and comparable to the mean heart rate (MHR). Table I demonstrates that HF and RMSSD were also much more reliable than the other metrics and achieved an ICC comparable to MHR. We did not calculate confidence intervals for the ICC because the 1000 records were not statistically independent. We also note that pairs of 5 min segments spaced 5 min apart are not actually repeated measurements of the same entity since the NN interval series is known to be a nonstationary process. Here we assumed that the process is locally stationary and that the metrics calculated from each pair of segments can be treated as independent samples drawn from the same distribution. V. C ONCLUSION
where i is the record index, j is the measurement index, µ i are independent and normally distributed N (µ . , σµ2 ), εij are independent and normally distributed N (0, σ 2 ), and µi and εij are mutually independent. We treated the metrics calculated from the first (0–300 s) and last (600–900 s) 5 min segments of each 15 min record as a repeated measurement of the same entity. The ICC was calculated as, ρˆ =
σ ˆµ2 MSTR − MSE = 2 MSTR + (M − 1)MSE σ ˆµ + σ ˆ2
σµ2 . σµ2 + σ 2
ACKNOWLEDGMENT This work was partially supported by the Northwest Health Foundation and Friends of Doernbecher. We are grateful to Phyllis Stein and Rochelle Goldsmith for contributing their data to PhysioBank.
(12) R EFERENCES
where M = 2 is the number of measurements per entity, MSTR is the treatment mean square, and MSE is the error mean square. This is an estimate of the true ICC defined as ρ=
We found that HF and RMSSD were substantially less sensitive and more reliable than the other seven HRV metrics considered in this study.
(13)
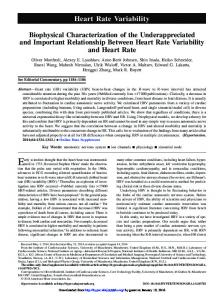
The estimate is biased, but consistent and tolerant of modest departures from normality [10]. Values close to one indicate that the variation between entities is significantly greater than measurement error and values close to zero indicate that the measurement error is too large to accurately discern differences between entities. III. R ESULTS Figure 1 shows the median and three ranges of the percent difference in (10) for ECG segment durations ranging from 10 s to 10 min. Table I lists the results of the reliability analysis. IV. D ISCUSSION The plots in Fig. 1 indicate that all nine of the HRV metrics are sensitive to changes in the duration of the ECG segment. They also show that most of the HRV metrics are biased estimates. This confirms the task force’s claim that metrics calculated from segments of different durations are not comparable [2]. Most of the total HRV is caused by drift and nonstationary effects that cannot be estimated accurately from short
[1] Solange Akselrod, David Gordon, F. Andrew Ubel, Daniel C. Shannon, Clifford A. Barger, and Richard J. Cohen, “Power spectrum analysis of heart rate fluctuation: A quantitative probe of beat-to-beat cardovascular control,” Science, vol. 213, no. 4504, pp. 220–222, July 1981. [2] Task Force of the European Society of Cardiology, the North American Society of Pacing, and Electrophysiology, “Heart rate variability: Standards of measurement, physiological interpretation, and clinical use,” Circulation, vol. 93, pp. 1043–1065, 1996. [3] Azad Ghuran and Marek Malik, “Heart rate variability — state of the art,” Cardiac Electrophysiology Review, vol. 3, pp. 283–285, 1999. [4] J. Philip Saul, “Beat-to-beat variations of heart rate reflect modulation of cardiac autonomic outflow,” News in Physiologic Sciences, vol. 5, pp. 32–37, Feb. 1990. [5] Antti E. Hedman and Juha E. K. Hartikainen, “Has non-linear analysis of heart rate variability any practical value?,” Cardiac Electrophysiology Review, vol. 3, pp. 286–289, 1999. [6] Timothy G. Buchman, Phyllis K. Stein, and Brahm Goldstein, “Heart rate variability in critical illness and critical care,” Current Opinion in Critical Care, vol. 8, no. 4, pp. 311–315, Aug. 2002. [7] Simon C. Malpas, “Neural influences on cardiovascular variability: possibilities and pitfalls,” American Journal of Physiology - Heart and Circulatory Physiology, vol. 282, pp. H6–H20, 2002. [8] Jacqueline M. Dekker, Evert G. Schouten, Peter Klootwijk, Jan Pool, Cees A. Swenne, and Daan Kromhout, “Heart rate variability from short electrocardiographic recordings predicts mortality from all causes in middle-aged and elderly men,” American Journal of Epidemiology, vol. 145, no. 10, pp. 899–908, May 1997. [9] George B. Moody, Roger G. Mark, and Ary L. Goldberger, “PhysioNet: A web-based resource for the study of physiologic signals,” IEEE Engineering in Medicine and Biology Magazine, vol. 20, no. 3, pp. 70–75, May/June 2001. [10] Patrick E. Shrout and Joseph L. Fleiss, “Intraclass correlations: Uses in assessing rater reliability,” Psychological Bulletin, vol. 86, no. 2, pp. 420–428, 1979. [11] Kenneth O. McGraw and S. P. Wong, “Forming inferences about some intraclass correlation coefficients,” Psychological Methods, vol. 1, no. 1, pp. 30–46, Mar. 1996, Corrections in no. 4, pg. 390.
214
150
100
100
SDNN (%)
MHR (%)
150
50 0 Median 25−75% 5−95% 1−99%
−50 −100 0
60
120
180
240 300 360 Segment Duration (s)
420
480
540
50 0 Median 25−75% 5−95% 1−99%
−50 −100 0
600
60
150
100
100
50 0 Median 25−75% 5−95% 1−99%
−50 −100 0
60
120
180
240 300 360 Segment Duration (s)
420
480
540
50
HF (%)
LF (%)
50 0 Median 25−75% 5−95% 1−99%
−50
60
120
420
480
540
HF Norm (%)
LF Norm (%)
100
50 0 Median 25−75% 5−95% 1−99%
−50
240 300 360 Segment Duration (s)
60
120
420
480
540
50
50
TP (%)
LF/HF (%)
420
480
540
600
60
0 Median 25−75% 5−95% 1−99%
−50
420
120
180
240 300 360 Segment Duration (s)
420
480
540
600
(h) High Frequency Power Normalized
100
240 300 360 Segment Duration (s)
240 300 360 Segment Duration (s)
Median 25−75% 5−95% 1−99%
−100 0
600
100
180
180
−50
150
120
600
0
150
60
540
50
(g) Low Frequency Power Normalized
−100 0
480
(f) High Frequency Power
100
180
420
Median 25−75% 5−95% 1−99%
−100 0
600
150
120
240 300 360 Segment Duration (s)
−50
150
60
180
0
(e) Low Frequency Power
−100 0
600
(d) Root of Mean Squared Successive NN interval Differences
100
240 300 360 Segment Duration (s)
540
Median 25−75% 5−95% 1−99%
−100 0
600
100
180
480
−50
150
120
420
0
150
60
240 300 360 Segment Duration (s)
50
(c) Triangular Index
−100 0
180
(b) Standard Deviation of NN Intervals
150
RMSSD (%)
HRVTI (%)
(a) Mean Heart Rate
120
480
540
0 Median 25−75% 5−95% 1−99%
−50
600
−100 0
(i) (Low Frequency Power)/(High Frequency Power) Ratio
60
120
180
240 300 360 Segment Duration (s)
420
480
540
600
(j) Total Power
Fig. 1. Plots of the difference between ten different heart rate metrics calculated from a range of segment durations and a 5 min baseline segment. Plot 1(a) shows the mean heart rate and the other nine plots show HRV metrics. Each plot shows the median difference and three ranges calculated from 1000 15-min records. The differences are shown as a percentage of the standard deviation of metric calculated from the 5 min baseline of all 1000 records.
215