IJSM-03-2006-0107 (smS0107) AK-PDF 24. 1. 2007 eFirst n.a.
Satz Herst. Datum
Ziegler + Müller Hentze 24.01.2007
Physiology & Biochemistry
Effect of Training and Detraining on Heart Rate Variability in Healthy Young Men
Authors
F.-X. Gamelin 1, S. Berthoin 1, H. Sayah 2, C. Libersa 2, L. Bosquet 3
Affiliations
1
2 3
Key words " autonomic nervous system l " training cessation l " physical activity l " Poincaré analysis l
Laboratoire d’Etudes de la Motricité Humaine, Faculté des Sciences du Sport et de l’Education Physique, Université de Lille 2, Ronchin, France Centre d’Investigations Cliniques, Hôpital Cardiologique, Centre Hospitalier Universitaire de Lille 2, Lille, France Department of Kinésiologie, Université de Montréal, Montréal, Canada
Abstract !
The purpose of this study was to investigate the effect of twelve weeks of aerobic training and eight weeks of training cessation on Heart Rate Variability (HRV). Ten healthy young men (Age: 21.7 ± 2.2 years; Height: 179.2 ± 6.9 cm; Mass 72.7 ± 11.1 kg) completed an incremental test and a 608 tilt test during which R-R intervals were recorded before (T0) and after (T12) 12 weeks of intensive training, and after 2, 4 and 8 weeks of training cessation (D2, D4 and D8, respectively). HRV was computed in time and fre-
Introduction !
received
March 22, 2006
Bibliography DOI 10.1055/s-2007-964861 Int J Sports Med 2007; 28: 1 – 7 © Georg Thieme Verlag KG Stuttgart • New York • ISSN 0172-4622 Correspondence François-Xavier Gamelin Faculté des Sciences du Sport et de l’Education Physique, Université de Lille 2 Laboratoire d’Etudes de la Motricité Humaine 9 rue de l’Université 59790 Ronchin France francois-xavier.gamelin@ etu.univ-lille2.fr
[email protected]
Low heart rate variability (HRV), defined as beatto-beat fluctuation in heart rate (HR), is considered as a general risk marker for all common modes of cardiac death: arrhythmic, vascular and hemodynamic [18]. Likewise, it is sensitive to other physiological [26, 42] and psychological disorders [9,11]. Various studies have indicated that enhanced parasympathetic activity at the heart level prevents ventricular fibrillation and provides protection from sudden death [28, 40]. Regular activity is widely accepted as a factor that reduces all-causes of mortality and improves a number of health outcomes [21]. It is well-established that endurance training is the main non-pharmacological mean of increasing HRV, both in primary [30, 37] and secondary prevention [28, 35]. This improvement in cardiovascular autonomic control probably contributes to the exercise-induced cardioprotection [30]. It is however worth noting that this health benefit is not systematic [3]. There is a training stimulus threshold under which cardiovascular [21] as well as autonomic cardiovascular control is not improved sufficiently to impact on cardioprotection [25, 30].
quency domains. Training resulted in a significant increase in estimated V˙O2max after T12 (p < 0.01), followed by a significant decrease during D2 and D8 (p < 0.05). Total power (LF + HF) and low frequency power (LF) increased significantly in the supine position after the training period (p < 0.05) and decreased moderately after D2 (p > 0.05) to stabilize afterwards. LF + HF and LF were not different from T0 at D8 (p > 0.05). It was concluded that eight weeks of training cessation allow to reverse the cardiovascular autonomic adaptations induced by 12 weeks of intensive training in healthy young men.
Available scientific literature suggests that 3 months of moderate aerobic training is appropriate to achieve a sufficient increase of HRV [3]. More interesting is the fact that there are no additional gains after 3 months of a 12 months moderate aerobic training program, even if the training load is increased [19]. The question then arises to determine the consequence of training cessation after such a program in terms of health benefits. Wang et al. [43] reported a reversal of other cardiovascular disease risk markers like maximum oxygen uptake (V˙O2max) or blood cholesterol level after 4 weeks of detraining. The same is true for autonomic control since a decrease of parasympathetic activity at the heart level has been reported in recently trained obese children [14] and in healthy military sailors [15] after 24 and 4 weeks of detraining, respectively. To our knowledge there are no available data dealing with the evolution of HRV with detraining in recently trained men, in order to determine the retention level of cardioprotective benefits with training cessation. Therefore, the aim of this study was to investigate the effect of 12 weeks of aerobic training followed by 8 weeks of training cessation on HRV in healthy young men.
Gamelin F-X et al. Effect of Detraining on Heart Rate Variability in Men … Int J Sports Med 2007; 28: 1 – 7
1
2
Physiology & Biochemistry
IJSM-03-2006-0107 (smS0107) AK-PDF 24. 1. 2007 eFirst n.a.
Satz Herst. Datum
Ziegler + Müller Hentze 24.01.2007
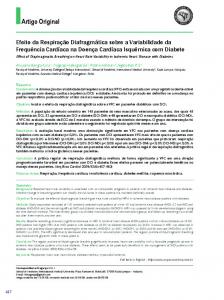
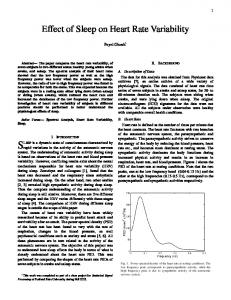
continuous fast running (20 to 30 minutes at 80 – 85 % PTV) and continuous slow running (30 to 50 minutes at 70% PTV). All training sessions were supervised by an investigator who prescribed the adequate training velocity for each subject. The weekly proportion of each type of training session is presented " Fig. 1. After 12 weeks of training, subjects were asked not in l to take part in any regular physical activity for a period of 8 weeks. Dietary intake was not standardized throughout the study, but subjects received an information session from a nutritionist to help them to adapt their usual diet to the specificity of physical training.
Fig. 1 Weekly training load among the training period. White: continuous slow running at 70% of peak treadmill velocity (PTV); Grey: continuous fast running at 85 % PTV; Black: interval training at 110 % PTV.
Methods !
Subjects Fourteen healthy young men gave their written informed consent to participate in this study. Four of them withdrew from the study because of injury during the second or the third month of training. The mean (SD) age, height, weight and % of fat mass of the ten remaining subjects were 21.7 (2.2) years, 179.2 (6.9) cm, 72.7 (11.1) kg and 13.2 (3.3) %. The protocol has been reviewed and approved by the Consultative Committee for the Protection of Human Subjects in Biomedical Research of the Nord Pas de Calais – France.
Experimental design All subjects were submitted to an inclusion protocol before the start of the experiments. This consisted of an information session about the nature, the potential risks involved and the benefits of the study. If the subjects were interested in participating in the study, medical screening was performed, as well as a familiarization with running on a treadmill and controlled breathing on a tilt-table. No subject smoked or used recreational drugs. All subjects were free from any history of cardiac or vascular disease before and at the time of enrolment. Once included, the subjects completed the first day a tilt test and an incremental exercise test the second day before (T0) and after (T12) 12 weeks of training, and after 2, 4 and 8 weeks of detraining (D2, D4 and D8, respectively). To avoid any residual fatigue induced by a recent workout, no strenuous training was scheduled two days before the tests.
Autonomic and cardiovascular testing Head-up tilt test Subjects entered a quiet laboratory room with constant temperature (20 – 23 8C) and dimmed light within 2 hours of waking (between 6 : 00 and 9 : 00 a. m.). They rested comfortably for 15 minutes in a supine position before the 5-minute supine recording and the 10-minute head-up tilt test at 608. They had to match their breathing frequency to an auditory metronome set at 12 breaths • min–1 (0.20 Hz) to improve the reproducibility of HRV parameters and to obtain the same breathing effect on HRV before and after training [2]. No attempt was made to control tidal volume. Intervals R-R were measured continuously using a heart rate monitor (S810, Polar Electro Oy, Kempele, Finland) with an accuracy of 1 ms [36], which had been previously validated in our laboratory [12].
Incremental test One day after the tilt test a discontinuous incremental exercise test was performed on a motorized treadmill (Pulsar 4.0, HP-Cosmos, Nussdorf, Germany). Initial velocity was set at 10 km • h–1 and increased by 1 km • h–1 every 3 minutes until exhaustion. Each stage was separated by a 1 minute period of recovery. Strong verbal encouragement was given throughout the test. The velocity of the last completed stage was considered as the PTV. Oxygen uptake (V˙O2) and related gas exchange measures were determined continuously using an automated cardiopulmonary exercise system (CPX MedGraphics, St. Paul, MN, USA). The metabolic cart was calibrated before each test, using a gas mixture of known concentration (15% O2 and 5% CO2) and ambient air. A blood sample was taken from an antecubital vein catheter at rest, during the first 15 seconds of the recovery from each stage, and 3 and 5 minutes after the cessation of the test to analyse for blood lactate concentration ([La–]b) using an enzymatic method (YSI 1500 Sport, Yellow Springs Instruments, Yellow Springs, OH, USA). The lactate analyzer was calibrated before each test using standard lactate concentrations of 5 and 15 mmol • l–1.
Training Subjects trained 2 to 4 times a week for 3 periods of 4 weeks. Since they were previously untrained, the aim of the first period was to get them accustomed to regular exercise. For this purpose " Fig. 1), the focus being to cretraining load was low and easy (l ate the motivation that will ascertain their psychological involvement until the end of the study. During the 2 remaining periods, subjects trained 4 times a week for 3 weeks, and then decreased their training load from 4 to 2 times a week during the last week of the period. The intensity of training was determined for each individual based on the velocity reached during the last stage of the incremental test (peak treadmill velocity, PTV). Training consisted of interval training (two sets of 14 repetitions of 15 seconds at 110 % PTV with 15 seconds of passive recovery),
Data analysis Analysis of heart rate variability Raw R-R intervals were edited so that artefacts and non-sinus beats could be replaced by interpolation from adjacent normal R-R intervals. The signal was then considered to be normal, and to provide Normal-to-Normal (N-N) intervals. HRV was computed in the time and frequency domains, but also quantitatively from the Poincaré plot analysis.
Time domain analysis A segment of 256 s was selected within the last 300 s of the supine and upright recordings. The mean NN interval, the standard deviation of all NN intervals (SDNN), the root mean square of dif-
Gamelin F-X et al. Effect of Detraining on Heart Rate Variability in Men … Int J Sports Med 2007; 28: 1 – 7
IJSM-03-2006-0107 (smS0107) AK-PDF 24. 1. 2007 eFirst n.a.
Satz Herst. Datum
Ziegler + Müller Hentze 24.01.2007
Physiology & Biochemistry
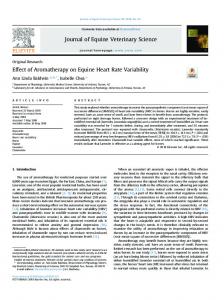
Table 1 Results from the incremental test before (T0) and after (T12) the training period, and after two (D2), four (D4) and eight (D8) weeks of detraining. Values are mean ± SD
PTV (m • s –1) ˙ O 2max (ml • min –1 • kg –1) V [La –] b, peak (mmol • l –1) V 4 mmol·l–1 (m • s –1)
T0
T12
D2
D4
D8
3.93 ± 0.35 50.6 ± 4.7 7.77 ± 1.51 c 3.39 ± 0.32
4.40 ± 0.20 b 56.3 ± 4.0 b 10.00 ± 1.77 b 3.63 ± 0.37 b
4.23 ± 0.28 b, d 54.3 ± 4.1 b, d 8.62 ± 2.17 3.66 ± 0.38 b
4.27 ± 0.25 b 54.8 ± 4.0 b 9.16 ± 1.43 3.62 ± 0.28 b
4.13 ± 0.17 b, c 53.1 ± 2.9 b, c 8.17 ± 2.20 c 3.62 ± 0.29 b
PTV: peak treadmill velocity; [La–]b, peak: peak blood lactate concentration; V4 mmol · l–1: velocity at a blood lactate concentration of 4 mmol • l–1; a: estimated from PTV (see the methods section for the equation); b: significantly different from T0 (p < 0.01); c: significantly different from T12 (p < 0.01); d: significantly different from T12 (p < 0.05)
ferences of successive NN intervals (RMSSD) and the proportion of differences between adjacent NN intervals of more than 50 ms (pNN50) were computed.
Frequency domain analysis The same segments of 256 s were resampled at 2 Hz to obtain 512 sample and detrended for subsequent analysis. As recommended by the Task Force [38], spectral analysis was performed with a Fast Fourier Transform (FFT) to quantify the power spectral density of the low frequency (LF; 0.04 to 0.15 Hz) and the high frequency (HF; 0.15 to 0.40 Hz) bands. Additional calculations included LF + HF, LF and HF expressed in normalized unit (i.e. in a percentage of LF + HF) and the ratio LF/HF.
where v is the velocity (m • s–1) of the last completed stage, a is the increment of the test (m • s–1), n is the duration (s) maintained after the first 60 s of the last stage attained by the subject and b is the duration (s) of this stage. The lactate kinetics during the incremental test was fitted into the following exponential model [17]: [La–]b = a + b • exp (c · velocity)
Eq. 3
where [La–]b is expressed in mmol • l–1 and the velocity in m • s–1. a, b and c are the parameters of the model, which were used to compute V4 mmol · l–1 (m • s–1) from the following equation: V4 mmol · l–1 = [ln (4 – a) – ln b]/c
Eq. 4
Quantitative beat-to-beat analysis The Poincaré plot is a scattergram in which each NN interval is plotted as a function of the previous one. The Poincaré plot provides both a qualitative and a quantitative analysis of HRV. The shape of the plot can be used to classify the signal into one of various classes [31, 41], but also to fit an ellipse, which enables to quantify the parameters SD1 and SD2. SD1 represents the dispersion of the points perpendicular to the line of identity, and it is thought to be an index of the instantaneous beat-to-beat variability of the data. SD2 represents the dispersion of the points along the line of identity, and is supposed to represent the slow variability of heart rate [5, 41]. All analyses were performed with HRV Analysis Software v1.1 (Biosignal Laboratory, University of Kuopio, Finland). Determination of maximal oxygen uptake (V˙O2max), peak treadmill velocity (PTV) and the velocity at a blood lactate concentration of 4 mmol • l–1 (V4 mmol · l-1) Mean values of V˙O2 were displayed every 30 seconds during the test. As suggested by Duncan et al. [10], the primary criteria for the attainment of V˙O2max was a plateau in V˙O2 despite an increase in running velocity. In the absence of a plateau, secondary criteria included a respiratory exchange ratio of 1.15 or greater, and a post-exercise [La–]b of 8 mmol • l–1 or greater [10]. Due to technical reasons, V˙O2 data were not available every time a battery of tests was planned. To allow for comparisons, V˙O2max was estimated from PTV with the American College of Sports Medicine (ACSM) formula [29]:
Statistical analysis Standard statistical methods were used for the calculation of means and standard deviations. Normal Gaussian distribution of the data was verified by the Shapiro-Wilk test, and homoscedasticity by a modified Levene Test. A logarithmic transformation was performed before the analysis when data were skewed or exhibited heteroscedasticity. A general linear model for repeated measures was used to evaluate the effect of training and detraining on HRV and other relevant parameters. The compound symmetry, or sphericity, was checked by the Mauchley test. When the assumption of sphericity was not met, the significance of F-ratios was adjusted according to the GreenhouseGeisser procedure when the epsilon correction factor was < 0.75, or according to the Huyn–Feld procedure when the epsilon correction factor was > 0.75. Multiple comparisons were made with the Bonferroni post-hoc test. The magnitude of the difference was assessed by the Effect Size (ES). Since there was no control group per se, pooled standard deviation was used to compute this statistic. The scale proposed by Cohen [8] was used for interpretation. The magnitude of the difference was considered either small (0.2), moderate (0.5), or large (0.8). Pearson product moment correlation was used to evaluate the association between relevant parameters. Statistical significance was set at p = 0.05 level for all analysis. All calculations were made with Statistica 6.0 (Statsoft, Tulsa, OK, USA).
Results V˙O2 = (3.5 + (0.2 • velocity)) + (velocity • grade • 0.9)
Eq. 1
where V˙O2 is expressed in ml • min–1 • kg–1, velocity in m • min–1 and the grade in %. PTV was calculated from the following equation [24]: PTV = v + (a • n/b)
Eq. 2
! " Table 1. We Results from the incremental test are presented in l found a significant increase of PTV, V˙O2max and V4 mmol · l-1 after the training period (p < 0.01, ES = 0.69 to 1.65), and a progressive reduction toward baseline values with detraining. All of these variables were still significantly higher than T0 at D8 (p < 0.01, ES = 0.73 to 0.75), but V˙O2max and PTV were significantly lower
Gamelin F-X et al. Effect of Detraining on Heart Rate Variability in Men … Int J Sports Med 2007; 28: 1 – 7
3
4
Physiology & Biochemistry
IJSM-03-2006-0107 (smS0107) AK-PDF 24. 1. 2007 eFirst n.a.
Satz Herst. Datum
Ziegler + Müller Hentze 24.01.2007
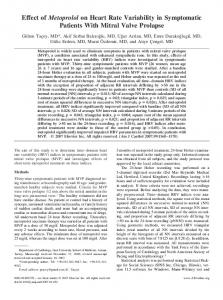
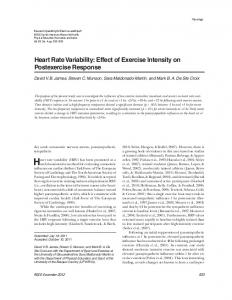
Fig. 2 Effect size of the modifications induced by training and detraining on peak treadmill velocity (PTV) and frequency parameters of HRV. Black: T0 vs. T12, Grey: T12 vs. D2, D4 and D8, respectively; White: T0 vs. D8.
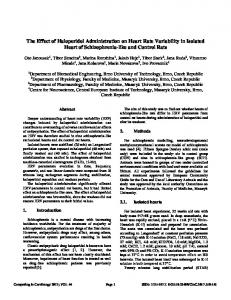
than T12 (p < 0.01, ES = 1.45). The magnitude of the difference across the different phases of training and detraining is shown " Fig. 2 for PTV. in l Concerning the weight and the percentage of fat mass, they did not change significantly after the training and detraining periods (data not reported). The impact of these modifications in aerobic fitness on HRV pa" Table 2 (supine position) and l " Table rameters is presented in l 3 (tilt at 608). We found a significant increase of LH + HF and LF in supine position after the training period (p < 0.05, ES = 0.87 to 1.00), with a reduction toward baseline value with detraining. This increase was not accompanied by any modification in normalized markers (LFn.u., HFn.u) and LF/HF ratio (p > 0.05). It is noteworthy that we found no differences in delta values between supine and standing HRV parameters (data not reported). Time domain and Poincaré graph parameters in supine position where not significantly modified by training. The magnitude of the difference across the different phases of training and detraining of LF + HF, LF and HF in supine position is shown in " Fig. 2. We found no significant modification of HRV during l " Table 3). the tilt at 608, whatever the type of analysis (l
Discussion !
The primary findings from the present study are twofold. 1) Twelve weeks of aerobic training are sufficient to achieve substantial changes in Heart Rate Variability; and 2) only two weeks of detraining completely reverse these adaptations.
Effects of training We found a significant increase of total power (LF + HF) in supine position, suggesting an increase of autonomic regulation at the heart level. This result differs from previous studies reporting that aerobic training does not induce any HRV modification [4, 7, 27]. Aubert et al. [3] already pointed out the fact that training intensity may be an essential factor to take into account to involve autonomic adaptations. It should be noted that most of these studies did not use training intensities higher than 80 % V˙O2max, while we prescribed exercise bouts requiring up to 110 % of PTV, thus suggesting that training intensity is indeed a key variable to involve modification in autonomic modulation of heart rate. The corollary of the large increase in LF + HF (p < 0.05, ES = 0.87) was an even larger increase in LF power (p < 0.05, ES = 1.00), but only a moderate increase in HF (p > 0.05, ES = 0.68). This is consistent with the study by Iwasaki et al. [19], who reported a significant increase in LF power after a training period of 3 months, without a concomitant increase in HF power in 11 healthy recently trained men. Like Iwasaki et al. [19], we also failed to observe any change in normalized frequency domain parameters and LF/HF ratio after training (p > 0.05, ES = 0.18). This finding suggests a quantitative adaptation of the autonomic control of heart rate, as evidenced by the increase in LF + HF, rather than a qualitative adaptation with a modification of the sympathovagal balance [20]. It is, however, surprising to note that most of the studies reporting an increase of HRV also found a shift of the autonomic balance toward a parasympathetic predominance [30, 34, 37, 39]. It
Gamelin F-X et al. Effect of Detraining on Heart Rate Variability in Men … Int J Sports Med 2007; 28: 1 – 7
IJSM-03-2006-0107 (smS0107) AK-PDF 24. 1. 2007 eFirst n.a.
Satz Herst. Datum
Ziegler + Müller Hentze 24.01.2007
Physiology & Biochemistry
Table 2 HRV spectral analysis results in supine position before (T0) and after (T12) the training period, and after two (D2), four (D4) and eight (D8) weeks of detraining. Values are mean ± SD
Time domain " Mean RR (ms) " SDNN (ms) " Mean HR (bpm) " RMSSD (ms) " NN50 (count) " pNN50 (%) Frequency domain " ln (LF + HF) (ms > 2) " ln LF (ms > 2) " ln HF (ms > 2) " LF (n. u.) " HF (n. u.) " LF/HF Poincaré Graph analysis " SD1 (ms) " SD2 (ms)
T0
T12
D2
D4
D8
911 ± 183 62.1 ± 25.3 68.6 ± 13.3 61.3 ± 38.1 83.9 ± 50.9 32.3 ± 24.2
974 ± 164 80.1 ± 33.1 63.4 ± 8.6 78.8 ± 44.2 110.1 ± 48.1 43.3 ± 22.3
987 ± 92 68.6 ± 27.2 61.7 ± 5.8 66.0 ± 28.9 99.3 ± 35.8 38.6 ± 14.8
1 028 ± 123 69.7 ± 22.7 59.4 ± 6.7 71.1 ± 31.1 103.0 ± 40.5 42.6 ± 19.9
1 015 ± 155 77.1 ± 30.3 60.8 ± 8.5 77.9 ± 40.4 111.2 ± 33.1 44.9 ± 17.7
6.40 ± 0.84 5.51 ± 0.86 5.75 ± 0.94 45.2 ± 18.5 54.8 ± 18.5 1.01 ± 0.63 43.8 ± 27.1 85.1 ± 29.4
7.13 ± 0.76* 6.30 ± 0.76* 6.51 ± 0.85 44.7 ± 11.7 55.3 ± 11.7 0.91 ± 0.53 56.2 ± 31.5 114.0 ± 47.5
6.70 ± 0.68 5.81 ± 0.88 6.11 ± 0.63 43.0 ± 14.3 57.0 ± 14.3 0.87 ± 0.55 47.1 ± 20.6 102.0 ± 41.0
6.77 ± 0.71 5.93 ± 0.71 6.17 ± 0.75 44.3 ± 10.6 55.7 ± 10.6 0.85 ± 0.33 50.6 ± 22.2 93.6 ± 27.3
6.88 ± 0.66 5.87 ± 0.74 6.39 ± 0.67 37.8 ± 10.0 62.2 ± 10.0 0.65 ± 0.29 55.5 ± 28.8 113.7 ± 38.8
* different from T0 (p < 0.05)
Table 3 HRV spectral analysis results during the 608 Tilt before (T0) and after (T12) the training period, and after two (D2), four (D4) and eight (D8) weeks of detraining. Values are mean ± SD
Time domain " Mean RR (ms) " SDNN (ms) " Mean HR (bpm) " RMSSD (ms) " NN50 (count) " pNN50 (%) Frequency domain " ln (LF + HF) (ms > 2) " ln LF (ms > 2) " ln HF (ms > 2) " LF (n. u.) " HF (n. u.) " LF/HF Poincaré Graph analysis " SD1 (ms) " SD2 (ms)
T0
T12
D2
D4
D8
731 ± 104 45.1 ± 10.0 84.3 ± 14.2 27.6 ± 8.5 25.0 ± 19.7 7.6 ± 6.7
766 ± 84 56.0 ± 16.0 79.6 ± 8.3 38.9 ± 15.2 63.4 ± 62.8 18.9 ± 16.9
741 ± 120 52.0 ± 23.0 83.2 ± 11.7 32.6 ± 27.0 31.7 ± 40.7 10.7 ± 16.4
751 ± 120 62.4 ± 18.1 81.9 ± 10.6 39.6 ± 21.1 53.9 ± 51.8 17.2 ± 18.7
741 ± 90 58.7 ± 20.4 82.7 ± 10.5 33.1 ± 19.4 37.1 ± 43.7 11.7 ± 15.0
5.95 ± 0.42 5.49 ± 0.68 4.74 ± 0.53 66.3 ± 18.8 33.7 ± 18.8 2.71 ± 1.65
6.14 ± 0.66 5.59 ± 0.78 5.01 ± 0.90 62.8 ± 20.8 37.2 ± 20.8 2.66 ± 2.34
6.11 ± 0.69 5.76 ± 0.50 4.70 ± 1.16 72.3 ± 15.5 27.7 ± 15.5 3.67 ± 2.54
6.53 ± 0.72 6.10 ± 0.71 5.06 ± 1.09 28.6 ± 23.3 71.4 ± 23.3 4.05 ± 2.36
6.20 ± 0.83 5.89 ± 0.77 4.71 ± 1.06 74.9 ± 12.5 25.1 ± 12.5 3.89 ± 2.27
19.7 ± 6.0 66.6 ± 15.7
28.4 ± 11.8 82.2 ± 39.9
23.3 ± 19.2 82.6 ± 39.9
28.4 ± 14.9 94.1 ± 24.0
23.7 ± 13.8 87.7 ± 27.0
* different from T0 (p < 0.05)
should be kept in mind that LF power is an index of both sympathetic and parasympathetic control of the heart (Task Force 1996). Thus, an increase of parasympathetic tone induced by aerobic training is not excluded in our study, even if we observed only a moderate increase of HF power. Mourot et al. [32] reported statistical difference and equal sensitivity to aerobic training for the markers of Poincaré plots SD1 and SD2 and for Fast Fourier Transform spectral analysis. We found only a small and a moderate increase of SD1 and SD2 in supine position after training. Although SD1 and SD2 showed the same pattern as the frequency domain parameters in our " Table 2), our results suggest that frequency domain study (l analysis is more sensitive to training induced modifications than Poincaré plot analysis. In a general manner, it should be kept in mind that Poincaré plot analysis should be considered as equiv-
alent or surrogated to temporal domain parameters rather than an alternative to frequency domain analysis [6]. HRV during the 608 tilt was not significantly affected by training " Table 3). However, it is interesting to note that the magnitude (l of the difference was large for short term variability, particularly in the time domain (ES = 0.88 to 0.92 for RMSSD, pNN50 and SD1), suggesting an enhancement of parasympathetic control of the heart during the tilt. Few studies have investigated the effect of aerobic training on this kind of stimulus in healthy subjects. Mourot et al. [32] observed an increase in time domain parameters and HF power in healthy young men, while Myslivecek et al. [33] reported a decrease in LF/HF in healthy women. Taken together and added to our results, it suggests that aerobic training may increase the parasympathetic control of heart rate during a tilt.
Gamelin F-X et al. Effect of Detraining on Heart Rate Variability in Men … Int J Sports Med 2007; 28: 1 – 7
5
6
Physiology & Biochemistry
IJSM-03-2006-0107 (smS0107) AK-PDF 24. 1. 2007 eFirst n.a.
Effects of detraining Eight weeks of detraining reversed completely training induced adaptation of the LF + HF power spectral density of HRV, most of this loss occurring within two weeks of training cessation. These results are consistent with the work of Pichot et al. [34], who found a return to baseline after 7 weeks of training cessation. It is however noteworthy that Pichot et al. [34] also reported a shift of the autonomic balance toward a more pronounced parasympathetic control, which seemed to be the consequence of a higher decrease of the LF power, while we found no significant differ" Table 2). ence for LFnu, HFnu or LF/HF (p > 0.05) in our study (l As discussed in the limitations section, this discrepancy between both studies was probably a matter of statistical power, since the magnitude of the difference for the LF/HF ratio between the end of the training period of the end of the training cessation period was of the same order between both studies. Taken together, these results suggest that both branches of the autonomic nervous system do not have the same desadaptationn pattern, sympathetic activity decreasing more rapidly than the parasympathetic one. If such a difference exists, it is probably transitional, since Gutin et al. [14] observed a return to baseline of RMSSD after 18 weeks of training cessation in obese children that had been previously trained during 18 weeks. Our results and the current available literature [14, 34] suggest that if aerobic training can result in an enhancement of the cardiovascular autonomic control without any modification in the sympathovagal balance, detraining could involve an abrupt decrease in this autonomic control accompanied by a slow shift toward a parasympathetic predominance until both braches return to baseline values.
Limitations As for many training studies dealing with HRV [3], our study suffers from several limitations. Given the high interindividual variability of HRV parameters, a larger sample size would have allowed to reach a higher statistical power, and then to give a better insight into the effect of both training and detraining on autonomic control of the heart. The withdrawal of 4 of the 14 subjects clearly impacted the statistical power that we were able to provide. The training volume and the training intensity prescribed were consistent with other studies that reported modifications in HRV [19, 30, 32] and with the ACSM prescription [1]. Nevertheless, the effect on HRV was less than expected, and the magnitude of the difference in HRV parameters that responded to the training program was probably not large enough to underline afterwards the detraining effect. One explanation for this weak magnitude could be the hyperbolic relationship between HRV response and cardiovascular parasympathetic activity [13, 22]. The consequence is that cardiovascular parasympathetic activity improvement is more difficult to track in individuals with high baseline value of HRV. Subjects with lower HRV baseline values and a greater training-induced change in HRV [25] would have allowed a better description of the detraining process, from the end of the training period to the return to baseline. In this study, the decrease of HRV parameters seems not to be linear. Nevertheless, the lack of recording makes the interpretation of the HRV changes difficult. An increase of HRV measures (i.e. every week) would allow to precisely define the kinetic of HRV adaptations and desadaptationsn. It has been reported that HRV was sensitive to the season of the year [23]. This study began in the winter to finish in the summer.
Satz Herst. Datum
Ziegler + Müller Hentze 24.01.2007
A control group that did not exercise would have allowed a better control on the effect of time and season on HRV parameters modifications.
Conclusion !
The most important findings of this study are the following: 1) aerobic training enhances the cardiovascular autonomic control without change in the sympathovagal balance, 2) training induced autonomic adaptations decrease as early as the second week of training cessation, to stabilize afterwards. From a practical view, these results suggest that if aerobic training induces beneficial autonomic adaptation at the cardiovascular level, a program of 3 months duration in previously untrained healthy young men is not enough to expect chronic adaptations. Consequently, training has to be continued to maintain these health benefits as long as possible. Home-based exercise programs are probably an effective way [16], but the minimum training load that is necessary not to increase, but just to maintain this cardiovascular protection remains to be determined.
References 1 American College of Sports Medicine Position Stand. The recommended quantity and quality of exercise for developing and maintaining cardiorespiratory and muscular fitness, and flexibility in healthy adults. Med Sci Sports Exerc 1998; 30: 975 – 991 2 Amara CE, Wolfe LA. Reliability of noninvasive methods to measure cardiac autonomic function. Can J Appl Physiol 1998; 23: 396 – 408 3 Aubert AE, Seps B, Beckers F. Heart rate variability in athletes. Sports Med 2003; 33: 889 – 919 4 Boutcher SH, Stein P. Association between heart rate variability and training response in sedentary middle-aged men. Eur J Appl Physiol Occup Physiol 1995; 70: 75 – 80 5 Brennan M, Palaniswami M, Kamen P. Do existing measures of Poincare plot geometry reflect nonlinear features of heart rate variability? IEEE Trans Biomed Eng 2001; 48: 1342 – 1347 6 Carrasco S, Gaitan MJ, Gonzalez R, Yanez O. Correlation among Poincare plot indexes and time and frequency domain measures of heart rate variability. J Med Eng Technol 2001; 25: 240 – 248 7 Catai AM, Chacon-Mikahil MP, Martinelli FS, Forti VA, Silva E, Golfetti R, Martins LE, Szrajer JS, Wanderley JS, Lima-Filho EC, Milan LA, Marin-Neto JA, Maciel BC, Gallo-Junior L. Effects of aerobic exercise training on heart rate variability during wakefulness and sleep and cardiorespiratory responses of young and middle-aged healthy men. Braz J Med Biol Res 2002; 35: 741 – 752 8 Cohen J (ed). Statistical Power Analysis for the Behavioral Sciences. Hillsdale: Lawrence Erlbaum Associates, 1988 9 Dishman RK, Nakamura Y, Garcia ME, Thompson RW, Dunn AL, Blair SN. Heart rate variability, trait anxiety, and perceived stress among physically fit men and women. Int J Psychophysiol 2000; 37: 121 – 133 10 Duncan GE, Howley ET, Johnson BN. Applicability of V˙O2max criteria: discontinuous versus continuous protocols. Med Sci Sports Exerc 1997; 29: 273 – 278 11 Friedman BH, Thayer JF. Autonomic balance revisited: panic anxiety and heart rate variability. J Psychosom Res 1998; 44: 133 – 151 12 Gamelin FX, Berthoin S, Bosquet L. Validity of the Polar S810 heart rate monitor to measure RR intervals at rest. Med Sci Sports Exerc n(in press) 13 Goldberger JJ, Challapalli S, Tung R, Parker MA, Kadish AH. Relationship of heart rate variability to parasympathetic effect. Circulation 2001; 103: 1977 – 1983 14 Gutin B, Barbeau P, Litaker MS, Ferguson M, Owens S. Heart rate variability in obese children: relations to total body and visceral adiposity, and changes with physical training and detraining. Obes Res 2000; 8: 12 – 19 15 Hansen AL, Johnsen BH, Sollers JJ 3rd, Stenvik K, Thayer JF. Heart rate variability and its relation to prefrontal cognitive function: the effects of training and detraining. Eur J Appl Physiol 2004; 93: 263 – 272
Gamelin F-X et al. Effect of Detraining on Heart Rate Variability in Men … Int J Sports Med 2007; 28: 1 – 7
IJSM-03-2006-0107 (smS0107) AK-PDF 24. 1. 2007 eFirst n.a.
16 Hautala AJ, Makikallio TH, Kiviniemi A, Laukkanen RT, Nissila S, Huikuri HV, Tulppo MP. Heart rate dynamics after controlled training followed by a home-based exercise program. Eur J Appl Physiol 2004; 92: 289 – 297 17 Hughson RL, Weisiger KH, Swanson GD. Blood lactate concentration increases as a continuous function in progressive exercise. J Appl Physiol 1987; 62: 1975 – 1981 18 Huikuri HV, Makikallio T, Airaksinen KE, Mitrani R, Castellanos A, Myerburg RJ. Measurement of heart rate variability: a clinical tool or a research toy? J Am Coll Cardiol 1999; 34: 1878 – 1883 19 Iwasaki K, Zhang R, Zuckerman JH, Levine BD. Dose-response relationship of the cardiovascular adaptation to endurance training in healthy adults: how much training for what benefit? J Appl Physiol 2003; 95: 1575 – 1583 20 Janssen MJ, de Bie J, Swenne CA, Oudhof J. Supine and standing sympathovagal balance in athletes and controls. Eur J Appl Physiol Occup Physiol 1993; 67: 164 – 167 21 Kesaniemi YK, Danforth E Jr, Jensen MD, Kopelman PG, Lefebvre P, Reeder BA. Dose-response issues concerning physical activity and health: an evidence-based symposium. Med Sci Sports Exerc 2001; 33: S351 – 358 22 Kiviniemi AM, Hautala AJ, Makikallio TH, Seppanen T, Huikuri HV, Tulppo MP. Cardiac vagal outflow after aerobic training by analysis of highfrequency oscillation of the R-R interval. Eur J Appl Physiol 2006; 96: 686 – 692 23 Kristal-Boneh E, Froom P, Harari G, Malik M, Ribak J. Summer-winter differences in 24 h variability of heart rate. J Cardiovasc Risk 2000; 7: 141 – 146 24 Kuipers H, Verstappen FT, Keizer HA, Geurten P, van Kranenburg G. Variability of aerobic performance in the laboratory and its physiologic correlates. Int J Sports Med 1985; 6: 197 – 201 25 Leicht AS, Allen GD, Hoey AJ. Influence of age and moderate-intensity exercise training on heart rate variability in young and mature adults. Can J Appl Physiol 2003; 28: 446 – 461 26 Lishner M, Akselrod S, Avi VM, Oz O, Divon M, Ravid M. Spectral analysis of heart rate fluctuations. A non-invasive, sensitive method for the early diagnosis of autonomic neuropathy in diabetes mellitus. J Auton Nerv Syst 1987; 19: 119 – 125 27 Loimaala A, Huikuri H, Oja P, Pasanen M, Vuori I. Controlled 5-mo aerobic training improves heart rate but not heart rate variability or baroreflex sensitivity. J Appl Physiol 2000; 89: 1825 – 1829 28 Malfatto G, Facchini M, Bragato R, Branzi G, Sala L, Leonetti G. Short and long term effects of exercise training on the tonic autonomic modulation of heart rate variability after myocardial infarction. Eur Heart J 1996; 17: 532 – 538 29 Medicine ACOS. Guidelines for Exercise Testing and Prescription. n:City? Williams & Wilkins edition, 1995 30 Melanson EL, Freedson PS. The effect of endurance training on resting heart rate variability in sedentary adult males. Eur J Appl Physiol 2001; 85: 442 – 449
Satz Herst. Datum
Ziegler + Müller Hentze 24.01.2007
Physiology & Biochemistry
31 Mourot L, Bouhaddi M, Perrey S, Cappelle S, Henriet MT, Wolf JP, Rouillon JD, Regnard J. Decrease in heart rate variability with overtraining: assessment by the Poincare plot analysis. Clin Physiol Funct Imaging 2004; 24: 10 – 18 32 Mourot L, Bouhaddi M, Perrey S, Rouillon JD, Regnard J. Quantitative Poincare plot analysis of heart rate variability: effect of endurance training. Eur J Appl Physiol 2004; 91: 79 – 87 33 Myslivecek PR, Brown CA, Wolfe LA. Effects of physical conditioning on cardiac autonomic function in healthy middle-aged women. Can J Appl Physiol 2002; 27: 1 – 18 34 Pichot V, Busso T, Roche F, Garet M, Costes F, Duverney D, Lacour JR, Barthelemy JC. Autonomic adaptations to intensive and overload training periods: a laboratory study. Med Sci Sports Exerc 2002; 34: 1660 – 1666 35 Radaelli A, Coats AJ, Leuzzi S, Piepoli M, Meyer TE, Calciati A, Finardi G, Bernardi L, Sleight P. Physical training enhances sympathetic and parasympathetic control of heart rate and peripheral vessels in chronic heart failure. Clin Sci (Lond) 1996; 91 (Suppl): 92 – 94 36 Ruha A, Sallinen S, Nissila S. A real-time microprocessor QRS detector system with a 1-ms timing accuracy for the measurement of ambulatory HRV. IEEE Trans Biomed Eng 1997; 44: 159 – 167 37 Sandercock GR, Bromley PD, Brodie DA. Effects of exercise on heart rate variability: inferences from meta-analysis. Med Sci Sports Exerc 2005; 37: 433 – 439 38 Task Force of the European Society of Cardiology and the North American Society of Pacing and Electrophysiology. Heart rate variability: standards of measurement, physiological interpretation and clinical use. Circulation 1996; 93: 1043 – 1065 39 Tulppo MP, Hautala AJ, Makikallio TH, Laukkanen RT, Nissila S, Hughson RL, Huikuri HV. Effects of aerobic training on heart rate dynamics in sedentary subjects. J Appl Physiol 2003; 95: 364 – 372 40 Tulppo MP, Makikallio TH, Seppanen T, Laukkanen RT, Huikuri HV. Vagal modulation of heart rate during exercise: effects of age and physical fitness. Am J Physiol 1998; 274: H424 – 429 41 Tulppo MP, Makikallio TH, Takala TE, Seppanen T, Huikuri HV. Quantitative beat-to-beat analysis of heart rate dynamics during exercise. Am J Physiol 1996; 271: H244 – 252 42 Vinik AI, Maser RE, Mitchell BD, Freeman R. Diabetic autonomic neuropathy. Diabetes Care 2003; 26: 1553 – 1579 43 Wang JS, Chow SE. Effects of exercise training and detraining on oxidized low-density lipoprotein-potentiated platelet function in men. Arch Phys Med Rehabil 2004; 85: 1531 – 1537
n Author please check variant spellings of: LFn.u. HFn.u. (p. 4) LF (n.u.) HF (n.u.) (Table 2 and 3) LFnu HFnu (p. 6)
Gamelin F-X et al. Effect of Detraining on Heart Rate Variability in Men … Int J Sports Med 2007; 28: 1 – 7
7