Reliability-based Design of Ship Structures: Current Practice and Emerging Technologies By Bilal M. Ayyub*, Ibrahim Assakkaf, Khaled Atua, Allen Engle, Paul Hess, Zbigniew Karaszewski, David Kihl, William Melton, Robert A. Sielski, Michael Sieve, Jack Waldman, and Gregory J. White *Contact Author: Center for Technology and Systems Management Department of Civil Engineering, University of Maryland, College Park, MD 20878, 301-405-1956 Tel, 301-405-2585 Fax,
[email protected]
Table of Contents Table of Contents............................................................................................................................ 1 Abstract ........................................................................................................................................... 2 1. Introduction................................................................................................................................. 2 1.1. History.................................................................................................................................. 2 1.1.1. Hull Girder and Primary Loads..................................................................................... 2 1.1.2. Secondary Loads........................................................................................................... 3 1.2. Systems Framework............................................................................................................. 4 1.3. Reliability-based Design...................................................................................................... 7 1.3.1. History........................................................................................................................... 7 1.3.2. Efforts of the Committee on Marine Structures............................................................ 7 1.3.3. Efforts of the U. S. Navy .............................................................................................. 8 1.4. Objectives .......................................................................................................................... 13 2. Current Practice ........................................................................................................................ 13 2.1. Philosophy and Methods.................................................................................................... 13 2.2. Loads.................................................................................................................................. 14 2.3. Strength .............................................................................................................................. 16 2.4. Analysis.............................................................................................................................. 22 3. Emerging Technology............................................................................................................... 23 3.1. Drivers of Development..................................................................................................... 23 3.2. Risk-Based Analysis .......................................................................................................... 24 3.2.1. Definition of Risk ....................................................................................................... 26 3.2.2. Risk Methods .............................................................................................................. 26 3.3. Reliability, Risk, Safety, and Performance........................................................................ 30 3.4. Hierarchical Safety Goals .................................................................................................. 30 3.5. Reliability-based Design.................................................................................................... 30 3.5.1. Reliability Analysis..................................................................................................... 34 3.5.2. Operational-Sea Profile and Loads ............................................................................. 36 3.5.3. Nonlinear Structural Analysis..................................................................................... 37 3.5.4. Extreme Analysis and Stochastic Load Combinations ............................................... 40 3.5.5. Failure Modes, their Load Effects, Load Combinations, and Structural Strength...... 40 3.5.6. Reliability Assessment Methods................................................................................. 42 3.5.7. Uncertainty Modeling and Analysis ........................................................................... 43 3.5.8. Failure Definitions ...................................................................................................... 44
3.5.9. System Analysis.......................................................................................................... 45 3.6. Hydrodynamics .................................................................................................................. 45 3.6.1. Current and Emerging Technology............................................................................. 46 3.7. Fatigue and Fracture .......................................................................................................... 48 3.8. Design for Production and Maintenance............................................................................ 50 3.9. Sample LRFD Rules for Hull Girder Bending .................................................................. 50 4. Summary ................................................................................................................................... 54 5. Acknowledgment ...................................................................................................................... 54 6. Bibliography ............................................................................................................................. 54
Abstract The development of reliability-based design criteria for surface ship structures needs to consider the following three components: (1) loads, (2) structural strength, and (3) methods of reliability analysis. A methodology for reliability-based design of ship structures is provided in this document. The methodology consists of the following two approaches: (1) direct reliabilitybased design, and (2) load and resistance factor design (LRFD) rules. According to this methodology, loads can be linearly or nonlinearly treated. Also in assessing structural strength, linear or nonlinear analysis can be used. The reliability assessment and reliability-based design can be performed at several levels of a structural system, such as at the hull-girder, grillage, panel, plate and detail levels. A rational treatment of uncertainty is suggested by considering all its types. Also, failure definitions can have significant effects on the assessed reliability, or resulting reliability-based designs. A method for defining and classifying failures at the system level is provided. The method considers the continuous nature of redundancy in ship structures. A bibliography is provided at the end of this document to facilitate future implementation of the methodology.
1. Introduction 1.1. History 1.1.1. Hull Girder and Primary Loads Traditionally, longitudinal strength has been determined by balancing the ship on a static wave. This approach has been widely accepted as an expedient means of simplifying a time dependent dynamic situation into a simple static analysis. The ability to meet operational requirements using a static balance method is implicitly based on the historical success of the method. The standard wave height used by the U. S. Navy in this procedure is 1.1 LBP , where LBP is the length between perpendiculars in feet and 1.1 is an empirical coefficient. The ship is balanced on a trough, resulting in a sagging design condition and on a crest, resulting in the hogging design condition. Longitudinal bending moments and shears are then determined by treating the ship as a free-free beam.
2
Typically a ship is divided into 20 stations between the forward and aft perpendiculars. Cross sectional beam properties and primary stresses are determined for each station. To simplify design calculations a stress envelop is assumed taking the design primary stress limit value as constant throughout some portion of the midbody length dictated by judgement. Fore and aft, the design primary stress tapers to zero. This calculated stress must be below the design stress by a certain stress factor (margin) to account for future growth in displacement. This stress factor varies from 0.5 Tsi to 1.0 Tsi depending on the ship type. The calculated primary stress cannot exceed design stress values, otherwise additional material must be added to lower hull girder stresses. The design primary stress limit, which varies from 8.5 Tsi to 10.5 Tsi depending on material, are based on past experience and are empirical in nature. Indirectly they provide a check on fatigue. As an alternative to the static balance method, the development of criteria based on probabilistic methods is desirable. Such a method offers a unified approach to structural design limiting values for fatigue and maximum environmental loading, defines the dynamic components of the seaway response for specific operational requirements, and establishes probability of exceedance for a given design level. Probabilistic methods are also desirable from the perspective of translating operational requirements, such as area of operation and expected ship life into design loads and strength limits. Fatigue prediction has become increasingly important due to extended ship lives and the greater use of higher strength steels to accommodate increased payload. Both of these trends have resulted in increasing primary stress levels, which in turn cause greater fatigue damage. In a recent naval ship design the requirement for adequate fatigue life translated to a maximum allowable stress range with corresponding structural details. This stress range then defines the minimum hull girder section modulus required. The maximum permissible stress range replaces the design primary stress limit as a fatigue check on primary stress. The maximum permissible range is linked to the service life, the expected construction details and the area of operation assumed for the ship. Traditional practice was to give guidance on structural detailing, specifying standard details by calling out U. S. Navy drawings, and requiring minimum corner radii for openings. Guidance was rather general. 1.1.2. Secondary Loads The Navy has historically used a first principles approach in sizing structure, typical operating secondary loads are combined with primary loads to check structure for yield, buckling, ultimate strength and torsional stability. External hydrostatic loads are treated as static and are determined from empirically based formulas. Typically live loads are historically based pressures, which are bumped up to include motion effects. Tank pressures are based on actual ship parameters, such as the overflow height. Vehicle reactions are covered in great detail; they are calculated using a static balance. The effects of ship motion are included in the calculation of forces on the vehicle. The use of first principles, while more labor intensive then typical Class rules, has provided a more accurate determination of ship structural requirements, and allows for greater freedom and
3
versatility in developing scantlings. Ultimately design criteria which links hydrostatic hull pressures to hull girder bending should be developed. This will allow for consideration of phasing between primary and secondary loads. The probability based secondary loads provides a means of assessing fatigue performance of transverse structure and connections.
1.2. Systems Framework The definition of any system is an essential step in effectively modeling the system. Extraneous information and components that may interfere with the evaluation must be carefully screened. In addition, careful selection of the system is needed so that the important elements of the system are not inadvertently omitted. The omission of vital system components from the analysis could result in inaccurate or misleading findings. For example, a car's engine usually does not require the steering system to be operational for the engine to run. Therefore, if the focus of the analysis is a running engine, then the steering system would not be included in the system definition. If however, the goal were a safely operating automobile, then a properly working steering system would be a necessity when modeling the car. As the preceding example illustrates, the definition of system boundaries is an important first step in performing risk assessment. The boundaries can be based on the objectives of the analysis. Generally, a marine equipment or ship or project can be modeled to include a segment of its environment that interacts significantly with it to define an engineering system. The boundaries of the system are drawn based on the goals and characteristics of the project, the class of performances (including failures) under consideration, and the objectives of the analysis. This primary step in assessing marine systems involves the definition of the architecture of the system. The definition can be based on observations at different system levels that are established based on the goals of the project. The observations can be about the different elements (or components) of the system, interactions among these elements, and the expected behavior of the system. Each level of knowledge that is obtained about an engineering problem defines a system to represent the project. As additional levels of knowledge are added to previous ones, higher epistemological levels of system definition and description are possible which, taken together, form a hierarchy of the system descriptions. An epistemological hierarchy of systems requires a generalized treatment of uncertainty in both the architecture of the system and the collected information. This treatment can be based, in part, on probability and statistical concepts, as well as other related tools. Therefore, engineering systems should be viewed with an understanding of the knowledge content of collected information including its associated uncertainties. Also, the user should understand the limitations of prediction models that result from inherent insufficiency of models as a result of the assumptions used in developing them. The uncertainty dimension in the analysis of engineering systems can result in valuable insight or information that is necessary to make rational decisions. Such a decision process considers the available information or knowledge, decision choices, alternative decision outcomes, and associated uncertainties. Risk analysis requires an organized and repeatable method of system modeling in order to maintain consistent and reasonable risk results. It should be recognized that risk changes with time due to system aging and role of various time-dependent degradation mechanisms such as fatigue, and perhaps due to changes in the interrelation of system components. Therefore, the
4
definition of a system starts with an objective statement in the proper context of the ship system breakdown structure, ship life cycle, system domain, and the sociotechnical system. The system breakdown structure is the top-down hierarchical division of the ship into its components/systems including people, procedures, and equipment. By dividing the ship into major systems and subsystems an organized physical definition of the ship is created. This allows for a better evaluation of hazards and potential effects of these hazards. By evaluating risk hierarchical (top down) rather than fragmented for specific systems, a rational, repeatable, and systematic approach is achieved as described by Omega System Group (1994). It is also essential to define show or consider a maritime domain model that defines the boundary interrelationships and responsibilities of the regulators/managers dependent on the location of the ship. Regulators must control safety within the legislative envelope of their domain and resolve differences in areas of overlapping jurisdiction (Wilcox et al 1996). Along with physical systems, human factors have played a role in contributing risk to the operation of ships. To better understand the influences of external considerations to the physical system it is important to recognize the components of an integrated systems analysis making a ship system embedded within a much larger, more complex metaphysical component of the sociotechnical system. The innermost layer represents the physical system. The interface between the physical system and the people who operate it is called the "human-machine interface." The performance (or safety) of the people and the physical system are influenced by the design, as well as human factors. Moving outward from the center, the personnel subsystem operates in an organizational environment that results from management decisions concerning the organizational/management infrastructure. This infrastructure is in turn controlled by the environmental context which is governed by economics, political science, and legal issues. Understanding component interactions in the integrative safety system analysis offer a true view at systems based analysis of risk. Each system of the ship needs to be recognized for its role and effect on other systems in order to identify risks to the ship. A breakdown of system can be based on functional modeling for the physical system as demonstrated in Figure 1-1 (Ayyub 1997, and Ayyub and Assakkaf 1998). These function requirements of a ship are used to develop a system breakdown. The system breakdown structure is the top down hierarchical division of the ship into its components/systems including people, procedures, and equipment. By dividing the ship into major systems and subsystems an organized physical definition of the ship is created. This allows for a better evaluation of hazards and potential effects of these hazards. By evaluating risk hierarchical (top down) rather than fragmented for specific systems, a rational, repeatable, and systematic approach is achieved. An example breakdown of the ship into systems and subsystems is shown in Figure 1-2. Although the diagram only shows physical systems it is important to recognize that each component of a system is affected by other factors including human factors. A system can be further divided into subsystems. As an example, the hull system can be further divided into the subsystems: structural, ship handling, corrosion abatement, and outfitting. While this breakdown is not complete, it illustrates the hierarchy of the system/subsystem relation.
5
Ship
Serviceability Requirements
Cargo Handling Systems
Operational Profile
Mission Requirements
Lifelines
Mobility
Communication
Mobility
Mobility
Damage Stability
Operational Profile
Safety Requirements
Hazard Abatement Systems
Survivability Requirements
Stability
Figure 1-1. Functional Requirements for a Ship (Ayyub 1997) Ship
Hazard Abatement Systems
Power Generation and Distribution Systems
Hull Systems
Navigation and Communication Systems
Ship Handling System Fire Protection Systems
Flooding Protection Systems
Electrical Power System
Main Propulsion Power system
Navigation and Control Systems
Life Saving Systems
Life Rafts
Life Jackets
Emergency Escape Breathing Devices
External Communicati on System
Generator 1
Generator 2
Ship Services Systems
Outfitting System
Corrosion Abatement System
Internal Communication System
Mission Fulfillment Systems
Strength Structural System
Industrial Mission Systems
Service Mission Systems
Work Station System
Crew Accommodation System
Structural System
Seakeeping Structural System
Commercial Mission Systems
Ballast Systems
Emergency Generator Plates
Longitudinals
Stiffeners Deck
Superstructure
Bulkheads
Frames
Figure 1-2. System Breakdown for a Ship (Ayyub 1997)
6
1.3. Reliability-based Design 1.3.1. History The concept of using the probability of failure as a criterion for structural design can be credited to the Russians N. F. Khotsialov and N. S. Streletskii who presented the idea in the late 1920s. The first exposition of the idea in the United States was made by A. M. Freudenthal in 1947. The concept of probability of failure of ship structure was first introduced by Thomas W. Dunn of Electric Boat Company in 1964 as an illustration in a broader paper on reliability concepts presented to the Society of Naval Architects and Marine Engineers (SNAME). The first full development of reliability-based design of ship structures was made by A. E. Mansour in a 1972 SNAME paper. The paper set out the principles of reliability analysis as applied to ship structures, and identified issues not only concerning the loading (which had been treated previously by others), but in ship strength. A study of reliability of ship structures was made in 1985 for the U.S. Coast Guard by A. H.-S. Ang and Y. K. Wen. However, no application of the theory was made for ship structures, the principal progress was for civil engineering structures and offshore platforms, for which active efforts were made during the 1980s to develop reliability-based design codes. 1.3.2. Efforts of the Committee on Marine Structures The Committee on Marine Structures (CMS) of the National Research Council has for many years recommended research for the purpose of increasing the reliability of ship structures. These research recommendations were requested by the U.S. interagency Ship Structure Committee (SSC), and formed the basis of most of the research sponsored by the SSC. Most of the early work of the SSC involving reliability was concerned with hydrodynamic loading. However, there were several SSC reports dealing with the probabilistic nature of ship strength, report SSC-301 “Probabilistic Structural Analysis of Ship Hull Longitudinal Strength,” completed by J. C. Daidola and N. S. Basar in 1981, and report SSC-322 “Analysis and Assessment of Major Uncertainties Associated with Ship Hull Ultimate Failure” completed in 1984 by the late Dr. Paul Kaplan and others. The first recommendation for a project specifically for reliability-based design came in the recommendations for fiscal year 1987 to develop a tutorial level summary of the state-of-the-art in structural reliability theory specifically directed toward the marine industry (SSC-351). The report serves today as a primer on reliability theory and is a basic starting point for further development of reliability analysis. The CMS recommended and the SSC sponsored a project on the probabilistic nature of loads and load effects (SSC-363). The study examined the unknowns associated with structural analysis, categorizing the errors that can be made as being either random or modeling uncertainties. The first type of uncertainty comes from the nature of processes, including the environment, and the second comes from imperfect knowledge of phenomena as well as the idealizations and simplifications used in analysis procedures. In 1987, the SSC sponsored a Marine Structural Reliability Symposium, which brought forward many papers on the subject of structural reliability, showing the amount of interest in the subject worldwide.
7
With the background of these SSC projects, and recognizing the interest shown in other fields for reliability-based structural design procedures, particularly for bridges, buildings, and offshore platforms, the CMS convened an ad hoc committee with experts in the areas of marine structures and structural reliability, including expertise in the application of reliability-based design in offshore and civil engineering. This committee met on June 17, 1987 at the Massachusetts Institute of Technology, and developed a long-range research program to develop a reliabilitybased approach for ship structures. This program was set out in the annual report of the CMS, “Recommendations for the Interagency Ship Structure Committee’s Fiscal 1991 Research Program,” and had four phases: (1) demonstration project, (2) loads and load combinations, (3) implementations, and (4) novel ships and environments. As these phases were implemented, two new phases were added, “synthesis of the reliability thrust area” and “load and resistance factor design practice.” 1.3.3. Efforts of the U. S. Navy In 1991, recognizing that the recommendations of the CMS for reliability-based structural design were being implemented by the SSC, and that the work indicated promising technology, NAVSEA, under the guidance of A. Malakhoff began development of a program plan to develop a naval ship reliability-based structural design procedure. To aid in this effort, D. P. Chalmers of the Royal Corps of Naval Constructors was assigned to NAVSEA. The core of this effort was provided by the previously developed programs for examination of structural strength and structural loads. The principal addition was reliability analysis, which provided a cohesive framework for coordinating the other two efforts. An ambitious five-year program plan was established and begun in fiscal year 1992. The framework for the development of the reliability-based structural design program was the structural design triangle, first suggested by M. Dick in the mid-1970s, shown in Figure 1-3. LOADS
STRUCTURAL CONFIGURATION
ANALYSIS
ACCEPTANCE CRITERIA Figure 1-3. The Structural Design Triangle
The U.S. Navy plan for development of a reliability-based structural design method has been carried out by CD,NSWC since fiscal year 1992. Many of the reports of the SSC have provided valuable input to this development, although the methods adopted have not followed those of the SSC in every way. Figures 1-4 to 1-6 (prepared by N. Nappi, Jr.) show the interrelationship of SSC projects and the work done at CD-NSWC. Figure 1-4 shows how SSC projects have
8
influenced much of the research in reliability being undertaken by CD-NSWC. Figure 1-5 shows that projects currently underway by the SSC relate to some of the CD-NSWC projects, and Figure 1-6 shows how the CD-NSWC research has taken on some of the projects that the SSC did not sponsor because of limited funds. The general technical community has recently reviewed most of the work done by CD-NSWC at recent workshop in 1998. In this program, reliability methods have been used in the development of reliability-based design formats for structures. Reliability methods take into account more information than their deterministic counterparts in the analysis and design of structural systems. Such information includes uncertainties in the strength of various structural elements, in loads, and modeling errors in analysis procedures. Probability-based design formats are more flexible and consistent than working stress formats because they provide rational safety levels for various types of structures. Designers of civil and offshore structure are currently using these formats, which are called load and resistance factor design (LRFD) formats, to account for uncertainties that are not considered properly by deterministic formats, without explicitly performing probabilistic analysis. The LRFD format consists of the requirement that a factored (reduced) strength of a structural component is larger than a linear combination of factored (magnified) load effects. In this format, load effects are increased, and strength is reduced, by multiplying the corresponding characteristic (nominal) values with factors, which are called strength (resistance) and load factors, respectively. The characteristic value of some quantity is the value that is used in current design practice, and it is usually equal to a certain percentile of the probability distribution of that quantity. The load and strength factors are different for each type of load and strength. The higher the uncertainty associated with a load, the higher the corresponding load factor. These factors are determined probabilistically so that they correspond to a prescribed safety level. It is also common to consider two classes of performance functions that correspond to strength and serviceability requirements. The difference between working stress and LRFD formats is that the latter use different safety factors for each type of load and strength. This allows us to take into account uncertainties in load and strength, and to scale their characteristic values accordingly in the design equation. Working stress formats cannot do that because they use only one safety factor. Ayyub and Atua (1996), Ayyub and Assakkaf (1997), and Ayyub et al (1998) provide details on LRFD rules for ship structures that were developed by CD-NSWC.
9
Structural Reliability Thrusts 6.1/6.2 R&D Fracture
Reliability: Cell Method
6.3 R&D LOADS Analytical Code Development Seaway Loads Prediction Method Validation’ Model Loads Database & Scaling Full Scale & Continuing Trials Primary Hull Girder Load Criteria Secondary Wave Impact Load Criteria STRENGTH Variability of Design & Construction Parameters Compressive Strength of Grillages Fatigue Strength of Ship Structures Fracture Resistance of Ship Structures Overall Strength Analysis Grillage Slamming Strength Compressive Strength f Stiffeners RELIABILITY State-of-the-Art Assessment & Selection of Reliability Theories Implementation of Theory & Software Development Reliability Analysis & Validation Reliability-based Design Criteria
Ship Structure Committee SSC-373 Probability-based Ship Design Procedures: Loads & Load Combinations - 1994 SSC-379 Improved Ship Hull Structural Details Relative to Fatigue - 1994 SSC-318 Fatigue Characterization of Fabricated Ship Details for Design - 1983 SSC-331 Design Guide for Ship Structural Details - 1990 SSC-345 Elastic-Plastic Fracture - 1990 SSC - 337 Ship Fracture Mechanisms - 1990 SSC-381 Residual Strength of Damaged Ship Structures -1995 SSC-382 Re-examination of Design Criteria for Stiffened Plate Panels - 1995 SSC-351 Introduction to Structural Reliability Theory - 1990 SSC-375 Uncertainty in Strength Models for Marine Structures - 1994 SSC-392 Probability-based Ship Design: Implementation of Design Guidelines - 1996 SSC-368 Probability-based Ship Design Procedures: A Demonstration SR-1344 Assessment of Reliability of Ship Structures Initiated 1992
Figure 1-4. Relationship Between U.S. Navy Research and Past Ship Structure Committee Projects
Structural Reliability Thrusts 6.3 R&D LOADS Analytical Code Development Seaway Loads Prediction Method Validation Model Loads Database & Scaling Full Scale & Continuing Trials Primary Hull Girder Load Criteria Secondary Wave Impact Load Criteria Hull Girder Load Criteria STRENGTH Variability of Design & Construction Parameters Fatigue Strength of Ship Structures Fracture Resistance of Ship Structures Overall Strength Analysis Grillage Slamming Strength Compressive Strength of Stiffeners Reliability State-of-the-Art Assessment & Selection of Reliability Theories Implementation of Theory & Software Development Reliability Analysis & Validation Reliability-based Design Criteria
Ship Structure Committee
SR-1388 Sea-Operational Profile for Structural Reliability Assessment
SR-1387 A Predictive Methodology for the Evaluation of Residual Stress and Distortion in Ship Structures SR-1386 Fatigue Resistant Detail Design Guide and Short Course on Fatigue & Fracture Analysis for Ship Structures SR-1385 In-Service Nondestructive Evaluation of Fatigue & Fracture Properties for Ship Structures SR-1383 Failure Definition for Structural Reliability Assessment
Figure 1-5. Relation Between U.S. Navy Research and Ongoing Ship Structure Committee Projects
Structural Reliability Thrusts 6.3 R&D LOADS Analytical Code Development Seaway Loads Prediction Method Validation Model Loads Database & Scaling Full Scale & Continuing Trials Primary Hull Girder Load Criteria Secondary Wave Impact Load Criteria Hull Girder Load Criteria STRENGTH Variability of Design & Construction Parameters Fatigue Strength of Ship Structures Fracture Resistance of Ship Structures Overall Strength Analysis Grillage Slamming Strength Compressive Strength of Stiffeners RELIABILITY State-of-the-Art Assessment & Selection of Reliability Theories Implementation of Theory & Software Development Reliability Analysis & Validation Reliability-based Design Criteria
Ship Structure Committee
96D-U Statistical Characteristics of Strength Properties of Currently Used Marine Structures 96D-V Statistical Characteristics of Geometric Properties of Currently Used Plates & Structural Shapes in Marine Structures 96M-D Specification of Toughness for High Performance Steels in Designs Requiring Ductile Fracture 96D-O Probability-based Design (Phase 6): Novel Hull forms & Environments
Figure 1-6. Relationship Between U.S. Navy Research and Recommended Ship Structure Committee Projects
12
1.4. Objectives The development of reliability-based design criteria for surface ship structures needs to consider the following three components: (1) loads, (2) structural strength, and (3) methods of reliability analysis. A methodology for reliability-based design of ship structures is provided in this document. The methodology consists of the following two approaches: (1) direct reliabilitybased design, and (2) load and resistance factor design (LRFD) sheets. According to this methodology, loads can be linearly or nonlinearly treated. Also in assessing structural strength, linear or nonlinear analysis can be used. The reliability assessment and reliability-based design can be performed at several levels of a structural system, such as at the hull-girder, grillage, panel, plate and detail levels. A rational treatment of uncertainty is suggested by considering all its types. Also, failure definitions can have significant effects on the assessed reliability, or resulting reliability-based designs. A method for defining and classifying failures at the system level is provided. The method considers the continuous nature of redundancy in ship structures. A bibliography is provided at the end of this document to facilitate future implementation of the methodology.
2. Current Practice 2.1. Philosophy and Methods Service life of NAVY ships can vary from 30 to 50 years. Recent ship operability ranges from 25 to 30 %. The Navy ships’ service life is guaranteed by minimizing the likelihood of fatigue cracks. Extensive cracking could lead to early decommissioning of the ship. Minimizing the likelihood of fatigue cracks has the added benefit of reducing maintenance cost and reducing the likely hood of mission disruption. The likelihood of fatigue cracks is minimized by controlling hull girder seaway stress ranges based on the fatigue strength of the ship’s structural details. With Navy ships, the emphasis is on reduced maintenance and manning. The trend is to design for production even though this usually means heavier structure. In terms of environment, Naval ships are designed for world wide operations so extended periods in the open ocean and the arctic are all possibilities. A fatigue allowable stress range must be tied to the ship’s lifetime bending moments. The lifetime bending moments represent the magnitude (hog and sag) and number of vertical bending moments expected during the ships service life. These bending moments included those due to changes in wave height and slam induced whipping. Ship speed and heading probabilities, wave height and whipping probabilities, ship characteristics, service life, operating time and area impact the lifetime bending moments. The lifetime bending moments replace the traditional bending moments based on 1.1 LBP wave. The fatigue allowable stress range is calculated using Miner’s cumulative damage rule, the ship’s lifetime bending moments, and the fatigue strength of the critical structural detail. Miner’s rule is a widely accepted method for calculating damage resulting from cyclic stress. The fatigue allowable stress range replaces the traditional design primary stress envelope. 13
The Navy’s new LPD 17 (Sieve et. al. 1997) used the more tradition approach of ship specifications with scantling drawings for guidance. The ship’s specifications call out design data sheets as acceptable methods of ship structural design. The ship specifications call out the wave induce plus whipping bending moments and require the hull girder stress range be calculated at every station. The specifications also set a maximum permissible stress range based on fatigue. The bending moments in conjunction with the permissible stress range sets the inertia requirements for the hull girder. The ship specifications require that the structure at edges of openings (i.e., locations of stress concentrations) to have 40 year life. Ship specifications give general guidance on structural detailing but no longer specify standard details.
2.2. Loads The current USN design criteria utilizes a standard wave for determining primary stresses. Developed over forty years ago, this approach was established at a time when high speed computers were not available nor was our understanding of physical oceanography or applied statistics as advanced as they are today. Similarly, the methods available for predicting structural response (e.g., fatigue strength and fracture performance) were not available. This standard wave approach determines the design bending moment by statically balancing the ship on a trochoidal wave whose length is equal to the ships length and whose height is equal to 1.1 LBP . The stresses derived from this bending moment are then compared with allowable values and adjusted on a trial-and-error basis, to reflect past experiences with ships already in operation. Although this approach has worked well, this standard wave approach does not specifically account for the effects of transient loads (e.g., whipping, green seas, wave slap), fatigue or their effects on longitudinal distribution of bending moments other than by empirical "rules of thumb". In addition, torsion and associated effects are not addressed. As a result of these uncertainties, the designer has been forced to apply a generous safety margin, particularly at stations forward of midships, to account for effects of slamming. In addition, this design methodology applies only to ships that are within the historical database. We are now beginning to use new structural materials (e.g., high strength steels, composites), develop unconventional ship designs (e.g., SWATH, SES, Advanced Double Hull) and anticipate the need to improve our ships' capability to operate at higher speeds and severe environments for longer durations. Furthermore, there is an ever present demand for lighter, more efficient structures. Although extrapolations of current design methods are possible, there exists a level of uncertainty when one takes an empirically based design procedure and applies it to different ship types, displacements or operational requirements. With the advent of finite element methods the naval architect has the capability to assess these variations in design and/or materials. However, while these analytic techniques can help one evaluate the ability of specific structural members to resist a given load (and hence the consequence of failure of that member) the designer can be lulled into a false sense of security as the probability of failure cannot be determined. Therefore, structural safety needs to be based on an acceptable level of risk that can be defined as the product of the failure probability and of 14
failure consequences. It is clear that an alternate structural design criteria must be developed in order for the naval architect to have a quantitative basis from which appropriate safety levels can be determined. As an interim solution to this problem, one-sided reliability methods have been developed (one sided in the sense that probability distributions are generated for loads only; with strength still being evaluated in a deterministic format). Examples of this approach are discussed by Sikora et. al. (1983) and Shin et. al. (1997). Philosophically, the two approaches are very analogous to each other. Both rely on the use of linear response amplitude operators (RAO’s) for determining low frequency stress variations with slam induced whipping being handled in a somewhat empirical manner. Ultimately the differences between the two methods result from what is considered to be governing to the design. The procedure discussed by Shin outlines the Dynamic Load Approach (DLA) developed by the American Bureau of Shipping. The DLA approach assumes a conventional short-term linear random model of response to waves, and a definition of the wave environment in terms of a scatter diagram. The method addresses the influence of nonlinear rolling upon some of the load components and the impact of pressures on the side shell at the mean waterline. A semiempirical allowance is included to account for the effects of vibration. The methodology by Sikora et. al. (1983) outlines the methods currently in place for determining both first passage failure and ship structural fatigue of U.S. Navy ships. As is the case with DLA, both predict a lifetime maximum load and develop a loads spectrum is required. RAO’s for combinations of speed and heading are used with Ochi’s six parameter sea spectra to determine response functions. These bending moment RAO’s are then used to develop a lifetime load spectrum. Due to the plate thicknesses associated with Navy ships, the effects of pressure variations along the side shell are not considered to be of primary importance. Empirical algorithms are used to account for the effects of slam induced whipping. Prediction of a lifetime maximum whipping load is done by assuming an exponential distribution for extrapolation. As an alternative, the direct calculation of the loads associated with first passage failure is possible if one follows the procedures as outlined by Hay et. al. (1994). This approach assumes that the distribution of the magnitudes of the initial whipping peaks to be best described by a threeparameter Weibull distribution. Thus, the resulting Weibull formulation is expressed as x − x β o P( M ) = 1 − exp − (2-1) θ − xo where, P(M) = probability of exceedence; x = the whipping moment; xo = the threshold value, below which there is no measured data; β = the Weibull shape parameter or slope; and θ = the characteristic value which corresponds to 63.2 percentile of the distribution. In order to develop the database required for such a statistical analysis, time series data is required. The availability of nonlinear time domain programs provides the analyst with the capability to generate such data in lieu of the model test and full-scale trials used by Hay. The results of this analysis used in conjunction with the methods developed by Sikora provides the naval architect with predictions for a lifetime maximum combined wave plus whipping bending moment as well as a load exceedence curve that can be used in fatigue analysis. 15
Primary loads can be divided into three components, still water, wave induced flexure and bow impact whipping. The procedure employed in a recent Navy design was to calculate the still water component using a static balance. Several load cases were considered and the resulting moments were evaluated to produce a moment envelope. With an expected life of 40 years an additional amount of weight was added to the weight distribution equal to the difference between the full load and the limiting displacement. This weight delta was added to the middle portion of the ship corresponding to 15% of the length and to the extreme ends of the ship with 15% of the weight at each end. This certainly brackets the growth of the ship up to its liming displacement (for damage stability). The placement and positioning of the added weight was determined by sensitivity studies and engineering judgement. A probabilistic determination of how to distribute weight for growth would be desirable for future designs. There are several variations of probabilistic methods available for calculating the dynamic response of a ship in a seaway to obtain wave induced flexure, and bow impact whipping. One approach is to divide the total at sea time of the ship into several operational modes (or cells). An operational mode is bounded by a range in ship speed, range in heading relative to the waves and range in wave height (sea state). The structural response is determined for each operational mode up to the worst case situation. Several responses can be determined in this manner such as vertical bending, lateral bending and torsion. Lateral bending or ship rolling is considered in the design by assuming ½ of the stress at the neutral axis, on the shell only. Currently, only vertical and lateral bending moments are considered using the probabilistic method. Slam induced whipping is due to hydrodynamic impact on the bow or keel of a ship. The result is a local increase in hydrodynamic pressure and a high frequency response of the hull girder. The primary response results in a whipping bending moment that is superimposed on the wave induced bending moment. The bow form effects whipping response: fine bow ships slice through the waves, whereas flat bottomed and large bow flared ships have a large amount of flat or near flat surface which results in larger impact forces. Algorithms for determining the lifetime whipping bending moments for both fine bow and bow flair have been developed and employed on a recent naval ship design.
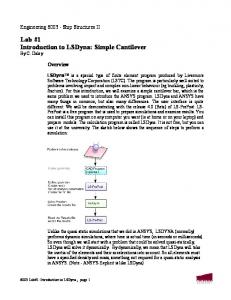
2.3. Strength The ability to predict lifetime bending moments has made significant progress in the last 10 years. However, the lifetime bending moments remain a major source of uncertainty. Different methods for predicting lifetime bending moments can give significantly different results. Table 2-1 and Figure 2-1 compare the vertical bending moments based Navy and American Bureau of Shipping (ABS) approaches for the LPD-17. The moments are based on 7300 days in the North Atlantic. Service life, operating area, and operability have a significant impact on the lifetime bending moments and required strength. As such it is important to benchmark the methodology using successful ship designs.
16
BENDING MOMENT RANGE (10000 FT-TONS)
180 160
ABS NAVY
140 120 100 80 60 40 20
82 6 17 26 36 07 75 36 15 74 5 32 89 6 68 73 14 0 35 9 30 7 00 17 62 68 13 24 09 6 27 22 36 1 57 89 16 11 707 94 3 24 894 95 43 52 3 13 3 69 90
39 5
91
18 9
43
21
5
10
2
1
0
CYCLES
Figure 2-1. Vertical Bending Moment Ranges (in 104 ft-tons) Based on Navy and ABS Methods Table 2-1. Vertical Bending Moment Ranges (in 104 ft-tons) Based on Navy and ABS Methods Number of Cycles Navy ABS 1 103.9436 166.3012 2 99.17701 161.2585 5 94.43605 155.8095 10 89.72169 149.8752 21 85.03501 143.5186 43 80.37719 136.8399 91 75.74952 129.8944 189 71.15342 122.6989 395 66.59047 115.3052 826 62.06242 107.847 1726 57.57123 100.4962 3607 53.11912 93.35163 7536 48.70862 86.35741 15745 44.34264 79.33188 32896 40.02457 72.09383 68730 35.75838 64.58892 143597 31.54886 56.91832 300017 27.40185 49.25727 626824 23.32467 41.74383 1309622 19.32677 34.43466 2736189 15.42093 27.35245 5716707 11.62543 20.55861 11943894 7.969019 14.16048 24954333 4.505331 8.22831 52136990 1.415304 2.69067
17
For a recent ship design, new procedures are used to access primary hull girder strength. The hull girder is checked for adequate section modulus to keep primary flexural stress ranges below the fatigue allowable. Individual structural elements, plate stiffener combinations, are checked to insure adequate ultimate strength to resist UNDEX hull girder whipping. Table 2-2 shows current Navy design criteria that are based on working stresses. The column strength curves cover both elastic and inelastic buckling and provide results similar to other design codes such as AISC or ABS as shown in Figure 2-2. A similar situation exists for the Navy's plate buckling criterion. The Navy uses hand calculations to determine the nominal strength (inertia) of the hull girder versus using full ship FEM models. FEM are used for determining local stresses on a case by case basis. Fatigue strength is dependent on detail and not on the type of steel. Fatigue strength for a structural detail can be determined using an S-N plot. The American Association of State Highway Transportation Officials (AASHTO) provides S-N curves that originated from fullscale test data generated in the 1960’s and 1970’s. The available curves represent over 2300 tests of full-size welded details. The AASHTO curves have been validated recently by tests on large specimens representing United States shipyard fabrication practices. The S-N curves do not have an endurance limit, i.e., on a log-log plot they are linear vice bilinear. The linear curves are used because they more closely represent the variable and random loading behavior experienced by ships operating in a seaway. This has been demonstrated through several Navy tests. All S-N curves represent mean minus two standard deviations. More recently, a Navy ship (i.e., LPD 17) was designed using a probability-based approach to determine the design bending moment and to analyze S-N data. Since LPD 17 was the first Navy conventional monohull ship design that was based on probabilistic methods, both traditional and probability-based methods were used to provide a basis for comparison and to benchmark the design process. Naval ship structure is composed of a complex arrangement of plating and scantlings designed to resist both environmental and combat induced loads. Assessing the strength of ship structure involves a breaking down of the complex arrangement into a framework of interconnecting beams, panels, and columns that can each be analyzed separately on a simpler basis. The adequacy of each structural member is based on specific calculations and various assumptions regarding end fixity at points of support and effectiveness of plating which acts in conjunction with a stiffening member, translation of externally applied loads into internal axial, shear, and bending forces, and translation of the internal forces into internal stresses (USN Design Manual 1979). The modeling details reflect the importance of the piece of structure being assessed and strives to approximate how the structure will behave in service. The procedures used in performing the stress analysis, though computer based, generally employ formulae commonly found in engineering texts. In some instances, finite element models are made to determine service and failure stresses from externally applied loads. Strength is assessed to prevent yielding in the case of tensile loadings and elastic modes of instability under compressive loadings. Fatigue strength is also considered in a strength assessment, but is discussed separately
18
latter. In addition to strength, stiffness and deformation under load are also considered to control vibration, critical alignment of various systems, and fairness of plating. Table 2-2. U. S. Navy Design Requirements Element
Requirement
Tension
All structure
f t ≤ Fb
Tension and Flexure
Combined plate and
f t + f b ≤ Fb
Comment
stiffener Shear
All structural members.
fs ≤ 0.60Fb
Compression
Column
fc ≤ 0.60Fc
Combined plate and
fc ≤ 0.67Fc L/r ≤ 60
Generally applied to stanchions and struts. The yield strength for the combination is the minimum of the plate or stiffener.
stiffener fc ≤ 0.80Fc L/r ≥ 60 Compression and Flexure
fb
Combined plate and
fc
stiffener
+ = 1 L/r ≤ 60
maximum stress in the plating or flange
0.67Fc
Fb
at any location on the member.
fc
fb
The compressive secondary stress is the
+ = 1 L/r ≤ 60 0.80Fc Ultimate Compressive Stress for Compression and Flexure Plate Buckling
Fb
fc + fb ≤ 0.80Fu(Fc/Fy)
f c + f b ≤ Fp
Plate
Compression along the short edge
fs ≤ F s
Compression along the long edge
fc + fb ≤ 0.80 Fp
Typical for transversely framed plating and when the effective width based on shear lag (L/3) is used to calculate bending stresses.
fc ≤ 0.80 Fp
When post buckling effective width (50t) is used in calculating bending stresses.
Symbols Pate Stiffener
Plating
fc = compressive axial stress
fc = the in-plane compressive
Fp = the allowable plate Allowable
buckling stress for compression
fb = compressive / tensile
stress in the plate
Fc = column strength
with shear given
bending stress
fb = the in-plane compressive
Fb = allowable stress
Fs = the allowable plate shear
ft = tensile axial stress
bending stress in the plate
Fy = the yield strength
stress for shear with
fs = shear stress
fb = the in-plane compressive
Fu = the ultimate compressive
compression
bending stress in the plate
strength of the plating
Memeber Properties
fc = the in-plane compressive
L = unsupported span length
stress in the plate
r = minimum radius of gyration
fs = the in-plane shear stress in the plate
19
Comparison of ABS and Navy Buckling Criteria High Strength Steel Fy = 355 360
400
340 350
320 300
300
280
Fp
250
200
150
260
At the upper f ibers plating
240
to 20 mm. Nominal spacing it 600mm with a corresponding b/t
220
range of 30 to 50.
ranges in thickness f rom 12mm
200 30
100
35
40
45
50
55
50
0 0
50
100
150
200
250
b/t Nav y with k =4.0
ABS with k = 4.4
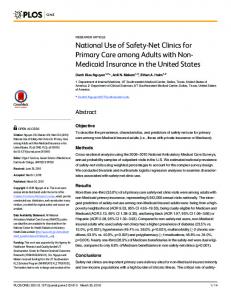
Figure 2-2. Comparison of Buckling Criteria Once isolated into single structural elements, structural adequacy is assessed using loadings which generally consist of primary axial in-plane loads, arising from overall hull girder bending, and secondary bending loads, arising from hydrostatic or equipment loads (DDS 1969). Strength is assessed in tension by combining the primary axial stress acting on the member with the secondary bending stresses and comparing the total stress to the yield strength of the material. Strength in compression is assessed by comparing the total stress to critical stress levels associated with local buckling of the stiffener elements, column buckling of the stiffener acting in conjunction with an effective width of hull or deck plating, and lateral-torsional buckling about an enforced axis of rotation, or tripping of the stiffener about its line of attachment to the plating. The ultimate strength of the hull girder is also assessed. This type of assessment has been made possible through the use of a computer program (Adamchack 1982) which performs an incremental static equilibrium of forces acting over a ship’s cross section in response to an applied incremental increase in hull curvature. The program considers basic modes of failure by structural instability, and is based on empirical load shortening curves to define post-buckling strength. Parameters are included to incorporate the deleterious effects of initial imperfections and residual stresses on the ultimate strength results. Tools of this sort enable ultimate load carrying capacity to be determined under both hog and sag moments. Being an empirically based program, additional capabilities are periodically included as supporting tests are performed. Naval ships have historically been designed implicitly against failure by fatigue and fracture. In the years since the disastrous brittle cracking of the Liberty ships, Naval ships have been fabricated from very tough steels with lower transition temperatures than commercial grades of steel. The use of very tough steels reflects the fact that Naval combatants are often called upon to operate in harms way, a design requirement not generally imposed on commercial ships. Naval ships also employ crack arrestor strakes at the sheer and stringer strakes and also at the 20
port and starboard turns of the bilge. The crack arrestor strakes are typically made of extremely tough steel and essentially separate the ship cross section into four pieces. Crack arrestor strakes are commonly used in Naval ship construction with the reasoning that if a crack were to occur, the crack would soon arrest itself in one of these strakes, protecting the ship from catastrophic failure. Design stresses for primary hull structure1 are also kept to sufficiently low levels to avoid fatigue problems. The value of the primary design stress depends slightly on the material, increasing only slightly with yield strength. An additional stress margin is also incorporated for future growth of the ship. Care is also taken to produce welded connections during design and fabrication that do not contain imperfections and stress risers that would produce crack initiation sites. Although many Naval ship designs have addressed fatigue implicitly, the methodology has produced ships that generally tolerate the forces of the sea very well throughout their service life. The success of this procedure has perpetuated its use, but the empirical database has been limited to conventionally shaped monohulls. The need to produce new designs of Naval ships having configurations different from past ships has led the Navy to recently adopt an explicit safe life approach to fatigue design. The explicit approach involves the generation of lifetime cyclic bending moments from an anticipated operational profile and stress analysis of the ship. The determination of loads is based on spectral analysis methods and transfer functions (Response Amplitude Operators) developed from model and full-scale trials data. Loads associated with bow slamming and subsequent hull whipping are also accounted for and added to the lifetime wave-induced loadings. Miner’s linear cumulative damage rule is then used with appropriate test data to assess the fatigue performance of critical areas of the ship. Test data are based on the representative welded joint details. Stress is typically defined as the nominal far field value, allowing the local stress concentrations to be characterized implicitly within the fatigue test results. Therefore, when applied to points of interest within the hull girder, only nominal stresses need be considered, except for locations such as near openings and major changes in structural geometry. At these locations, stress concentration factors not accounted for in the fatigue tests would need to be incorporated to produce realistic results. Although a universal fatigue criteria has not yet been established, ships have been designed based on a factor of safety on service life with 50% probability of failure, actual service life with a much lower of probability of failure, or a combination of both. Probabilities of failure associated with other than 50% are determined by offsetting the best fit (using linear regression on log(stress) and log(life) data) S/N curve by a multiple of the standard estimate of error. This procedure assumes the logarithms of the fatigue life data follow a normal probability distribution. As such, the best fit S/N curve represents the mean, 50% probability of failure, and other S/N curves associated with different probabilities lie parallel, but offset from the mean S/N curve, by the multiple of the standard deviation. Fatigue and fracture assessment of commercial ships is in many ways very similar to Naval ships. Since the available fracture prediction methodologies are either too impractical or
21
inaccurate to assess the resistance of crack growth and fracture in stiffened plating at the onset of design, the designer’s objective is to avoid crack initiation altogether during the service life of the ship. As with Naval ships, commercial ship fatigue assessments are based on a determination of lifetime loadings, and the use of fatigue S/N curves and Miner’s linear cumulative damage hypothesis (SSC 1997, SSC 318 1983, ABS 1993). Critical joint locations on the hull envelope and internal deck/bulkhead connections are assessed. One slight difference in fatigue performance of commercial versus Naval ships, tends to be crack initiation in commercial ships, at the hull side due to the oscillatory hydrodynamic pressure of passing waves. This problem has not been experienced by Naval ships due presumably to the strength designed into the hull to resist lateral bending. Another difference is the way in which the S/N curve approach is implemented. In addition to using the nominal far field stress approach and an S/N curve associated with a particular type of detail, commercial ships are sometimes assessed using the “hot spot” stress approach. This approach uses the stress in the member times a stress concentration factor to estimate the stress at the toe of a weld. A single S/N curve is then used to assess adequacy in fatigue life. Using this approach, it is easier to associate the stress in the member by using a detailed finite element model. Ship designers usually use an allowable stress based on fatigue analyses, instead of analyzing each critical joint detail individually. Guidance for the fatigue assessment of tanker ships includes allowances for corrosion, and considers the combined effects of primary, secondary and tertiary stress ranges. Primary stresses are those arising from hull bending, secondary stresses arise from stiffener bending and tertiary stresses arise from local bending of plating between stiffeners. To assess fatigue strength, the combined stress is compared to a permissible stress range associated with an assumed (20 year) lifetime distribution of stresses. S/N curves for various details, values of standard deviations from which to specify failure probabilities and additional stress concentration factors to apply for unique connections and misalignments are provided to assess fatigue performance. Permissible stresses are based on Miner’s linear cumulative fatigue damage hypothesis.
2.4. Analysis The output from the load analysis is the lifetime vertical bending moments for ship. These bending moments are in the form of a histogram consisting of values of bending moment ranges with corresponding numbers of cycles. The linear cumulative damage method, i.e., Miner’s rule, is used to develop the fatigue permissible stress range. This damage can be defined by Σni/Ni. The number of cycles to failure of a test component at a given stress range is Ni and the actual cycles imposed on the ship detail at the same stress range is ni. When Σni/Ni > 1 failure results. Failure is defined as crack initiation. Although we recognize that crack initiation is not synonymous with structural failure such as grillage collapse, cracking can disrupt the ship’s mission, and add a significant maintenance burden to the fleet, especially problems in Classes with multiple ships. Calculation of stress and stress combinations for ship design has been done either by hand calculation or simple spreadsheets. Moments and shears from secondary loads are usually calculated from simple beam models. In areas where stress flow is complicated, such as the 22
transition from the strength deck to the superstructure, finite element models have been used to assess stress in that region. Current technology allows models to be developed rather quickly but design criteria is more geared towards 2 dimensional analysis, so interpretation of finite element analysis is still subjective and developmental. In order to prevent premature failure do to local or lateral torsional (tripping) instability structural members are selected which meet breadth to thickness proportions for local buckling and a maximum allowable length for tripping. Selection of members meeting the stability requirements greatly simplifies design for ultimate strength. WT shapes are commercially available which readily met the stability requirements. These shapes were also less costly, by about a 1/3, but heavier than W-T shapes commonly used on other designs. A stress concentration approach was employed in LPD-17 ship design as an alternative for design of longitudinal structure in way of openings. For openings the three prime failure modes are plate stability, local yield due to stress concentration, and fatigue cracking due to stress concentration. This method allows greater freedom in design when compared to traditional rules of thumb regarding spacing and orientation of openings. Stress concentrations can be calculated either by finite element analysis or, for relatively simple configurations, through a series of charts and graphs based on testing and theoretical design procedures. The requirement for fatigue is that the calculated stress concentration factor, the ratio of the peak stress to the nominal stress, must be below the allowable stress concentration factor for fatigue. Allowable stress concentration factors can be tabulated for the fatigue details shown in Table 2-3, allowing the builder to assess various configurations for adequate fatigue strength. Table 2-3. Typical Allowable Stress Concentration Factors and Fatigue Details Fatigue Detail Typical Application Category A machine ground flame cut edge with ANSI smoothness of 25 m or less, totally isolated A from welded attachments, butt welds and other details. A longitudinal fillet weld , such as where an opening is reinforced with a ring and has a B longitudinal fillet weld at the area of peak stress. An unreinforced opening or an opening with an insert plate that has a flame cut edge at the C location of the peak stress. Chocks or vertical stiffeners, shorter than 50 mm, attached to the deck by a fillet weld. Full penetration butt welds, such as formed when reinforcing rings are fabricated from several pieces of flat bar and are butt welded with full penetration welds to form a ring. Non-load carrying attachment from 50 mm to 100 mm long. D Non-load carrying attachment longer than 100 mm and < 25 mm thick, load carrying E attachment < 25 mm thick.
3. Emerging Technology 3.1. Drivers of Development A methodology for the development of reliability-based design criteria for surface ship structures can be constructed with the characteristics and requirements given in Table 3-1 (Ayyub et al 1995). These characteristics and requirements are needed in order to develop design criteria with a rational treatment of uncertainties for surface ship structures. Also, it allows for future 23
enhancements of its components. Other requirements can be added to the list of Table 1 as the development of reliability-based design criteria progresses. New ship concepts e.g. SWATH, have emerged, and new high strength steels have been introduced into ship construction. These developments challenged the utility of the traditional approach. More recently the trend is for extended ship lives and extended time on station (operability). More modern Naval designs are favoring a performance approach without scantling guidance drawings and prescribed structural details. Table 3-1. Characteristics or Requirements for the Methodology (Ayyub et al 1995) Issues Yes Maybe No Comments Reliability at the Systems Level √ Structural Nonlinearities √ Extreme Response √ S-N Based Fatigue √ Mixed Reliability Levels √ Simulation Based Reliability Methods √ Modular Structure for Methodology √ Possibilities of Future Enhancements √ Computability √ The assessment depends on desired Confidence-Level Assessment √ accuracy for confidence levels.
Adequate Uncertainty Treatment Several Failure Definitions Failure Definition at the System Level Stochastic Load Combination Correlated Random Variables Aging Factors (e.g., Corrosion) Interactions Among Failure Modes Ability to Calibrate Methodology
√ √ √ √ √ √ √ √
3.2. Risk-Based Analysis The U.S. marine transportation industry can improve its process for designing its systems, subsystems, and components on which its operations depend by utilizing a risk-based methods and tools. In an environment of increasingly complex engineering systems, the concern about the operational safety of these systems continues to play a major role in both their design and operation. A systematic, quantitative approach for assessing the failure probabilities and consequences of engineering systems is needed. A systematic approach allows an engineer to expediently and easily evaluate complex engineering systems for safety and risk under different operational conditions with relative ease. The ability to quantitatively evaluate these systems helps cut the cost of unnecessary and often expensive re-engineering, repair or replacement of the system. The results of risk analysis can also be utilized in decision analysis methods that are 24
based on cost-benefit tradeoffs. The marine industry needs in these areas were recently discussed by Ayyub (1997). For marine systems, there are many influences that affect system safety. Sources of risk include equipment failure, external events, human errors, and institutional error (Wilcox et al 1996). Equipment failure is the most recognized hazard on ships and can be divided into several subcategories including independent failures and common cause failures. An example of independent equipment failure is the loss of steering due to failure of a power steering pump. An example of a common cause failure includes the loss of propulsion and steering that would result from a total loss of electrical power to the ship. Risk from external events are caused by the hazards such as collision by other ships, sea state, wind, ice, or weather factors. Humans provide another source of risk to ships due to lack of skill, mistakes, fatigue, or sabotage. Institutional failure represents risks from poor management including training, management attitude, poor communications, and morale. The relationship between risk and standards is not new and its definition is dependent on the point of view of observers. To better appreciate this dilemma we must take a look at risk and standards from a historical perspective. People have always sought to eliminate unwanted risk to health and safety, or at least control it. Great successes have been achieved in controlling risk, as evidenced by advances made in the development of building methods of skyscrapers and long span bridges or super tankers capable of withstanding powerful storms. Yet some of the familiar risks persist while others less familiar are found to escape our attention and new ones have appeared. Ironically, some of the risks that are most difficult to manage are those that provide us with increased standards of leaving. The invention of automobile, the advent of air travel and space exploration, the development of synthetic chemicals, and introduction of nuclear power all are examples. Risk studies requires the development of analytical methods at the system level that considers subsystems and components. In an environment of increasingly complex engineering systems, the concern about the operational and extreme-events safety of these systems continues to play a major role in both their design and operation. A systematic, quantitative approach for assessing the failure probabilities and consequences of engineering systems is needed. A systematic approach allows an engineer to expediently and easily evaluate complex engineering systems for safety and risk under different operational and extreme conditions with relative ease. The ability to quantitatively evaluate these systems helps cut the cost of unnecessary and often expensive reengineering, repair, strengthening or replacement of the system. The results of risk analysis can also be utilized in decision analysis methods that are based on cost-benefit tradeoffs. For marine systems, there are many influences that affect system safety. Sources of risk include equipment failure, external events such as extreme waves and extreme loads, human errors, and institutional errors. These sources can be divided into several sub-categories including independent failures and common cause failures. An example of independent equipment failure is the loss of an engine. An example of a common cause failure includes the loss of several pieces of equipment due to a storm. Humans provide another source of risk to marine systems due to lack of skill, mistakes, fatigue, or sabotage. Institutional failure represents risks from poor management including training, management attitude, poor communications, and morale.
25
3.2.1. Definition of Risk The concept of risk is used to assess and evaluate uncertainties associated with an event. Risk can be defined the potential of losses as a result of a system, and can be measured as a pair of the probability of occurrence of an event, and the outcomes or consequences associated with the event’s occurrence. This pairing can be represented by the following equation: Risk ≡ [( p1 ,C 1 ),( p 2 ,C 2 ),..., ( p x ,C x )] (3-1) In this equation px is the occurrence probability of event x, and cx is the occurrence consequences or outcomes of the event. Risk is commonly evaluated as the product of likelihood of occurrence and the impact of an accident: Consequence Event Consequence RISK (3-2) × IMPACT = LIKELIHOOD Time Event Time In the above equation, the likelihood can also be expressed as a probability. A plot of occurrence probabilities that can be annual and consequences is called the Farmer curve (1967). The risk for a system results from the interaction of natural hazards with a system, aging and degradation of the systems, and human and organizational factors. Consequently, risk can be classified into voluntary and involuntary depending whether the events leading to the risk are under the control of the persons at risk or not, respectively. Society, in general, accepts a higher level of voluntary risk than involuntary risk. The losses associated with events can be classified into reversible and irreversible such as property and human losses, respectively. The population-size effect should be considered in risk studies since society responds differently for risks associate with a large population in comparison to a small population. For example, a fatality rate of 1 in 100,000 per event for an affected population of 10 results in an expected fatality of 10-4 per event whereas the same fatality rate per event for an affected population of 10,000,000 results in an expected fatality of 100 per even. The impact of the two scenarios is not the same on the society. The size of the population at risk should be considered as a factor is setting the acceptable risk level. 3.2.2. Risk Methods Risk methods can be classified into risk management that includes risk assessment and risk control, and risk communication as shown in Figure 3-1.
26
Risk Methods
Risk Management
Risk Assessment
Risk Analysis: Hazard Identification Risk Estimation
Risk Communication
Risk Control:
Engineering Community
Decision Making Monitoring
Risk Evaluation:
Media and Public
Risk Acceptance Option Analysis
Figure 3-1. Risk Methods The risk assessment includes risk analysis and risk evaluation. The risk analysis consists of hazard identification, event-probability assessment, and consequence assessment. Risk evaluation requires the definition of acceptable risk, and comparative evaluation of options and/or alternatives. The risk control can be achieved through monitoring and decision analysis. Risk communication depends on the targeted audience, hence, classified into risk communication to the media and the public and to the engineering community. The risk assessment process answers three questions including: (1) What can go wrong? (2)What is the likelihood that it will go wrong? (3) What are the consequences if it does go wrong?. In order to perform risk assessment several methods have been created including: Preliminary Hazard Analysis (PrHA), HAZOP, Failure Modes and Effects Analysis (FMEA), Fault Tree Analysis (FTA), and Event Tree Analysis (ETA). Each of these methods is suitable in certain stages of the systems life-cycle. The characteristics of these methods are shown in Table 3-2 (Wlicox et al 1996). Other methods for reliability and consequence analysis and assessment are described by Kumamoto and Henley (1996). The reliability of a system can be improved or hindered by the combination of individual elements in a system. Therefore, the occurrence probability and consequence are used to determine the risk associated with the system. When applying risk-based technology (RBT) to dam system safety, the following interdependent primary activities are needed: (1) risk assessment, (2) risk management, and (3) risk communication. These activities when applied consistently provide a useful means for developing safety guidelines and requirements to the point where hazards are controlled at predetermined levels.
27
Table 3-2. Risk Assessment Methods (Wlicox et al 1996) Safety/Review Audit Identify equipment conditions or operating procedures that could lead to a casualty or result in property damage or environmental impacts.
Checklist Ensure that organizations are complying with standard practices.
What-If Identify hazards, hazardous situations, or specific accident events that could result in undesirable consequences.
Hazard and Operability Study (HAZOP) Identify system deviations and their causes that can lead to undesirable consequences. Determine recommended actions to reduce the frequency and/or consequences of the deviations.
Failure Modes and Effects Analysis (FMEA) Identifies the components (equipment) failure modes and the impacts on the surrounding components and the system.
Fault Tree Analysis (FTA) Identify combinations of equipment failures and human errors that can result in an accident.
Event Tree Analysis (ETA) Identify various sequences of events, both failures and successes, that can lead to an accident.
Preliminary Hazard Analysis (PrHA) Identify and prioritize hazards leading to undesirable consequences early in the life of a system. Determine recommended actions to reduce the frequency and/or consequences of prioritized hazards.
Consequence Assessment and Cause Consequence Diagrams Assess consequences and scenarios leading to them.
3.2.2.1. Risk Assessment Risk assessment is a technical and scientific process by which the risk of given situations for a system are modeled and quantified. Risk assessment provides qualitative and quantitative data to decision makers for later use in risk management. Selected and commonly used risk assessment methods are shown in Table 3-2. These methods can also be divided into how the risk is determined by quantitative or qualitative analysis. Qualitative risk analysis uses expert opinion to evaluate the probability and consequence of a hazard. Quantitative analysis relies on statistical methods and databases that identify the probability and consequence of a hazard. Safety Review/Audit, Checklist, What-If, Preliminary Hazard Analysis and HAZOP are normally considered qualitative techniques. Failure Modes and Effects Analysis, Fault Tree, and Event Tree are generally considered quantitative risk assessment techniques. The selection of a quantitative or qualitative method depends upon the availability of data for evaluating the hazard and the level of comfort of those performing the risk assessments. 3.2.2.2. Risk Management Risk management is the process by which system operators, managers, and owners make safety decisions, regulatory changes, and choose different system configurations based on the data generated in the risk assessment. Risk management involves using information from the previously described risk assessment stage to make educated decisions about different configurations and operational parameters of a system. Therefore, the safety of the system can be maintained, and the involved risks in operating the system can be controlled. 28
Risk management makes decisions based on risk assessment and other considerations including economical, political, environmental, legal, reliability, producibility, safety, and other factors. Despite societies attempt at preventing accidents, governmental agencies can be reactive in the development of regulations. The answer to the question "How Safe is safe enough?" is difficult and changing due to different perceptions and understandings of risk. Unfortunately, it often takes a disaster to stimulate action for safety issues. Although communication is necessary, it is important that risk management is separate from risk assessment in order to lend credibility to the assessment of risk without biasing the evaluation in consideration for other factors. Especially in a qualitative assessment of risk where "expert judgment" plays a role in decisions, it is important to allow the risk assessors to be free of the "political' pressures that managers encounter. However, there must by communication linking the risk assessors and risk managers together. The risk assessors need to assist the risk managers in making a decision. While the managers should not be involved in making any risk assessment, they should be involved in presenting to the assessors what needs to be answered. In order to determine "acceptable risk" there are several steps that should be considered (Derby and Keeney 1993): (1) define alternatives, (2) specify the objectives and measures for effectiveness, (3) identify consequences of alternative, (4) quantify values for consequences, and (5) analyze alternatives to select the best choice. Risk managers need to weigh various other factors. For example suppose a manager will make a decision based on cost and risk using decision trees (Ayyub and McCuen 1997). 3.2.2.3. Risk Communication Risk communication can be defined as an interactive process of exchange of information and opinion among individuals, groups, and institutions. This definition of risk communication delineates it from risk-message transmittal from experts to non-experts. Risk communication should be an interactive, i.e., two-way, process (NRC 1989). However, this definition does not make it easy because technical information about controversial issues needs to be skillfully delivered by risk managers and communicators who might be viewed as adversaries to the public. Risk communication between risk assessors and risk managers is necessary to effectively apply risk assessments in decision making. Risk managers must participate in determining the criteria for determining what risk is acceptable and unacceptable. This communication between the risk managers and risk assessors is necessary for a better understanding of risk analysis in making decisions. Risk communication provides the vital link between the risk assessors, risk managers, and the public to help understand risk. However, there is a common misconception that risk communication can lead to harmony among the involved parties which is not necessarily true all the time. Risk communication is a complex dynamic process that needs to be handled with extreme care by experts especially after disasters. Risk managers need to establish contingency plans for risk communication for disasters. The added pressure by the media and public in a disaster situation can create miscommunication that might be difficult to undo nor remedy.
29
3.3. Reliability, Risk, Safety, and Performance Reliability of a system can be defined as its ability to fulfill its design functions for a specified time period. This ability is commonly measured using probabilities. Reliability is, therefore, the occurrence probability of the complementary event to failure resulting into Reliability = 1 – Failure Probability (3-3) Based on this definition, reliability is one of the components of risk. Safety can be defined as the judgement of risk acceptability for the system making it a component of risk management. After performing risk and safety analysis, system improvement in terms of risk can be achieved by one or more of the following cases: (1) consequence reduction in magnitude or uncertainty, (2) failure-probability reduction in magnitude or uncertainty, and (3) reexamination of acceptable risk. it is common in engineering that attention is given to failure-probability reduction in magnitude or uncertainty because it offers more system variables that can be controlled by analysts than the other two cases. As a result, it is common to perform reliability-based design of systems. However, the other two cases should be examined for possible solution since they might offer some innovative system improvement options. The performance of a systems can be defined by a set of requirements stated in terms of tests and measurements of how well the system serves various or intended functions. Reliability and risk measures can be considered s performance measures.
3.4. Hierarchical Safety Goals Dams can be treated as systems consisting of subsystems, components, and failure modes. A safety goal for a dam system can be defined in a parallel hierarchical format. An upper safety goal for the dam system needs to be allocated to the lower levels by assigning acceptable failure probabilities, and/or limiting failure consequences. The hierarchical allocation of safety is not necessarily a simple matter and can be achieved using cost-benefit analysis. The upper safety goal needs also be defined for an individual and for the population. For example, an individual risk can be set to some fatality rate (Li) such as 1 in 100,000 per event whereas the population risk can be set to a total fatality number (Lp) of 100 per event regardless of a population size p. These two limits can be defined as Li = 10-5 per event for one person/year (3-4a) Lp = 100 per event for population size p/year (3-4b) A geometric limit (Lg) can therefore be defined as Li L p per event for one person/year (3-5) Lg = p
3.5. Reliability-based Design The development of a methodology for reliability-based design of ship structures requires the consideration of the following three components: (1) loads, (2) structural strength, and (3) methods of reliability analysis. Figure 3-2 shows an outline of a suggested methodology for reliability-based design of ship structures. Two approaches are shown in the figure, (1) direct reliability-based design, and (2) load and resistance factor design (LRFD) rules (or sheets). The three components of the methodology are shown in the figure in the form of several blocks for 30
each. Also, the figure shows their logical sequence and interaction. The first approach can include both Level 2 and/or Level 3 reliability methods. Level 2 reliability methods are based on the moments (mean and variance) of random variables. Whereas, Level 3 reliability methods use the complete probabilistic characteristics of the random variables. In some cases, Level 3 reliability analysis is not possible because of the lack of complete information on the full probabilistic characteristics of the random variables. Also, computational difficulty in Level 3 methods sometimes detracts from their uses. The second approach (LRFD) is called a Level 1 reliability method. Level 1 reliability methods use safety factors that are reliability based; but the methods do not require explicit use of the probabilistic description of the variables. The two reliability-based design approaches start with the definition of a mission and an environment for a ship. Then, the general dimensions and arrangements, structural member sizes, scantlings, and details need to be assumed. The weight of the structure can then be estimated to ensure its conformance to a specified limit. Using an assumed operational-sea profile, the analysis of the ship produces a stochastic stillwater and wave-induced responses. The resulting responses can be adjusted using modeling uncertainty estimates that are based on any available results of full-scale or large-scale testing. The two approaches, beyond this stage, proceeds in two different directions. The direct reliability-based design approach requires performing extreme analysis of the loads. Also, linear or nonlinear structural analysis can be used to develop a stress frequency distribution. Then, stochastic load combinations can be performed. Linear or nonlinear structural analysis can then be used to obtain deformation and stress values. Serviceability and strength failure modes need to be considered at different levels of the ship, i.e., hull girder, grillage, panel, plate and detail. The appropriate loads, strength variables, and failure definitions need to be selected for each failure mode. Using reliability assessment methods, failure probabilities for all modes at all levels need to be computed and compared with target failure probabilities. The LRFD rules approach requires the development of response (load) amplification factors, and strength reduction factors. The development of these factors is shown in Figure 3-3 using a reliability analysis that is called calibration of design rules. Figure 3-2 shows the use of these factors in reliability-based design. The load factors are used to amplify the response, and strength factors are used to reduce the strength for a selected failure mode. The implied failure probabilities according to these factors are achieved by satisfying the requirement that the reduced strength is larger than the amplified response. Therefore, the LRFD rules can be used by engineers without a direct use of reliability methods. The background reliability effort in developing these factors is shown in Figure 3-3. The above two approaches require the definition of a set of target reliability levels. These levels can be set based on implied levels in the currently used design practice with some calibration, or based on cost benefit analysis.
31
Operational-Sea Profile
Define Mission and Environment Linear or Nonlinear Structural Analysis
Operational-Sea Profile Define Principal Dimensions and General Arrangement
A
Assume Sizes, Scantlings & Details
Cumulative Damage
Stress Frequency Distribution Strength Reduction Factor
Estimate Weight
Select Fatigue Details
LRFD Load Amplification Factors Analysis of Ship Motion
Modeling Uncertainty
Development of Response (Load) and Strength Factors (Fig. 2)
Stillwater, and Wave-Induced Response
Fatigue Data for Deatils
Temperature Deformation and Stresses Fracture Data Failure Probability in Fatigue
Failure Definition for Fracture
Failure Definition for Fatigue
Fatigue OK?
Stresses or Forces for Plates, Panels, Grillages, and Hull Girder
Failure Definitions in Servicebability & Ultimate Strength for Plates, Panels, Grillages, and Hull Girder
Failure Probability in Fracture
No
Structural Analysis
Material Properties and Imperfections
Stochastic Response Combinations
Linear or Nonlinear Structural Analysis
LRFD Response Combinations Combined Response
Extreme Response Analysis
Stress Frequency Distribution
Fatigue Data for Details
Temperature Strength Reduction Factor
Failure Probability in Serviceability or Ultimate Strength
Reduced Strength of Plates, Panels, Grillages, and Hull Girder
System Analysis to Obtain Failure Probability for Ship
Fracture Data
Fracture OK? Yes No
A
A
No
Reliability Levels OK?
Yes
Revised Weight OK?
Yes
No
Strength OK?
A
A
End
Direct Reliability-Based Design
Yes
No Yes
End
Load and Resistance Factor Design (LRFD) Sheets
Figure 3-21. Reliability-Based Design of Ship Structures
32
Select a failure mode for a structural level or component (such as hull girder, grillage, panel, plate, or detail) Select a representative group of components from a population of such components
Assign weight factors to account for relative occurrence of components
Define load combinations that are relevant to failure mode and structural components
Estimate failure probability implied in current design practice for the selected failure mode and components
Reliability assessment methods
Assess variations in failure probabilities due to variations in load ratios and material properties Target reliability levels
Reliability methods for determining load and strength factors
Determine load and strength factors with desired reliability levels
Perform parametric analysis on factors
Select factors
Design selected components
Adjust factors
No
Are reliability levels OK ?
Yes
Perform final testing and adjustment
Figure 3-3. Calibration of Design Rules
33
3.5.1. Reliability Analysis The reliability analysis of ship structures requires knowing the probabilistic characteristics of the operational-sea profile of a ship, its structural system and strength, and failure modes and failure definitions. Also, tools of probabilistic and reliability analyses are needed. Figure 3-4 shows an outline for reliability analysis of ship structures that deals with several failure modes. The outline can be broken down into the following modules: 1. Operational-sea profile and loads 2. Nonlinear structural analysis 3. Extreme analysis and stochastic load combination 4. Failure modes, their load effects, load combinations, and structural strength 5. Library of probability distributions 6. Reliability assessment methods 7. Uncertainty modeling and analysis 8. Failure definitions 9. System analysis Each module can be independently investigated and developed. Although, some knowledge about the details of other modules is needed for the development of a module. In this section, these modules are briefly described.
34
Library of Probability Distributions
Loads
Extreme Analysis
Random Operational-Sea Profile
Basic Strength Variables, and Imperfections
Load Combinations
Temerature Requirements and Data Load Encounters
Importance Sampling Simulation
Nonlinear Structural Analysis
Selective Sampling Simulation
Stresses at Critical Locations Modeling Uncertainty for Extreme Response
System Failure Definitions for Extreme Response
Fuzzy-Based Neural (or Adaptive) Failure Recognition at the System Level
Fatigue & Fracture Data
Modeling Uncertainty for Fatigue & Fracture
Fuzzy Failure Probability for Extreme Response
Failure Probability for Fatigue or Fracture
System Failure Definitions for Fatigue & Fracture
Experts in Failure Recognition and Definitions
Failure Probability for Extreme Events Combined Failure Probability at the System Level
Figure 3-4. Reliability Analysis of Ship Structures
35
3.5.2. Operational-Sea Profile and Loads The loads of naval ships can be classified into (1) gravity loads, (2) sea-environmental loads, (3) operational loads, and (4) combat loads. These loads are shown in Figure 3-5. Gravity loads include, for example, dead and live loads, liquid loads in tanks, and equipment loads. The seaenvironment loads are due to buoyancy, passing waves, slamming, whipping, heeling, pitch, and green seas. The operational loads include flooding, and special loads such as aircraft landing and docking. Combat loads can be due to underwater explosion, nuclear air blast, fragments and projectiles, and the effects of a ship's own weapon systems. Loads for Naval Ships
Gravity Loads
Live Loads Dead Loads Liquid/Tank Loads Equipment Loads
Sea-Environment Loads
Buoyancy Loads Passing Waves Slamming Whipping Heeling Pitch & Green Seas
Operational Loads
Flooding Aircraft Landing Docking
Combat Loads
Underwater Explosions Air Blast (Internal or External) Fragments Own Weapons Effect
not considered
Figure 3-5. Loads for Ship Structures The definition of loads for a ship requires the knowledge of its operational-sea profile. This profile can be defined based on its mission. Figure 3-6 shows the interactions among the mission definition, profile definition, ship operators, and loads.
36
Loads for Naval Ships
Gravity Loads
Live Loads Dead Loads Liquid/Tank Loads Equipment Loads
Operational Loads
Sea-Environment Loads
Buoyancy Loads Passing Waves Slamming Whipping Heeling Pitch & Green Seas
Combat Loads
Underwater Explosions Air Blast (Internal or External) Fragments Own Weapons Effect
Flooding Aircraft Landing Docking
Head Seas
Operational-Sea Profile provided for each heading
0.1 0.09 0.08
Frequency Frequency
0.07
Mission
0.06 0.05 0.04 0.03 0.02 High
0.01 0
Medium Low
not considered
Operators
SpeedSpeed
Low
Medium
Sea State Sea State
High
Figure 3-6. Operational-Sea Profile, and Loads for Ship Structures 3.5.3. Nonlinear Structural Analysis In this module, linear or nonlinear loads for naval ships are used to obtain load effects (or responses) from linear or nonlinear structural analyses. Figure 3-7 shows a classification of loads for obtaining the structural responses. The type of nonlinear structural analysis depends on the level of analysis for a ship. Five levels are shown in Figure 3-7. They are the hull girder, grillage, panel, plate, and detail. The structural response can be classified into (1) stillwater, (2) passing wave, (3) wave whipping, and (4) wave slamming. The response classification is needed to deal with the frequency of the response and the levels of the structure that it affects. Figure 6 shows an outline for obtaining the structural responses. The method of structural analysis depends on the level of analysis for the ship. The failure modes need to be defined for all the levels as shown in Figure 3-8.
37
Linear or Nonlinear Loads for Naval Ships
Gravity Loads
Sea-Environment Loads
Buoyancy Loads Passing Waves Slamming Whipping Heeling Pitch & Green Seas
Response of Naval Ships Using Linear or Nonlinear Analysis
Live Loads Dead Loads Liquid/Tank Loads Equipment Loads
Service and Extreme Wave Effects
Stillwater
Operational Loads
Combat Loads
Underwater Explosions Air Blast (Internal or External) Fragments Own Weapons Effect
Flooding Aircraft Landing Docking
Special Loads and Combat Effects
Slamming Whipping Green Seas
Stress Ranges
Hull Girder Response
not considered
Grillage Response
Panel Response
Plate Response
Detail Response
Levels of Analysis for Naval Ships
Figure 3-7. Classifications for Nonlinear Structural Response
38
Nonlinear Structural Analysis of Naval Vessels
Methods of Analysis
Failure Modes Panel Buckling Analysis
Nonlinear Finite Element Analysis Probabilistic Fracture Mechanics
Hull Girder Collapse Fatigue Failure
Method of Consistent Deformation (e.g., ULTSTR)
Grillage Collapse
Plate Failure
Panel Collapse
Cumulative Damage for Fatigue
Brittle Fracture
Levels of Analysis for Naval Ships
Hull Girder Response
Stillwater Extreme Waves Whipping Extreme Analysis
Grillage Response
Stillwater Extreme Waves Whipping
Load Combinations
Extreme Analysis
Load Combinations
Panel Response
Plate Response
Detail Response
Stillwater Extreme Waves Whipping Slamming
Stillwater Extreme Waves Whipping Slamming
Service Waves Whipping Slamming
Extreme Analysis
Load Combinations
Extreme Analysis
Load Combinations
Load Combinations
Figure 3-8. Outline for Nonlinear Structural Response
39
3.5.4. Extreme Analysis and Stochastic Load Combinations The extreme analysis and stochastic load combinations are required for reliability analysis. Figure 3-9 shows an outline of the extreme analysis and stochastic combinations of structural responses. The extreme analysis can require the definition of a parent probability distribution for a load-effect type, the design life of the structural system in years, and methods of analysis. The stochastic combinations of load effects can be performed using one of several available methods, such as, Turkstra rule, Ferry Borges-Castanheta model, upcrossing of stochastic process, or loadcombination factors. The effect of correlation and phase angles between the load effects need to be carefully examined using, for example, parametric analysis.
Extreme Analysis and Combination of Load Effects for Naval Ships
Stillwater
Passing Waves
Wave Whipping
Wave Slamming
Extreme Analysis: Reference time period Parent probability distribution Design life Serviceability period Extreme probability distributions Correlation Phase angle
Extreme Waves
Models: Probability distributions Renewal processes
Extreme Wave Whipping
Extreme Wave Slamming
Load Combinations: Stillwater + Waves Stillwater + Waves + Whipping Stillwater + Waves + Whipping + Slamming
Methods of Load Combinations: Turkstra rule Ferry Borges-Castanheta model Upcrossing of stochastic processes Load-combination factors
Figure 3-9. Extreme Analysis and Stochastic Combinations of Load Effects 3.5.5. Failure Modes, their Load Effects, Load Combinations, and Structural Strength The reliability-based design of ship structures at the system level requires the reliability analysis of the following failure levels: 1. Hull girder failure 2. Grillage failure 3. Stiffened panel failure 4. Plate failure 5. Fatigue failure 6. Brittle fracture failure
40
The failure definition for these levels can be based on approach outlines in Section 3.8. The failure definition can include different failure types such as serviceability failure, partial collapse and complete collapse. The definition of load effects, their combinations, and structural strength for these failure levels is needed for assessing the reliability of ship structures. The needed information is summarized in Table 3-3 with sample information. Table 3-3. Load Effects, Combinations, and Strength for Structural Levels Structural Level
Load Effects
Hull girder
Bending moments due to stillwater, waves, and whipping.
Grillage
In-plane loads due to hull girder bending moments in stillwater, waves and whipping, and lateral loads due to water pressure. In-plane loads due to hull girder bending moments in stillwater, waves and whipping, and lateral loads due to water pressure. Lateral pressure caused by hydrostatic head, and in-plane loads due to hull girder bending moments in stillwater, waves and whipping Local state of stress induced by all load effects
Quasi-static or fully dynamic
Local state of stress induced by all load effects
Time dependent analysis using da/dn=∆K. Stress intensity based on detail geometry.
Panel
Plate
Detail Fatigue
Detail Fracture
Methods for Determining Load Effects Quasi-static or fully dynamic
Models for Load Effects
Combination of Load Effects
Structural Strength
Definition of operational-sea profile. Analysis in frequency domain. Extreme analysis. Definition of operational-sea profile. Analysis in frequency domain. Extreme analysis.
Ferry Borges-Castanheta model, upcrossing of stochastic process, or loadcombination factors with correlation and phase-angle consideration. Same as Hull Girder
Method of consistent deformation, e.g., ULTSTR program.
Quasi-static or fully dynamic
Definition of operational-sea profile. Analysis in frequency domain. Extreme analysis.
Same as Hull Girder
Analytical models (e.g., Hughes 1987) or FEM analysis
Quasi-static, and slamming dynamic effects
Definition of operational-sea profile. Analysis in frequency domain. Extreme analysis.
Same as Hull Girder. For regions below the neutral axis, the hydrostatic pressure is the dominant load effect.
Quasi-static analysis. Time dependence (encounter rate). Dynamic effect not included.
Time history of load effects either generated from stochastic analysis of model tests or from sea spectrum analysis. Same as Detail Fatigue
All load effects need to be combined to determine the local stress state in the vicinity of the detail of interest.
Small deflection plate theory (biharmonic equations). For regions of large in-plane loads, a magnification factor is needed. S-N for the detail. Transformations are needed for variable amplitude loading. Fracture toughness based on tests.
Same as Detail - Fatigue
Analytical models (e.g., Hughes 1987) or FEM analysis
41
3.5.6. Reliability Assessment Methods Generally, reliability assessment methods can be classified into the following two types: numerically (or computationally) approximate and exact methods. The approximate methods are usually of the moment type. In these methods, approximations are made about the distribution types, linearity of the failure surface, design or failure points, statistical characteristics of the basic random variables, etc. Some of these methods are based on step-by-step approximations of the previous parameters in an optimization scheme and, consequently, lead to an improved estimate of the reliability or probability of failure of the structure. However, such methods can have problems in convergence to the improved solutions due to limitations in the level of nonlinearity of the failure surface that can be considered by the methods, the number of random variables that can be considered in the limit state equations defining the potential failure modes of the structure, and the level of skewness of the probability distributions of the basic random variables. The exact methods determine the exact (numerical value) of probability of failure of a structural component or system according to a specified limit state equation. Exacts methods can be classified into two types, closed-form solution of the resulting reliability integrals, and simulation-based techniques. In the first type, the integrals are evaluated making use of the probabilistic characteristics of the basic random variables. This can be done if the joint probability distribution function of the basic random variables is known and the integral can be evaluated. In many practical problems, these conditions cannot be met. In the classical use of the simulation-based methods, all the basic random variables are randomly generated and a performance equation for a failure mode is evaluated. Failures are then counted depending on the outcome of the evaluation. The probability of failure is estimated as the ratio of the number of failures to the total number of simulation cycles. Therefore, the smaller the probability of failure is, the larger the needed number of simulation cycles to estimate the probability of failure within an acceptable level of statistical error. In addition, direct simulation requires binary definition of failure according to the limit state equation. The level of computational effort in this method is small. The efficiency of simulation can be largely improved by using variance reduction techniques. However, the level of computational effort will be increased. One of the commonly used methods is conditional expectation combined with antithetic variates variance reduction techniques for structural reliability assessment. These methods were determined to be highly efficient, and converge to the correct probability of failure in a relatively small number of simulation cycles. Importance sampling procedures with design points were suggested for structural reliability assessment. The procedure was implemented in a structural reliability assessment computer code resulting in a drastic reduction in computational effort and time. The method was used for the reliability assessment of structural systems that have failure modes and/or components in series. Common random numbers variance reduction technique was used for structural reliability assessment. The method was used to compare the structural reliability levels of alternative designs. The technique was used in combination with conditional expectation and antithetic variates variance reduction techniques. The method is based on the fact that the variance of the
42
estimated difference in the probability of failure of two or more alternative designs can be reduced by using the same streams of random numbers for common random variables among the designs. Therefore, variations in the estimated quantities due to variability in the input parameters that are not intrinsic to design differences are eliminated. Latin hypercube sampling was used in combination with other variance reduction techniques for structural reliability assessment. Latin hypercube sampling is a weighted selective sampling scheme. The method was used in combination with conditional expectation and antithetic variates variance reduction techniques. Limitations on its use in such combinations were determined. Other methods of sampling and variance reduction techniques are available in the literature. They include, for example, adaptive importance sampling, correlation methods, control variates, directional simulation, biased estimation, weighted integration, etc. Combinations of these methods were tested for structural reliability assessment. The selection of a reliability assessment method can be based on the complexity of the performance functions that are used to model failure modes, the quality and format of the input basic random variables for these functions, and the desired output and accuracy of the assessment method. Combinations of the reliability assessment methods can be used for this purpose. 3.5.7. Uncertainty Modeling and Analysis Uncertainties in structural engineering systems can be mainly attributed to ambiguity and vagueness in defining the parameters of the systems and their relations. The ambiguity component is generally due to non-cognitive sources. These sources include (1) physical randomness; (2) statistical uncertainty due to the use of limited information to estimate the characteristics of these parameters; and (3) model uncertainties which are due to simplifying assumptions in analytical and prediction models, simplified methods, and idealized representations of real performances. The vagueness related uncertainty is due to cognitive sources that include (1) the definition of certain parameters, e.g., structural performance (failure or survival), quality, deterioration, skill and experience of construction workers and engineers, environmental impact of projects, conditions of existing structures; (2) other human factors; and (3) defining the inter-relationships among the parameters of the problems, especially for complex systems. Structural engineers and researchers dealt with the ambiguity types of uncertainty in predicting structural behavior and designing structural systems using the theories of probability and statistics. Probability distributions were used to model system parameters that are uncertain. Probabilistic structural methods that include structural reliability methods, probabilistic engineering mechanics, stochastic finite element methods, reliability-based design formats, random vibration, and other methods were developed and used for this purpose. In this treatment, however, a realization was established of the presence of a cognitive type of uncertainty. Subjective probabilities were used to deal with this type, that are based on mathematics used for the frequency-type probability. Uniform and triangular probability distributions were used to model this type of uncertainty for some parameters. The Bayesian
43
techniques were also used to deal with gaining information about these parameters. The underlying distributions and probabilities were, therefore, updated. Regardless of the nature of the gained information, whether it is cognitive or non-cognitive, the same mathematical assumption and tools were used. In reliability-based design of marine structures, uncertainty analysis of this type is needed for the basic random variables for both strength and loads. Also, statistical and modeling uncertainties need to be assessed. The modeling uncertainty can be assessed in the form of random variability and biasedness. The cognitive types of uncertainty arise from mind-based abstractions of reality. These abstractions are, therefore, subjective, and lack crispness. This vagueness is distinct from ambiguity in source and natural properties. The axioms of probability and statistics are limiting for the proper modeling and analysis of this uncertainty type, and are not completely relevant nor completely applicable. In this paper, the vagueness type of uncertainty in structural reliability assessment is discussed. The modeling and analysis of vagueness type of uncertainty in other engineering systems were investigated by researchers through the application of fuzzy set theory. 3.5.8. Failure Definitions Classical structural reliability assessment techniques are based on precise and crisp (sharp) definitions of failure and non-failure (survival) of a structure in meeting a set of strength, function and serviceability criteria. These definitions are provided in the form of performance functions and limit state equations. Thus, the criteria provide a dichotomous definition of what real physical situations represent, in the form of abrupt change from structural survival to failure. However, based on observing the failure and survival of real structures according to the serviceability and strength criteria, the transition from a survival state to a failure state and from serviceability criteria to strength criteria are continuous and gradual rather than crisp and abrupt. That is, an entire spectrum of damage or failure levels (grades) is observed during the transition to total collapse. In the process, serviceability criteria are gradually violated with monotonically increasing level of violation, and progressively lead into the strength criteria violation. Classical structural reliability methods correctly and adequately include the ambiguity sources of uncertainty (physical randomness, statistical and modeling uncertainty) by varying amounts. However, they are unable to adequately incorporate the presence of a damage spectrum, and do not consider in their mathematical framework any sources of uncertainty of the vagueness type. Vagueness can be attributed to sources of fuzziness, haziness, unclearness, indistinctiveness, sharplessness and grayness; whereas ambiguity can be attributed to nonspecificity, one-to-many relations, variety, generality, diversity and divergence. Using the nomenclature of structural reliability, vagueness and ambiguity can be accounted for in the form of realistic delineation of structural damage based on subjective judgment of engineers. The inability of the classical structural reliability theory to incorporate these subjective elements is a significant deficiency. For situations that require decisions under uncertainty with cost/benefit objectives, the risk of failure should depend on the underlying level of damage and the uncertainties associated with its definition. A mathematical model for structural reliability assessment that includes both ambiguity and vagueness types of uncertainty was suggested to result in the likelihood of failure over a damage
44
spectrum. The resulting structural reliability estimates properly represent the continuous transition from serviceability to strength limit states over the ultimate time exposure of the structure. This type of modeling was performed by 3.5.9. System Analysis The reliability analysis of ship structures requires the treatment of multiple failure modes. These modes can be modeled as the components of a system. Modeling multi-mode components or multi-component systems can be based on similar concepts. The objective of this section is introduce the concepts of system analysis for the purpose of reliability assessment at the system level. System analysis requires the recognition and modeling of some system characteristics that include (1) post-failure behavior of a component, (2) the contribution of a component failure or failure-mode occurrence to the system's failure, (3) the statistical correlation among failure modes and components' failure, and (4) the definition of failure at the system level. The postfailure behavior of a component is needed in order to determine the remaining effect or contribution of the component to the system response or failure. For example, structural engineering components can be ideally classified into brittle and ductile components according to their potential failure modes. Components lose their strength completely after failure according to a brittle failure mode. Therefore, these component can be removed from the structural analysis of a system upon failure. On the other hand, component that fail according to a ductile failure mode maintain complete or substantial partial force resistance at increasing levels of deformation after failure. Therefore, they continue to contribute to the behavior of the system after failure, and their contribution needs to be considered in the analysis of the system. The contribution of a component failure or failure-mode occurrence to the system's failure depends on the level of redundancy in the system. The failure of some components can lead to the failure of the system; whereas the failure of other components does not result in system failure, but it can weaken the system. The statistical correlation among failure modes and components' failure can have a large effect of the reliability of the system. The difficulty in assessing this correlation can result in approximate assessment of system reliability, or interval assessment of the reliability by considering the extreme conditions of statistically uncorrelated and fully correlated failure modes and components' failure. Finally, the reliability assessment of a system requires defining failure at the system level. For example in a structural system, the failure definition of a system can be that the remaining (or surviving) elements of a system become structurally unstable.
3.6. Hydrodynamics Performing a reliability analysis requires the development of either a lifetime loads spectrum or a probability density function (pdf). The general approach for developing such load information requires the numerical simulation of ship responses for an entire ship life. Since the objective is to ultimately perform a stress analysis, the selected approach must include contributions from both loads (hydrodynamic pressure and inertia forces due to motions) and load effects (hull girder shear forces and bending moments, hull flexural responses, and local structural stresses and deformations). As has been previously discussed by Sikora et. al. (1983) and Dalzell (1991), the number of cells (one may consider the entire ship operational profile to be a cube with axes corresponding to speed, heading and sea condition; see Figure 3-10) to be investigated will range anywhere from 45
2,000 to 10,000 individual ship speed/heading/sea state combinations. Since simulations will include both linear and non-linear responses, reliance on what has been the workhorse of the industry, linear strip theory, will no longer be sufficient.
OPERATIONAL PROFILE TYPICAL CELL W/WAVE PLUS SLAMMING 4m -15 o 15 o
3m
WAVE HEIGHT
10 kts 15 kts
COMBINED WAVE + SLAMMING SUB-CELL
SPEED HEADING
WAVE ONLY SUB-CELL Nsi=CYCLES Nwi=CYCLES
TRUNCATED RAYLEIGH DISTR.
WEIBULL DISTRIBUTION
Figure 3-10. Ship Operability Cube Hence, a multi-level design system is recommended that allow the naval architect to analyze to the level of accuracy required. Existing frequency domain programs can be used to predict motion and load response amplitude operators (RAOs) in the linear range. However, time domain simulations are required for accurate predictions of nonlinear motion and load responses and impact-induced whipping responses. 3.6.1. Current and Emerging Technology Recent advances in hydro-numeric methods have resulted in a new level of computational capability for predicting nonlinear ship motions and wave loads. Coupled with an increasing level of computer power, use of such codes has accelerated to the point where some of these methods may now be used to support the design process. Nonlinear time domain prediction methods: Three dimensional time domain potential flow calculations require the use of either Rankine sources or transient Green’s functions. The Rankine source method that has been used in the development of the program SWAN (Ship Wave ANalysis, Nakos et. al. 1993) has been shown to be quite robust in its ability to handle different geometric configurations. However, in order to properly address the free surface boundary condition, Rankine sources must be applied to both the body and the free surface. As a result, an ad-hoc numerical damping zone must be used to absorb wave energy.
46
Codes such as the Large Amplitude Motions Program or LAMP (see Lin et. al. 1994 for details) are based on Green’s functions. Since the Green’s function will automatically satisfy both the linearized free surface boundary and far field radiation conditions, use of a wave absorbing beach is not required (singularities are only needed on the wetted surface of the body). However, numerical problems may arise when using this method for shapes where the angle of intersection between the free surface and the body becomes small. In order to take advantage of the strengths of both methods, a mixed formulation has been proposed (Zhang et. al. 1998). The combined approach requires that the fluid domain be split; with the inner region being defined through the use of Rankine sources and the outer domain defined by Green’s functions (see Figure 3-11). Since the Green’s function satisfies both the radiation and free surface boundary condition, the matching surface can be placed quite close to the body. This results in an increased computer-use (cpu) efficiency. Another expected benefit is an improvement in computational accuracy. With a straight Rankine source formulation, a damping zone or wave-absorbing boundary is required in order to avoid wave reflection. However, it is not possible for such beaches to absorb the wave energy generated from all frequencies (especially low frequency waves where the wave length is longer than the damping zone). The use of a matching surface with a transient Green's function distribution can, in principle, transmit waves of all frequencies out of the solution domain. As a result the transient Green's function on the matching surface should not have reflection of the radiation and diffraction waves. Hence, the predictions for pressure, motions, loads and wave patterns should be more accurate.
Mixed Formulation • Two Fluid Domains • Both Rankine Source and Transient Green Function
Sf
Sb
I : ∇2Φ I = 0
II : ∇ 2 Φ II = 0
G=
1 r
Sm
Go+Gf S∞
Figure 3-11. Combined Approach for Large Amplitude Motion Prediction RANS Viscous-flow Methods: The forces due to viscous and lift effects are not part of the potential flow solution. However, these forces have a significant effect on the motion and load 47
computation for ships in oblique seas. In order to account for such effects these codes include an option to approximate viscous and lift effects in the time-domain. A typical approach is to determine these components in a manner very similar to that used in the U.S. Navy's SMP code (Himeno 1981, and Meyers et. al. 1981). However, since these effects are used in the time domain the magnitude of roll displacement and roll velocity can be determined at each time step rather than using an averaged value as that used in SMP. In order to rigorously address viscous effects the Office of Naval Research has been exploring the use of Reynolds Average Navier Stokes (RANS) codes as a means of predicting viscous roll damping (Korpus and Falzarano 1996). Extensions of this technology, to include free-surface effects, would allow naval architects to accurately predict roll damping of novel hull form designs. Impact Loads: Impact on a ship can cause high-frequency structural responses. As impact occurs, the ship structure will respond at its structural natural frequency. The total loads at any section of the ship is the sum of the wave frequency loads and the high-frequency whipping loads. Depending on the severity of the impact, the whipping loads can be very large. Therefore, it is extremely important to include the effect of impacts in the hydrodynamic computations. Most traditional methods for analyzing impact loads rely on semi-empirical force estimates rather than an accurate prediction of the actual impact pressure distribution. Furthermore, the traditional methods address only head-sea cases with symmetric impact. However, structural failures can also be caused by asymmetric impact loads in oblique seas. Hence, it is important that any attempt to resolve the total impact problem include not only the accurate time-domain simulation of the highly nonlinear motions in oblique seas, but also the prediction of both the symmetric and asymmetric impact pressures. Recently developed programs such as SLAM2D (Zhao and Faltinsen 1993) can account for such asymmetry as well as flow separation within the wave impact force formulation.
3.7. Fatigue and Fracture Recent mission requirements have resulted in ships with numerous large openings in the strength decks. Methods for accurately predicting lifetime lateral and torsional hull girder loads need to be finalized. Foreign equipment is being considered for installation on Navy ships. Foreign methods of shock design sometimes involve softening of the support (deck) structure. Lifetime ship accelerations may add significant fatigue damage to the deck structure. Methods for predicting lifetime point accelerations due to ship motions need to be developed. Acquisition reform is pushing the Navy to employ commercial methods. An increase in span between transverse frames may result. Lifetime secondary loads may add significant fatigue damage. A method for predicting lifetime secondary loads (passing waves, and wave slap) needs to be developed. A proposed methodology that was recently used in the design of the LPD-17 is provided in Figure 3-12. Design for extreme conditions and fatigue are provided in Figures 3-13 and 3-14, respectively. 48
Top Level Requirements
Ship Lifetime at Sea Ship Characteristics
Days of Operation
Area of Operation
Threats
Wave Height Probabilities of Occurrence
Primary Damage From Mine
Operational Profile Speed, & Heading Probabilities for a Given Wave Height
LBP, Beam, Bow Form
Longitudinal Strength Structural Assessment
Seaway Loading Fatigue Analysis
Is Structure Satisfactory ?
100 % Primary
YES
67 % Primary + Secondary Hull Girder Stress Range
UNDEX Loading
NO
Ultimate Strength
STOP
Revise Hull Girder Scantlings
Figure 3-12. Overall Design Methodology
Area of Operation Wave Height Probabilities of Occurrence
Operational Profile Speed, & Heading Probabilities for a Given Wave Height
Wave Spectra Sw(w) Ochi 6 Parameter • Wave Height • Natural Frequency
Ship Characteristics LBP, Beam, Bow Form
Response Amplitude Operator (RAO)
Response Spectra
Ship Lifetime at Sea Days of Operation
Maximum Lifetime Response for a Particular Operating Mode BM max = (2m0i ln(ni))0.5
SR(ωe)= |RAO|2 Sw(ω)
Sum for each of the 11spectra Sum for each operational mode
Maximum Lifetime Response for All Operating Modes (Wave Induced) Σi exp(BM2max / 2m0i) ni = 1.0
Bending Moment Histogram (Fatigue)
Whipping Occurs No Yes Add Whipping Component
Seaway Loading Maximum Lifetime Bending Moment
Figure 3-13. Design for Extreme Conditions
49
Ship Lifetime at Sea
Ship Characteristics
Days of Operation
LBP
Bending Moment Histogram (Fatigue)
Beam
Moment Range (Mr) vs Number of Cycles (ni)
Bow Form
Area of Operation
Operational Profile
Wave Height Probabilities of Occurrence
Speed, Heading Probabilities for a Given Wave Height
Stress Calculation
S-N Curves
Stress Range (Mr/SM)
Based on AASHTO CAT E
Cumulative Damage
No
Revise Section Modulus Estimate
Is Σni/Ni = 1 Minimum Section Modulus CAT E Detail
Yes
Fatigue Allowable Stress Range
Structural Assessment
Fatigue Bending Moment Histogram
Figure 3-14. Design for Fatigue
3.8. Design for Production and Maintenance The design of ship structural systems needs to account for production considerations. Concurrent engineering, production line customization, flexible manufacturing, and repetitious processes need to be utilized to improve production. Also, maintenance considerations are needed in the detailed design stage. The maintenance considerations should cover the entire life of a vessel.
3.9. Sample LRFD Rules for Hull Girder Bending The U.S. Navy (USN) Load and Resistance Factor Design (LRFD) Rules for surface ship structures are based on probability and reliability theories (Ayyub et. al. 1997). The rules presented herein were built on previous Design Data Sheets (DDS) and practices in the design of ship structures. Also, LRFD specifications and rules by other related industries were considered in the development of the USN LRFD rules, such as the American Institute of Steel Construction, the American Association of State Highway and Transportation Officials, American Bureau of Shipping, American Petroleum Institute, and Det Norske Veritas. The LRFD rules is an accumulation of the efforts of researchers at the Carderock Division of the Naval Surface Warfare Center and results reported by projects funded by the Ship Structures Committee in this area. The LRFD rules are intended for routine use of engineers to handle commonly used designs, and not for the design of new structural configurations or systems. The rules are presented herein in concise terms without providing background details. The developmental details are provided in the document “Development of LRFD Rules for Naval Surface Ship Structures: Part I - Hull Girder Bending” which includes assumptions, limitations, references, computations of partial safety factors, and the rational behind the assignment of recommended partial safety factors. 50
The LRFD rules are intended ultimately to replace the currently used design specifications provided in the USN design manual and the Design Data Sheets, although at this stage not all design aspects are covered in the rules. Therefore, the use of the USN manual and the DDS is indispensable. During this interim period, both LRFD rules and the current USN specifications shall be used. The rules do not supersede existing DDS, Naval Sea System Command (NAVSEA) instructions, military standards, or other design criteria and practices documentation. In areas where the rules do not provide guidance, state-of-the-art engineering or prediction models shall be used. The rules are provided herein to guide engineers, they are not a substitute to sound engineering modeling and judgment. The users of the rules assume full responsibility in exercising their engineering judgment, and shall not hold the U.S. Navy and the U.S. government, their units, engineers and contractors responsible for use, interpretation of the rules nor the results from the use of the rules. The Load and Resistance Factor Design (LRFD) rules for ship structural design are provided in this document in its first edition. The rules are based on structural reliability theory and build on previous and currently-used specifications for ship, steel, bridge and offshore structures. The LRFD rules are intended ultimately to replace the currently used design specifications provided in the USN design manual and the DDS-6, although at this stage not all design aspects are covered in the rules. Therefore, the use of the USN manual and the DDS-6 is indispensable. During this interim period, both LRFD rules and the current USN specifications shall be used. The LRFD rules as described herein are concerned mainly with the structural design of ship hull girders under combinations of different loads. The intention herein is to provide naval architects and ship designers with reliability-based methods for their use in both early and final design stages and for checking the adequacy of the scantlings of all structural members contributing to the longitudinal and transverse strength of ships. The general form of the LRFD format used in the rules is given by m
φR ≥ ∑ γ i Li
(3-6)
i =1
where
φ
R
γi Li
= strength factor = nominal (or design) strength = load factor for the ith load component out of m components = nominal (or design) value for the ith load component out of m components
The probabilistic characteristics and nominal values for the strength and load components were determined based on statistical analysis, recommended values from other specifications, and by professional judgment. The LRFD general format for ship hull girders design is given by φR ≥ γ SW LSW + γ W LW + γ d Ld (3-7) where φ = strength factor R = nominal (or design) strength such as the ultimate moment strength γ SW = load factor for stillwater load effect such as bending moment
51
LSW
γW
LW
γd
Ld
= nominal (or design) value for stillwater load effect such as bending moment = load factor for wave-induced load effect such as bending moment = nominal (or design) value for wave-induced load effect, e.g., bending moment = load factor for dynamic load effect such as bending moment = nominal (or design) value for dynamic load effect such as bending moment
The strength and load factors are called collectively partial safety factors. These factors are determined using structural reliability methods based on the probabilistic characteristics of basic random variables for materials, geometry and loads including statistical and modeling (or prediction) uncertainties. The factors are determined to meet target reliability levels that were selected based on assessing previous designs. This process of developing LRFD rules is called code calibration. The material properties used in the LRFD rules refer to the mechanical properties of shipbuilding grade steel as provided by ASTM specifications. The hull girder of a naval ship for all stations shall meet one of the following limit states:
(
φ M M u ≥ γ SW M SW + kW γ W MW + γ d k d M d
where c
φM Fy
kd kW kWD
γd γ SW γW γ WD Md M SW Mu MW MWD Z
)
(3-8a)
φ M cFy Z ≥ γ SW M SW + kW (γ W MW + γ d k d M d )
(3-8b)
φ M M u ≥ γ SW M SW + γ WD kWD MWD φ M cFy Z ≥ γ SW M SW + γ WD kWD MWD
(3-8c) (3-8d)
= nominal buckling knock-down factor = strength factor of ultimate bending capacity = nominal yield strength of steel = dynamic bending moment probabilistic combination load factor = wave-induced bending moment probabilistic combination load factor = probabilistic combination load factor for combined wave-induced and whipping = load factor for dynamic bending moment = stillwater bending moment partial safety factor = load factor for environmental load = load factor for combined wave-induced and dynamic bending = nominal dynamic bending moment = nominal value of stillwater bending moment = nominal ultimate bending capacity of ship hull girder = nominal value of wave-induced bending moment = nominal combined wave-induced and whipping bending moment = section modulus of hull girder
52
The nominal (i.e., design) values of the strength and load components shall stratify these format in order to achieve specified target reliability levels. Recommended prediction methods for hull girder bending strength and loads are provided by Ayyub et al (1997). The load factors for hull girder bending are tabulated by load type and load combination for selected target reliability levels in Table 3-4. Load factors for stillwater, wave-induced, dynamic, and combined wave-induced and dynamic bending moments for target reliability levels (β) ranging from 4.0 to 6.0 for every load combination are provided. A target reliability (β) should be selected based on the ship type and usage. Then, the corresponding load factors can be looked up from Table 3-4 for the load combination of interest. Table 3-4. Load Factors Target Reliability Index (β) 4.0 4.5 5.0 5.5 6.0
γ SW
γW
0.75 0.75 0.75 0.75 0.75
1.30 1.35 1.40 1.45 1.50
Load Factors
γd
γ WD
1.05 1.05 1.05 1.05 1.05
1.40 1.45 1.50 1.55 1.60
The strength factors are provided in Table 3-5 according to the following parameters: 1. target reliability level ranging from 4.0 to 6.0 2. load combinations 3. ultimate bending strength prediction methods A target reliability should be selected based on the ship type and usage. Then, the corresponding strength factor can be looked up from Table 3-5 based on strength model, and load combination. The factors can be used for both sagging and hogging conditions. Table 3-5. Strength Factors
Strength Factors ( φ M )
(
φM M u ≥ γ SW M SW + kW γ W MW + kd γ d M d
(
)
φM cFy Z ≥ γ SW MSW + kW γW MW + kdγ d Md φ M Mu ≥ γ
SW
φ M cF y Z ≥ γ
Target Reliability Index (β)
Type of Steel
Load Combination
M SW + kWD γ WD M WD
SW M SW + kWD γ WD M WD
)
All
4.0 0.46
4.5 0.40
5.0 0.30
5.5 0.22
6.0 0.13
OS (HS) All
0.46 (0.50) 0.46
0.42 (0.45)
0.37 (0.4) 0.31
0.32 (0.35)
0.29 (0.32) 0.14
OS (HS)
0.46 (0.45)
0.37 (0.4)
0.3 (0.32)
OS = ordinary strength, HS = high strength
53
4. Summary The development of reliability-based design criteria for surface ship structures needs to consider the following three components: (1) loads, (2) structural strength, and (3) methods of reliability analysis. A methodology for reliability-based design of ship structures is provided in this document. The methodology consists of the following two approaches: (1) direct reliabilitybased design, and (2) load and resistance factor design (LRFD) rules. According to this methodology, loads can be linearly or nonlinearly treated. Also in assessing structural strength, linear or nonlinear analysis can be used. The reliability assessment and reliability-based design can be performed at several levels of a structural system, such as at the hull-girder, grillage, panel, plate and detail levels. A rational treatment of uncertainty is suggested by considering all its types. Also, failure definitions can have significant effects on the assessed reliability, or resulting reliability-based designs. A method for defining and classifying failures at the system level is provided. The method considers the continuous nature of redundancy in ship structures. A bibliography is provided at the end of this document to facilitate future implementation of the methodology. This document provides a summary of the current practice, emerging technologies, and challenges in ship structural design.
5. Acknowledgment The financial support of the U.S. Coast Guard of this study is greatly appreciated. The support, input, and cooperation from researchers and engineers at the Surface Ship Structures Department of the Carderock Division of the Naval Surface Warfare Center contributed greatly to the development of the methodology, especially from Mr. Jeffery Beach. Also, the support and guidance of Mr. Tom Packard, and Nat Nappi, Jr. of the Naval Sea System Command are greatly appreciated.
6. Bibliography 1. 2. 3. 4. 5. 6.
ABS, 1993, “Guide for Fatigue Strength Assessment of Tankers”, American Bureau of Shipping, September 1993. Adamchak, J.C., 1982,”ULTSTR: A Program for Estimating the Collapse Moment of a Ship’s Hull under Longitudinal Bending,” DTNSRDC Report 82/076, U.S. Navy, Carderock, Bethesda, Maryland. Ang, A. H-S and Y.K. Wen “Development of a Structural Reliability Evaluation Framework” Report no. CG-M-1-86, U.S. Coast Guard Office of Marine Safety, Security, and Environmental Protection, Washington, D.C., 1985. Ang, A. H-S., and Tang, W., 1984, Probability Concepts in Engineering Planning and Design, volume II, John Wiley and Sons, N.Y. Ayyub, B.M., "Guidelines for Probabilistic Risk Analysis of Marine Systems,” U. S. Coast Guard, 1997, 83 pages. Ayyub, B.M., 1991, Systems Framework for Fuzzy Sets in Civil Engineering, Fuzzy Sets and Systems, 40(3), 491-508.
54
7. 8.
9.
10. 11.
12. 13. 14.
15. 16. 17. 18. 19. 20. 21. 22. 23.
Ayyub, B.M., 1992, Generalized Treatment of Uncertainties in Structural Engineering, Analysis and Management of Uncertainty: Theory and Applications, edited by Ayyub, Gupta and Kanal, North-Holland, 235-246. Ayyub, B.M., 1996, “Uncertainty and Intelligence in Computational Stochastic Mechanics,” Proceedings of the NASA Workshop on Computational Intelligence and Its Impact on Future High-performance Engineering Systems, NASA Conference Publication 3323, Hampton, VA, edited by A. Noor, 127-205. Ayyub, B.M., and Assakkaf, I., “Development of LRFD Rules for Naval Surface Ship Structures: Reliability-based Load and Resistance Factor Design Rules, Part II – Unstiffened Panels,” Naval Surface Warfare Center, Carderock Division, U. S. Navy, 1997, about 600 pages. Ayyub, B.M., and Assakkaf, I., “Risk-based Analysis of Low Speed Diesel Systems for the Engine Room Arrangement Model,” Naval Surface Warfare Center, Carderock Division, U. S. Navy, 1998, about 350 pages. Ayyub, B.M., and Atua, K., “Development of LRFD Rules for Naval Surface Ship Structures: Reliability-based Load and Resistance Factor Design Rules, Part I – Hull Girder Bending,” Naval Surface Warfare Center, Carderock Division, U. S. Navy, 1996, about 300 pages. Ayyub, B.M., and Lai, K.-L., "Structural Reliability Assessment with Ambiguity and Vagueness in Failure," Naval Engineers Journal, ASNE, 104(3), May 1992, 21-35. Ayyub, B.M., and McCuen, R.H., 1997. Probability, Statistics and Reliability for Engineers, CRC Press, 1997, FL. Ayyub, B.M., Assakkaf, I., and Atua, K., “Development of LRFD Rules for Naval Surface Ship Structures: Reliability-based Load and Resistance Factor Design Rules, Part III – Stiffened and Gross Panels,” Naval Surface Warfare Center, Carderock Division, U. S. Navy, 1998, about 400 pages. Ayyub, B.M., Assakkaf, I., Atua, K. I., Melton, W., and Hess, P., 1997. “LRFD Rules for Naval Surface Ship Structures: Reliability-Based Load and Resistance Factor Design Rules,”, US Navy, Naval Sea System Command, Washington, DC. Ayyub, B.M., Beach, J., and Packard, T., "Methodology for the Development of Reliability-Based Design Criteria for Surface Ship Structures," Naval Engineers Journal, ASNE, 107(1), Jan. 1995, 45-61. Ayyub, B.M., Chia, C.-Y., 1992, Generalized Conditional Expectation for Structural Reliability Assessment, Structural Safety, 11(2), 131-146. Ayyub, B.M., Fault Tree Analysis of Cargo Elevators Onboard Ships, BMA Engineering Report, prepared for Naval Sea System Command, U.S. Navy, Crystal City, VA, 1992. Ayyub, B.M., Gupta, M. and Kanal, L. (Eds.), 1992, Analysis and Management of Uncertainty: Theory and Applications, North-Holland, 428 pages. Ayyub, B.M., Haldar, A., 1984, Practical Structural Reliability Techniques, J. of Structural Engineering, ASCE, 110(8), 1707-1724. Ayyub, B.M., Handbook for Risk-Based Plant Integrity, BMA Engineering Report, prepared for Chevron Research and Technology Corporation, Richmond, CA, 1993. Ayyub, B.M., Hassan, M.H.M., 1992, Control of Construction Activities: I. Systems Identification, Civil Engineering Systems, 9, 123-146. Ayyub, B.M., Hassan, M.H.M., 1992, Control of Construction Activities: II. Condition Assessment of Attributes, Civil Engineering Systems, 9, 179-204.
55
24. 25. 26. 27. 28. 29. 30. 31. 32. 33. 34. 35. 36. 37. 38. 39. 40. 41. 42. 43. 44.
Ayyub, B.M., Hassan, M.H.M., 1992, Control of Construction Activities: III. Fuzzy-Based Controller, Civil Engineering Systems, 9, 275-297. Ayyub, B.M., Lai, K.-L., 1991, Selective Sampling in Simulation-Based Reliability Assessment, Pressure Vessel and Piping, 46(2), 229-249. Ayyub, B.M., White, G. J., 1990, Life Expectancy Assessment of Marine Structures, Marine Structures: Design, Construction and Safety, 3(4), 301-317. Ayyub, B.M., White, G. J., Bell-Wright, T. F., Purcell, E. S., 1990, Comparative Structural Life Assessment of Patrol Boat Bottom Plating, Naval Engineers J., ASNE, 102(3), 253262. Ayyub, B.M., White, G. J., Bell-Wright, T. F., Purcell, E. S., 1990, Reliability-Based Comparative Life Expectancy Assessment of Patrol Boat Hull Structures, USCG Report, Avery Point, Groton, CT. Ayyub, B.M., White, G.J., 1987, Reliability Analysis of the Island- Class Patrol Boat, Report submitted to the U.S. Coast Guard R & D Center, Avery Point, CT. Ayyub, B.M., White, G.J., 1987, Reliability-Conditioned Partial Safety Factors, J. of Structural Engineering, ASCE, 113(2), 279-294. Ayyub, B.M., White, G.J., Purcell, E.S., 1989, Estimation of the Structural Service Life of Ships, Naval Engineers J., ASNE, 101(3), 156-166. Ayyub, Kaminskiy, and Moser, 1997. Reliability Analysis and Assessment of Hydropower Equipment. USACE Report, Center for Technology and Systems Management, University of Maryland, College Park, MD. Blockley, D.I., 1980, The Nature of Structural Design and Safety, Ellis Horwood, Chichester. Brown, C.B., 1979, A Fuzzy Safety Measure, J. of Engineering Mechanics Division, ASCE, 105(5), 855-872. Bruchman, Daniel, 1990, Reliability Methods of Assessing Hull Girder Reliability, Report, SSPD-91-173-44, David Taylor Research Center, Bethesda, MD. Dalzell, J., A Note on Structural Loads Analysis in the Reliability Context, DTRC Report SHD-1374-01, November 1991. Department of Defense, 1965, Reliability, Stress, and Failure Rate Data for Electronic Equipment, Military Standardization Handbook 217A. Derby, S. and Keeney, R., 1993, "Risk analysis: Understanding How Safe is safe Enough?", Readings in Risk, Resources for the Future. Design Data Sheet, DDS 100-4 “Strength of Structural Members”, 1 August 1969. Design Data Sheet, DDS100-4, 1979, Strength of Structural Members, The U.S. Navy, Bureau of Ships, Washington, D.C. Design Data Sheet, DDS1100-3, 1956, Strength of Structural Members, The U.S. Navy, Bureau of Ships, Washington, D.C. Design Data Sheet, DDS1100-4, 1955, Structural Design of Flat Platting and Stiffeners Subjected to Water Pressure, The U.S. Navy, Bureau of Ships, Washington, D.C. Dunn, T.W., “Reliability in Shipbuilding” Transactions of the Society of Naval Architects and Marine Engineers, Vol. 72, 1964, pp. 14-40. Ellingwood, B., Galambos, T.V., MacGregor, J.C., Cornell, C.A., 1980, Development of a Probability Based Load Criterion for American National Standard A58, National Bureau of Standards Publication 577, Washington D.C.
56
45. 46. 47. 48. 49. 50. 51. 52. 53. 54. 55. 56. 57. 58. 59. 60. 61. 62. 63.
Farmer, F. R., (1967). “Reactor Safety and Siting: A Proposed Risk Criterion,” Nuclear Safety, 8(6), 539-548. Faulkner, D., 1975, A Review of Effective Plating for Use in the Analysis of Stiffened Plating in Bending and Compression, J. of Ship Research, 19(1), 1-17. Faulkner, D., 1977, Compression Tests on Welded Eccentrically Stiffened Plate Panels, Steel Plated Structures, Ed. by P.J. Dowling et al, Crosby Lockwood Publishers, pp. 581617 Faulkner, D., 1981, Semi-Probabilistic Approach to the Design of Marine Structures, Extreme Loads and Response Symposium, SNAME, 213-230. Faulkner, D., 1990, Application of Reliability Theory to Structural Design and Assessment of Submarines and Other Externally Pressurised Cylindrical Structures, Proceedings, Conference on Integrity of Offshore Structures (IOS'90), Glasgo, Scotland, 199-230. Faulkner, D., C. Guedes Soares, D.M. Warwick, 1987, Modeling Requirements for Structural Design and Assessment, Integrity of Offshore Structures - 3, ed. D. Faulkner, M.J. Cowling and A. Incecik, Elsevier Applied Science, 25-54. Freudenthal, A.M., The Safety of Structures,” Transactions of the American Society of Civil Engineers, Vol. 112, 1947, pp. 125-180. Galambos, T.V., Ravindra, M. K., 1978, Properties of Steel for Use in LRFD, Journal of Structural Engineering, ASCE, 104(ST9), 1459-1468. Guedes Soares, C., 1988, A Code Requirement for the Compressive Strength of Plate Elements, Marine Structures, 1, 71-80. Guedes Soares, C., 1991, Effect of Transfer Function Uncertainty on Short-Term Ship Responses, Ocean Engineering, 18(4), 329-362. Guedes Soares, C., 1992, Combination of Primary Load Effects in Ship Structures, Probabilistic Engineering Mechanics, Vol. 7, 00. 103-111. Guedes Soares, C., 1992, Design Equations for Ship Plate Elements Under Uniaxial Compression, J. Construction Steel Research, 22, 99-114. Guedes Soares, C., Moan, T., 1982, Statistical Analysis of Stillwater Bending Moments and Shear Forces Tankers, Ore and Bulk Carriers, Norwegian Maritime Research, 10(3), 33-47. Guedes Soares, C., Moan, T., 1991, Model Uncertainty in the Long-term Distribution of Wave-induced Bending Moments for Fatigue Design of Ship Structures, Marine Structures, 4, 295-315. Guedes Soares, C., Soreide, T.H., 1983, Behavior and Design of Stiffened Plates Under Predominantly Compressive Loads, International Shipbuilding Progress, 30(341), 13-27. Hay, W., Bourne, J., Engle, A., Rubel, R. “Characteristics of Hydrodynamic Loads Data for a Naval Combatant”, Proceedings of the International Conference on Hydroelasticity in Marine Technology, May 1994. Hess, P., III, and Ayyub, B.M., 1997, “Failure Definition for Structural Reliability Analysis,” SR-1383, SSC, USCG, Washington, D.C. Himeno, Y., Prediction of Ship Roll Damping - State of the Art, The Department of Naval Architecture and Marine Engineering, Report No. 239, The University of Michigan, College of Engineering, September 1981. Kaplan, P. and J. Dalzell, “Hydrodynamic Loads Prediction (including Slamming) and Relation to Structural Integrity”, Transaction of the Ship Structures Symposium, 1993.
57
64. 65. 66. 67. 68. 69. 70. 71. 72. 73. 74. 75. 76. 77. 78. 79. 80. 81. 82.
Kaplan, P., 1984, Analysis and Assessment of Major Uncertainties Associated with Ship Hull Ultimate Failure, Ship Structure Committee, Report No. SSC-332. Kaplan, P., 1986, Analysis and Predictions of Flat Bottom Slamming Impact of Advanced Marine Vehicles in Waves, International Shipbuilding Progress, March. Kaplan, P., Benatar, M., Bentson, J., Achtarides, T.A., 1983, Analysis and Assessment of Major Uncertainties Associated with Ship Hull Ultimate Failure, Ship Structure Committee Report 332, U.S. Coast Guard. Kaplan, P., Sargent, T.P., 1972, Further Studies of Computer Simulation of Slamming and Other Wave-Induced Vibratory Structural Loadings on Ships in Waves, Ship Structure Committee, Report No. SSC-231. Karaszewski, Z., 1996, PrHA on Marine GenSets, Shipping Industry Munich Conference, Technical Report, Center for Technology and Systems Management, University of Maryland, College Park, MD. Korus, R.A. and J.M. Falzarano, “Prediction of Viscous Ship Roll Damping by Unsteady Navier-Stokes Techniques,” OMAE Conference, Italy, 1996. Kumamoto, H., and Henley, E.J., 1996, Probabilistic Risk Assessment and Management for Engineers and Scientists, Second Edition, IEEE Press, New York. Lin, W.M., M.J. Meinhold, N. Salvesen, and D.K.P. Yue, "Large-Amplitude Ship Motions and Wave Loads for Ship Design", Proceedings of the Twentieth Symposium of Naval Hydrodynamics, The University of California, Santa Barbara, CA, U.S.A., 1994. Madsen, H.0., Krenk, S., Lind, N.C., 1986, Methods of Structural Safety, Prentice Hall, Englewood Cliffs, NJ. Mansour, A.E., 1986, Tutorial Summary on Structural Reliability Theory Directed at the Marine Industry, SSC Report, US Coast Guard. Mansour, A.E., 1987, Extreme Value Distributions of Wave Loads and Their Application to Marine Structures, Marine Structural Reliability Symposium, Arlington, Virginia, 1987. Mansour, A.E., Lin, M., Hovem, L., Thayamballi, A., 1993, Probability-Based Ship Design Procedures: A Demonstration, Ship Structures Committee Report 368, US Coast Guard. Mansour, A.E., Probabilistic Design Concepts in Ship Structural Safety and Reliability” ” Transactions of the Society of Naval Architects and Marine Engineers, Vol. 80, 1972, pp. 64-97. Mansour, A.E., Yang, J.M., Thayamballi, A., 1990, An Experimental Investigation of Ship Hull Ultimate Strength, Trans. SNAME, Vol. 98, 411-439. Melchers, R.E., 1987, Structural Reliability Analysis and Prediction, Ellis Horwood Limited, UK. Meyers, W.G., T.R. Applebee, and A.E. Baitis, Users Manual for the Standard Ship Motion Program, SMP, DTNSRDC Report SPD-0936-01, 1981. Modarres, M., 1993. What Every Engineer Should Know about Reliability and risk Analysis, Marcel Dekker, Inc., New York. Moses, F., 1986, Development of Preliminary Load and Resistance Design Document for Fixed Offshore Platforms, Final Report, APIPRAC 85-22, American Petroleum Institute. Munse, W.H., Wilbur, T. W., Tellalian, M. L., Nicoll, K., Wilson, K., 1982, Fatigue Characterization of Fabricated Ship Details for Design, Ship Structure Committee, Report No. S.S.C.-318.
58
83. 84. 85. 86. 87. 88. 89. 90. 91. 92. 93. 94. 95. 96. 97. 98.
99. 100. 101. 102.
Nakos, D.E., Kring, D. and Sclavonous, P.D., “Rankine Panel Methods for Transient FreeSurface Flows” Proceedings of the Sixteenth Symposium of Naval Hydrodynamics, Iowa City, Iowa, U.S.A., 1993. National Research Council, 1989, Improving Risk Communication, National Academy Press, Washington, D.C. NCHRP, National Cooperative Highway Research Program, 1992, Development of Comprehensive Bridge Specifications and Commentary, Third Draft of LRFD Specifications and Commentary, National Research Board. Nikolaidis, E., Kaplan, P., 1991, Uncertainties in Stress Analysis of Marine Structures, Ship Structure Committee, Report S.S.C.-363, 1991. Also accepted for publication in International Shipbuilding Progress. Ochi, M.K., 1978, Wave Statistics for the Design of Ships and Ocean Structures, SNAME Transactions, Vol. 86, 47-76. Ochi, M.K., 1979, Extreme Values of Waves and Ship Responses Subject to the Markov Chain Condition, Journal of Ship Research, 23(3), 188-197. Ochi, M.K., 1979-a, Principles of Extreme Value Statistics and Their Application, Proceedings of Extreme Loads Response Symposium SNAME, pp. 15-30. Ochi, M.K., 1981, Principles of Extreme Value Statistics and Their Application, Extreme Loads Response Symposium, SNAME, Arlington, VA, 15-30. Ochi, M.K., 1990, Applied Probability and Stochastic Processes, John Wiley and Sons, New York. Ochi, M.K., Motter, L.E., 1973, Prediction of Slamming Characteristics and Hull Responses for Ship Design, SNAME Transactions, Vol. 81, 144-176. Omega Systems Group, 1994. "Risk Realities: Provoking a Fresh Approach to Managing Risk.” Pearce, H.T., Wen, Y.K., 1984, Stochastic Combination of Load Effects, J. of the Structural Division, ASCE, 110(7), 1613-1629. Ravindra, M.K., Cornell, C.A., Galambos, T.V., 1978, Wind and Snow Load Factors for Use in LRFD, J. of Structural Division, ASCE, 104(9), 1443-1457.. Ravindra, M.K., Galambos, T.V., 1978, Load and Resistance Factor Design for Steel, J. of Structural Division, ASCE, 104(9), 1337-1352. Richardson, W.M., 1987, A Probability Based Load Estimation Technique for Ship Structure Design and Technology Evaluation, Naval Engineers J., ASNE, May, 150-164. Rzhanitzyn, A.R., “Development of Probability Methods for the Design of Structures in the U.S.S.R. Translated by D.E. Allen in “A Statistical Method of Design of Building Structures,” National Research Council of Canada, Technical Translation No. 1368, Ottawa, 1969. Shin, Y.S., Chung, J.S., Lin, W., Zhang, S., Engle, A. “Dynamic Loadings for Structural Analysis of Fine Form Container Ship Based on a Non-linear Large Amplitude Motions and Loads Method”, SNAME Transactions, Vol. 105, 1997. Ship Structure Committee 318, 1983, “Fatigue Characterization of Fabricated Ship Details for Design”, Ship Structure Committee Report Number 318. Ship Structure Committee, 1997, Symposium and Workshop on the “Prevention of Fracture in Ship Structure”, Ship Structure Committee Report PFSS95, Washington, DC, 1997. Sieve, M., Waldman, J., Walz, R., and Sikora, J., 1997, LPD 17 Structural Design for Reliability and Survivability. Naval Sea System Command, U. S. Navy.
59
103. Sikora, J., Dinsenbacher, A., Beach, J. “A Method for Estimating Lifetime Loads and fatigue Lives for SWATH and Conventional Monohull Ships”, Naval Engineers Journal, May 1983. 104. Sikora, J., Dinsenbacher, A., Beach, J. “A Method for Estimating Lifetime Loads and fatigue Lives for SWATH and Conventional Monohull Ships”, Naval Engineers Journal, May 1983. 105. Sikora, J.P., Dinsenbacher, A., Beach, J. E., 1983, A Method for Estimating Lifetime Loads and Fatigue Lives for Swath and Conventional Monohull Ships, Naval Engineers J., May 1983, pp. 63-85. 106. Thayamballi, A.K., 1982, Fatigue Reliability of the Ship Hull Girder, Paper presented at the Northern California Section, SNAME, April 15, 1992, 61 p. 107. Thoft-Christensen, P., Baker, M.J., 1982, Structural Reliability Theory and Its Applications, Springer-Verlag, New York. 108. Thoft-Christensen, P., Murotsu, Y., 1986, Applications of Structural Systems Reliability Theory, Springer Verlag, Berlin. 109. Turkstra, G.J., Madsen, H.O., 1980, Load Combination in Codified Structural Design, J. of Structural Division, ASCE, 106(ST12), 2527-2543. 110. US Navy Design Manual, “Structural Design Manual for Naval Surface Ships”, Department of the Navy, Naval Ship Engineering Center, Washington, DC, 1979. 111. Wen, Y.K., 1977, Statistical Combination of Extreme Loads, J. of Structural Division, ASCE, 103(ST5), 1079-1093. 112. Wen, Y.K., 1990, Structural Load Modeling and Combination for Performance and Safety Evaluation, Elsevier, NY. 113. Wen, Y.K., Pearce, H.T., 1982, Combined Dynamic Effects of Correlated Load Processes, Nuclear Engineering and Design, Vol. 75, 179-189. 114. White, G.J., 1992, Fatigue of Ship Structural Details: A Probabilistic Approach for Design, Report, Division of Engineering and Weapons, U.S. Naval Academy, Annapolis, MD, 31 p. 115. White, G.J., Ayyub, B.M., 1985, Reliability Methods for Ship Structures, Naval Engineers Journal, ASNE, 9J(4), 86- 96. 116. White, G.J., Ayyub, B.M., 1987, Reliability- Based Fatigue Design for Ship Structures, Naval Engineers Journal, ASNE, 99(3), 135- 149. 117. White, G.J., Ayyub, B.M., 1987, Reliability-Based Design Formats for Marine Structures, J. of Ship Research, SNAME, 31(1), 60-69. 118. White, G.J., Ayyub, B.M., 1990, Semivariogram and Kriging Analysis in Developing Sampling Strategies, Proc. of the International Symposium on Uncertainty Modeling and Analysis, Ed. B.M. Ayyub, IEEE-CS, 360-365. 119. White, G.J., Ayyub, B.M., 1992, A Probabilistic-Based Methodology for Including Corrosion in the Structural Life Assessment of Marine Structures, Report EW-04-92, Division of Engineering and Weapons, U.S. Naval Academy, Annapolis, MD, 23 p. 120. White, G.J., Ayyub, B.M., 1992, Determining the Effects of Corrosion on Steel Structures: A Probabilistic Approach, 1992 Offshore Mechanics and Arctic Engineering Conference, Volume II, Safety and Reliability, 45-52. 121. Wilcox, R.C., Karaszewski, Z.I., and Ayyub, B.M., 1996, “Methodology for Risk-based Technology Applications to Marine System Safety,” Proceedings of the Ship Structures Symposium, SSC and SNAME, Arlington, VA, D1-D15.
60
122. Wirsching, P.H., Chen, Y. N., 1987, Considerations of Probability-Based Fatigue Design for Marine Structures, Proceedings of the Marine Structural Reliability Symposium, 31-43. 123. Wirsching, P.H., Wu, Y.-T., 1987, Advanced Reliability Methods for Structural Evaluation, J. of Engineering for Industry, 109, 19-23. 124. Wirsching, P.M., 1984, Fatigue Reliability for Offshore Structures, J. of Structural Engineering, 110(10), 2340-2356. 125. Wu, Y.-T., Wirsching, P.H., 1987, New Algorithm for Structural Reliability Estimation, J. of Engineering Mechanics, 113(9), 1319-1336. 126. Zadeh, L.A., 1983, A Computational Approach to Fuzzy Quantifiers in Natural Languages, Comp. & Maths. with Appls., 9(1), 149-184. 127. Zadeh, L.A., 1983, Linguistic Variables, Approximate Reasoning and Dispositions, Med. Inform., 8(3), 173-186. 128. Zadeh, L.A., 1983, The Role of Fuzzy Logic in the Management of Uncertainty in Expert Systems, Fuzzy Sets and Systems, 11, 199-227. 129. Zhang, S., Lin, W.M., Weems, K., “A Hybrid Boundary Element Method for Non-Wall Sided Bodies with or without Forward Speed”, International Workshop on Water Waves and Floating Bodies, March 1998. 130. Zhao, R. and O. Faltinsen, O., "Water Entry of Two-Dimensional Bodies”, Journal of Fluid Mechanics, vol. 246, pp. 593-612, 1993.
61