Hindawi Publishing Corporation International Journal of Distributed Sensor Networks Volume 2016, Article ID 8414157, 13 pages http://dx.doi.org/10.1155/2016/8414157
Research Article Face Recognition Based on Optimized Projections for Distributed Intelligent Monitoring Systems Aihua Yu,1 Huang Bai,1 Binbin Sun,1 Gang Li,1 and Beiping Hou2 1
Zhejiang Provincial Key Laboratory for Signal Processing, College of Information Engineering, Zhejiang University of Technology, Hangzhou, Zhejiang 310023, China 2 School of Automation and Electrical Engineering, Zhejiang University of Science and Technology, Hangzhou, Zhejiang 310023, China Correspondence should be addressed to Aihua Yu; yuaihua
[email protected] Received 17 September 2015; Revised 29 January 2016; Accepted 18 February 2016 Academic Editor: Federico Barrero Copyright © 2016 Aihua Yu et al. This is an open access article distributed under the Creative Commons Attribution License, which permits unrestricted use, distribution, and reproduction in any medium, provided the original work is properly cited. Compressive sensing (CS), as a new theory of signal processing, has found many applications. This paper deals with a CS-based face recognition system design. A novel framework, called projection matrix optimization- (PMO-) based compressive classification, is proposed for distributed intelligent monitoring systems. Unlike the sparse preserving projection (SPP) approach, the projection matrix is designed such that the coherence between different classes of faces is reduced and hence a higher recognition rate is expected. The optimal projection matrix problem is formulated as identifying a matrix that minimizes the Frobenius norm of the difference between a given target Gram and that of the equivalent dictionary. A class of analytical solutions is derived. With the PMO-based CS system, two frameworks are proposed for compressive face recognition. Experiments are carried out with five popularly utilized face databases (i.e., ORL, Yale, Yale Extend, CMU PIE, and AR) and simulation results show that the proposed approaches outperform those existing compressive ones in terms of the recognition rate and reconstruction error.
1. Introduction Face recognition (FR) has played a very important role in multimedia based applications. In spite of many years’ research, it remains an interesting and challenging research area [1]. Figure 1 depicts the conventional face recognition process. As it involves storing and transmitting high dimensional images, image compression techniques such as JPEG and JPEG2000 are used to alleviate the problem [2, 3]. At the receiver end, users have to decompress (reconstruct) images and extract the image features for classification. Such a procedure usually requires a lot of computations and hence makes the systems expensive. It can be much simplified if the images can be acquired using compressive sensing, which outputs features of images extracted directly, and the classification and reconstruction are done with the extracted features. See Figure 2. With the development of Internet of Things and information technology, the demand for the distributed intelligent image monitor systems, as shown in Figure 3, increases
greatly, which need an intelligent Internet end with the capacity of sensing and classifying. The cameras are connected by wireless Internet. The main problems with such a system are the transmission and storage of the images and the cost, including the infrastructure and the communications. To implement this architecture, technically speaking, there are several factors to consider: data storage space, RAM space, the computation time, and the transmission bandwidth. The key to solve these issues is to develop a data compression algorithm which can integrate the signal reconstruction and the classification with an accepted performance. Dimension reduction plays an extensively important role in high dimensional data analysis and studies. In recent years, many dimensionality reduction methods are successfully applied in pattern recognition [4, 5]. The principal component analysis (PCA) intends to represent faces by projecting the facial images to the directions of maximal covariance in the facial image data. One of the advantages of PCA is to reduce dimensionality of data but such an approach ignores the relationship between data in high dimensions. Linear
2
International Journal of Distributed Sensor Networks
Image acquisition
Compression
Decompression
Feature extraction
Classification
Figure 1: Block-diagram of the conventional FR Systems.
dimensional signal x from its low dimensional projection y which is mathematically of the form
Image compressive
Classification/recognition
y = Φx,
acquisition
Figure 2: Block-diagram for compressive sensing-based FR Systems.
discrimination analysis (LDA) explicitly attempts to model the difference between the classes of data. The Fisherface method combines PCA and the Fisher criterion to extract the information that discriminates the differences between the classes of a sample set. The projection matrix is chosen to maximize the ratio between the determinant of the betweenclass scatter matrix of the projected samples and that of the within-class scatter matrix. Nevertheless, Martinez et al. demonstrated that when the training data set is small, the eigenface method outperforms the Fisherface method. Some novel algorithms attempt to reduce the data dimensionality, while keeping the intrinsic characteristics. The local preserve project (LPP) aims to find embedding which can preserve local information and obtain a face subspace that best detects the essential face manifold structure. Because LPP has an excellent ability to find a better projection direction when the distances between classes are large, it can keep the local structure of the data very well. But when the distance between two classes is close or even partially overlapping, it can not process classification effectively due to the characteristics of keeping local information. The recently developed compressed sensing (CS) is a signal processing technique that can acquire a signal efficiently and reconstruct it by finding the solution to an undetermined linear system [6, 7]. Its essence is to achieve analog signal discretization with sampling-compression integration, namely, the analog-to-discrete CS. The basic principle of such a CS framework is similar to that of discrete-to-discrete CS [8, 9], which can be explained below. In the standard CS framework, it is assumed that the high dimension signals x ∈ R𝑁×1 can be represented as a linear combination of 𝐿 vectors {𝜓𝑘 }: 𝐿
x = ∑ 𝑠𝑘 𝜓𝑘 ≜ Ψs,
(1)
𝑘=1
where Ψ ∈ R𝑁×𝐿 is known as the dictionary (matrix), while s is ‖s‖0 -sparse vector with ‖s‖0 denoting the number of nonzero elements of s and corresponding x is said to be ‖s‖0 -sparse in the dictionary Ψ. The basic mathematical problem of CS is to study how to reconstruct the original high
(2)
where Φ ∈ R𝑀×𝑁 is called a projection matrix (it is also called measurement or sensing matrix, which will be used alternatively in this paper) with 𝑀 < 𝑁. Signal reconstruction means to find x from (2) with y and the pair (Φ, Ψ) given. There are two conditions under which recovery is possible. The first one is sparsity which requires the signals x to be sparse in some Ψ. The signal reconstruction problem is given as s ≜ arg min ̃s
s.t.
‖̃s‖0 y = Ãs,
(3)
where A ≜ ΦΨ is called equivalent dictionary. The solution to (3) is unique for sparse signals if A satisfies the restricted isometric property (RIP). See [6, 7]. The second condition is related to the mutual coherence [10, 11] of the equivalent dictionary A, which is defined below: A (:, 𝑖)𝑇 A (:, 𝑗) , (4) 𝜇 (A) ≜ max 1≤𝑖=𝑗≤𝐿 ̸ ‖A (:, 𝑖)‖2 A (:, 𝑗)2 where 𝑇 denotes the transpose operator. 𝜇(A) represents the worst-case coherence between any two atoms of A. As shown in [10], the 𝐾-sparse signal can be exactly recovered from the measurement as long as 𝜇 (A)
0 and 𝑤 > 0 are used to adjust the coherence between different classes and that between the columns of the same class, called correction parameter. These parameters should be chosen such that the off-diagonal elements of G𝑡 are all within [0, 1]. Such a target Gram G𝑡 is called discriminative Gram.
where W ≜ U𝑇Ψ Φ𝑇 ΦUΨ . Let
Comment 2. (i) In [12], sensing matrix optimization for block-sparse decoding was investigated. It is observed that our problem is the simplest block-sparse case, where the blocks are prefixed according to the classes of face images. G𝑡 is taken as the identity matrix in [12] and in our problem is assumed to be symmetric. Both encounter how to choose the weighting factors, which is application dependent and purely empirical. We will present some experimental results in the next section. (ii) It should be pointed out that though, as to be seen, the recognition/classification is done based on the errors ‖y − A𝑝 s‖2𝐹 , which has a physical meaning close to the reconstruction error, these errors have taken the discrimination between classes into account via all {A𝑝 } or the sensing matrix which is designed based on the discriminative Gram G𝑡 defined in (28). So, such a measure can be considered as a mixture of reconstruction error and discriminative error. It is worth noting that, in [22], a dictionary learning-based classification scheme was investigated where the dictionary was trained by certain class of signals as the classifier, while, in this paper, we consider the classification task in compressive domain. The sensing matrix is designed according to the given dictionary and hence the equivalent dictionary (corresponding to the compressive domain) possesses good property so that the sparse coding can be implemented accurately. In the next subsection, we will discuss how to solve the proposed optimal sensing matrix design problem.
Then,
3.2. An Algorithm for Optimizing Projection Matrix. With the target Gram G𝑡 defined in (28), one can now consider the optimal projection matrix design, which is formulated as follows: 2 G − G𝑡 𝐹
̂ = arg min Φ Φ
G = Ψ𝑇 Φ𝑇 ΦΨ.
s.t.
(31)
ΣΨ 0
̃ 𝑁 ̃ 𝑁×
where ΣΨ ∈ R
0 0
] V𝑇Ψ ,
(32)
G = VΨ [
0 0
]W[
ΣΨ 0 0 0
̃ 𝑁 ̃ 𝑁×
W11 ∈ R
] (34)
.
2 ΣΨ 0 𝑇 ΣΨ 0 2 ]W[ ] VΨ − G𝑡 G − G𝑡 𝐹 = VΨ [ 0 0 0 0 𝐹 Σ W Σ 0 2 Ψ 11 Ψ ̃ 𝑡 , ]−G ≜ [ 0 0 𝐹
] V𝑇Ψ ,
(35)
where ̃ 𝑡 ≜ V𝑇 G𝑡 VΨ = [ G Ψ s.t.
̃ 𝑁 ̃ 𝑁×
̃ 11 ∈ R G
̃ 12 ̃ 11 G G ̃ 21 G ̃ 22 G
] (36)
.
Finally, the cost function can be rewritten as 2 ̃ 2 ̃ 2 (37) ̃ 11 2 + G G − G𝑡 𝐹 = ΣΨ W11 ΣΨ − G 𝐹 𝑡 𝐹 − G11 𝐹 . We can see that the two right-hand sides have nothing to do with the projection matrix. Define ̃ 11 ≜ ΣΨ W11 ΣΨ . W
(38)
Equation (31) is equivalent to ̂ = arg min Φ Φ
̃ ̃ 11 2 . W11 − G 𝐹
(39)
̃ 11 = V𝑊Λ𝑊V𝑇 and G ̃ 11 = V𝑡 Λ𝑡 V𝑇 be an SVD and Let W 𝑡 𝑊 𝑡 ̃ 11 and G ̃ 11 , respectively. Furthereigen decomposition of W more, assume that both {Λ𝑊(𝑘, 𝑘)} and {Λ𝑡 (𝑘, 𝑘)} are in descending order. It then follows from [23] (see Corollary 7.4.9.3 in page 468) that ̃ ̃ 11 2 ≥ Λ𝑊 − Λ𝑡 2 ≜ W11 − G 𝐹 𝐹 V𝑊 = V𝑡 .
(40)
(41)
̃ 11 ) ≤ 𝑀, one can see that the lower Noting that rank(W bound can be minimized with Λ𝑊 (𝑘, 𝑘) {Λ𝑡 (𝑘, 𝑘) , ∀𝑘 ≤ 𝑀 that Λ𝑡 (𝑘, 𝑘) ≥ 0 ={ 0, ∀𝑘 ≤ 𝑀 that Λ𝑡 (𝑘, 𝑘) < 0. {
> 0. Then, we get ΣΨ 0
s.t.
W21 W22
and the lower bound (equality) is achieved if and only if
Now, let us consider how to solve the above problem. First of all, assume that Ψ has the following SVD: Ψ = UΨ [
W11 W12
W=[
(42)
̃ 11 and hence W11 : With (41) and (42), one has optimal W (33)
̃ 11 Σ−1 . ̃ 11 = V𝑡 Λ𝑊V𝑇 ⇒ W11 = Σ−1 W W 𝑡 Ψ Ψ
(43)
8
International Journal of Distributed Sensor Networks Let the following be an SVD of W11 :
Step 2. At the server that receives y, compute
Σ211 0 𝑇 W11 = V11 [ ] V11 . 0 0
(44)
V11 0
𝑇
Σ211 0 V11 0 ][ ][ ] , V22 0 V22 0 0 0
(45)
where V22 is any orthonormal matrix with dimensions (𝑁 − ̃ 𝑁). Since Φ𝑇 Φ = UΨ WU𝑇Ψ , a class of solutions to (31) is obtained as V11
0
0
V22
̂ = U [Σ11 0] [ Φ
𝑇
] U𝑇Ψ ,
(46)
where Σ11 ∈ R𝑀×𝑀 and U is any orthogonal matrix with dimension of 𝑀. Seen from the above discussion, the optimization of projection matrix Φ is only related to the dictionary Ψ and the correction constants 𝑤 and 𝜂, and, therefore, for given Ψ, 𝑤, and 𝜂, we can get Φ, which is better than traditional feature selecting process. And (46) is an analytical solution. In addition, there are two degrees of freedom U and V22 in the results, which provides the possibility to further improve system performance. Comment 3. Our proposed optimal sensing design problem shares the same form as that in [14]. It should be pointed out that, in [14], G𝑡 = GΨ and the solutions are relatively easy to obtain, while our G𝑡 is a generalization of GΨ and the solutions are actually applicable to any symmetric G𝑡 . In terms of applications, ours is for face recognition, in which the degrees of freedom, brought by the parameters 𝜂 and 𝑤, make our approach outperform that in [14]. 3.3. The Proposed CS-Based Frameworks for FR. With the ̂ any given high dimenobtained optimal sensing matrix Φ, sion face image x can be projected to a vector of much lower dimension, which will be transmitted to the server of the distributed monitoring system for classification/recognition. Two PMO-based classification methods are proposed here. The first one, denoted by AlgSRC PMO , has exactly the same SRC structure as AlgSRC and Alg PCA SPP , except that the projection matrix Φ is given by (46). 𝑙2 , is outlined as The second one, denoted by AlgPMO follows. 𝑙
2 𝐴𝑙𝑔𝑃𝑀𝑂
Step 1. At a subsystem that captures a face image x, compress it using ̂ y = Φx
̃s
2 y − A𝑝̃s , 𝑝 = 1, . . . , 𝑃, 2
(48)
where A𝑝 ∈ R𝑀×𝑄 is the equivalent dictionary for the 𝑝th ̂ = [A1 ⋅ ⋅ ⋅ A𝑝 ⋅ ⋅ ⋅ A𝑃 ]. class: A = ΦΨ
And set W12 = 0, W21 = 0, and W22 = 0; then W=[
𝜎𝑝2 ≜ min
(47)
and then encode and transmit y to the server of the distributed monitoring system.
̂ th class, where 𝑝 ̂ is Step 3 (classification). x belongs to the 𝑝 determined with ̂ ≜ arg min {𝜎𝑝2 } . 𝑝 𝑝∈{1,...,𝑃}
(49)
In the next section, we will examine the performance of the proposed algorithms and compare it with some existing ones.
4. Experiment Results In this section, we examine the performance of various classification systems on five face databases: ORL [24], Yale [25], Yale Extend [26] (referred to as Yale-E), CMU PIE [27] (referred to as PIE), and AR [28]: (i) ORL database contains 400 images of 40 individuals (each provides 10 images); that is, 𝑃 = 40. Some images are captured at different time, varying the lighting, facial expressions, and facial details. In our test, we randomly select 𝑄 = 5 images from each individual to form the dictionary set, while the remaining ones are for testing. (ii) Yale database contains 165 images of 15 individuals (i.e., 𝑃 = 15; each provides 11 images) under various illumination conditions and facial expressions. A random subset with 𝑄 = 5 images per individual is taken to form the dictionary set, and the rest of the database is used for testing. (iii) Yale-E database includes the Yale face database B and the extended Yale face database. A subset called Yale Extend face database is collected from these two databases, which contains 2414 face images of 38 subjects; that is, 𝑃 = 38. In our test, we randomly select 𝑄 = 20 images from each individual to form the dictionary set, while keeping the remaining for testing. (iv) PIE database is composed of 68 subjects (i.e., 𝑃 = 68) with 41368 face images which are captured by 13 synchronized cameras and 21 flashes, under varying pose, illumination, and expression. We generate a data set from it by selecting 184 images for each individual and totally 12512 samples are used in our experiments. 𝑄 = 20 images are sampled to form the dictionary set, while the remaining images are considered for testing. (v) AR database contains over 4000 color face images of 126 people (70 men and 56 women; i.e., 𝑃 = 126) taken during two distinct photo sessions (separated by two weeks), with different facial expression, lighting conditions, and occlusions. We choose 50 men and 50 women to generate a data set of 100
International Journal of Distributed Sensor Networks
9 1
1 0.9
0.95
0.7
Recognition rate
Recognition rate
0.8
0.6 0.5 0.4 0.3
0.9
0.85
0.8
0.2 0.1 0
0
1
2
𝜂=0 𝜂 = 0.02
3 4 5 6 7 Number of training samples Q
8
0.75
9
0
0.08
0.12
0.16
𝜂
𝜂 = 0.04 𝜂 = 0.06
Figure 4: Recognition rate versus number of training samples 𝑄 with 𝑤 = 2 and 𝜂 given in the legend.
0.04
ORL Yale Yale-E
PIE AR
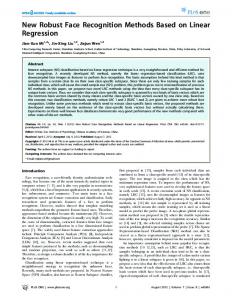
Figure 5: Recognition rate versus 𝜂 with 𝑀 = 80 and 𝑤 = 2. 0.96
For each of the five databases, we take all 𝑃 classes (different persons) with each class containing 𝑄 different samples (images), leading to 𝐿 = 𝑃𝑄. All images are resized to resolution of 32 × 32 and normalized in scale; hence, each face sample is represented as a column vector x ∈ R𝑁×1 with 𝑁 = 1024. By doing so, the corresponding dictionary Ψ ∈ R𝑁×𝐿 is then generated. The systems consisted of different compression methods (PCA, SPP, RDM for random sampling matrix, and PMO) and various classifiers (SRC, RSC, Wlearning for [22], and 𝑙2 ) are compared. For instance, AlgSRC PCA denotes the system combining PCA and SRC with the subscript referring to compression method and the superscript the classifier. 4.1. The Effect of 𝑄. Firstly, we briefly discuss the effect of the number of training samples with ORL database. Figure 4 𝑙2 versus 𝑄 with different 𝜂 values shows the results of AlgPMO and 𝑤 = 2, 𝑀 = 80. As can be seen, an increasing trend is obtained when 𝑄 gets bigger in general with slight fluctuation. It is reasonable that more samples are used for representation, and higher accuracy is achieved. In the following, proper 𝑄 values will be chosen for different databases as introduced in the beginning of this section. 4.2. The Choice of the Correction Parameter 𝜂. One highlight of the proposed PMO method is the correction parameter 𝜂. Now, we set up experiment for testing the effect of 𝜂. Fixing 𝑀 = 80 and 𝑤 = 2, the recognition rate versus the correction parameter 𝜂 is depicted in Figure 5.
0.95 Recognition rate
persons (each provides 26 images). Random selection of 𝑄 = 20 images per individual is taken to form the dictionary set, and the rest of the database is for testing.
0.94 0.93 0.92 0.91 0.9
0
0.02
0.04
0.06
0.08
0.1
0.12
0.14
0.16
𝜂 l
AlgSRC PMO
2 AlgPMO
AlgRSC PMO
AlgPMO
Wlearning
Figure 6: Recognition rate versus 𝜂 with various classifiers for 𝑀 = 80 and 𝑤 = 2.
It is clearly seen from the figure that the correction parameter 𝜂 does affect the performance of classification systems though the value should be chosen as database adapted. 4.3. Comparison of Different Classifiers. In this part, we turn to examine the performance of classification methods (i.e., SRC, RSC, 𝑙2 , and Wlearning) with PMO applied for compression. Figure 6 shows the recognition results with ORL database used. The computation times of different methods are given in Table 1. For this case, the proposed 𝑙2 classifier achieves the best results almost in every 𝜂. The recognition rates of RSC are comparable somewhere, but its computation complexity is
10
International Journal of Distributed Sensor Networks 1
Table 1: Computation time of different classifiers. Wlearning
AlgRSC PMO 29.80
AlgPMO 1.96
𝑙
2 AlgPMO 1.87
1 0.9 0.8 Recognition rate
0.8 Recognition rate
Time (s)
AlgSRC PMO 4.39
0.7
0.6 0.4 0.2
0.6 0.5
0
0.4
40
80
0.3
2 AlgSPP
l
2 AlgPMO
2 AlgPCA
0.1
2 AlgRDM
0
16
32
48
64
80
M AlgSRC SPP
AlgSRC PCA
AlgSRC RDM
AlgSRC PMO
l
2 AlgPMO
Figure 7: Recognition rates versus 𝑀.
much higher than the others as can be concluded from Table 1, and this is also why RSC is not suitable for large distributed system. 4.4. Comparison of Different Compression Methods. The scenarios where various compression methods are combined with the SRC are investigated and the statistical results are summarized in Table 2. The computation time with ORL database considered is given in Table 3. The data in Table 2 demonstrates the superiority of the proposed PMO methods. The computation times of various systems differ with each other in the projection matrix design methods, that is, dimensionality reduction procedure. PMO costs more time when compared with PCA. But the design process is an offline job, and it does not put any additional pressure on the front agents. 4.5. Recognition Rate versus Compression Dimension. In this part, we examine the performance of different systems with various compression rates on ORL database for 𝜂 = 0, 𝑤 = 2, and 𝑄 = 5. Four compression methods are conducted with SRC. In addition, PMO combined with the proposed 𝑙2 classifier is also carried out for comparison. Figure 7 displays the recognition accuracies versus measurement dimension 𝑀. As can be seen, higher recognition rates are obtained when bigger 𝑀 values are set. The results in Figure 7 are coincident with the statistics of Table 2 that PMO achieves
160
l
0.2
0
120 Dimension
200
l l
Figure 8: Recognition rate versus measurement dimension with AR database.
the best recognition rate, which is better than the results of PCA and RDM, and SPP once again performs the worst. 4.6. Effect of Occlusion. One of the most challenging problems in FR techniques is the robustness to face occlusion. In this subsection, we test the performance of our proposed method with different occlusion scenarios. The AR database consists of occlusion face images. Taking these samples for test, Figure 8 shows the recognition rates versus measurement dimension. This figure indicates that even for occlusion scenarios, as the measurement dimension increases, better recognition rate results can be achieved and SPP is the worst of all. Figure 9 depicts the recognition rates versus the occlusion percentage with ORL database used, and 𝑀 = 80, 𝜂 = 0.02, and 𝑤 = 2 for the proposed PMO. The results of Figure 9 demonstrate that SPP and RDM are more sensitive to the occlusion, and PMO and PCA always perform better than the other two. 4.7. Image Reconstruction Experiment. The PMO algorithm is applied to distributed intelligent monitoring system, and image reconstruction can be performed on the server terminal. Denote the test sample x ∈ R𝑁×1 and the reconstructed signal x̂ ∈ R𝑁×1 . The mean square error (MSE) is defined as 1 (50) ‖̂x − x‖22 . 𝑁 A popular used indicator to evaluate the image reconstruction accuracy is peak signal-to-noise ratio (PSNR) defined as 𝜎MSE ≜
2
𝜎PSNR ≜ 10 × log 10 [
(2𝑟 − 1) ] 𝜎MSE
(51)
with 𝑟 = 8 bits/pixel. Figure 10 shows the evaluation of 𝜎PSNR for varying measurement dimension 𝑀 with 𝜂 = 0.02 and 𝑤 = 2 for the proposed PMO.
International Journal of Distributed Sensor Networks
11
Table 2: Comparison of different compression methods with 𝑀 = 80, 𝜂 = 0.02, and 𝑤 = 2. ORL 92.20% 93.53% 46.75% 95.00%
AlgSRC RDM AlgSRC PCA AlgSRC SPP AlgSRC PMO
Database Yale-E 91.63% 92.21% 44.36% 91.89%
Yale 85.56% 92.22% 94.44% 93.26%
PIE 86.58% 89.71% 21.18% 90.68%
AR 93.60% 95.80% 74.46% 98.24%
1 0.9
Recognition rate
0.8 0.7 0.6 0.5 0.4 0.3 0.2 0.1
0
0.1
0.2
0.3 0.4 0.5 Occlusion (%)
0.6
0.7
0.8
l
l
2 AlgRDM
l
2 AlgSPP
2 AlgPCA
l
2 AlgPMO
Figure 9: Recognition rate versus occlusion percentage with ORL database tested.
50
Table 3: Computation time of different compression methods. AlgSRC SPP 5.07
AlgSRC RDM 3.82
AlgSRC PMO 4.39
Again, the results of PMO and PCA are similar and better than the others. Please note that as AlgSRC SPP performs much worse than the others, we omit it in this figure. One example is given in Figure 11 to demonstrate the visual effect of the proposed system.
45 40 PSNR
Time (s)
AlgSRC PCA 3.87
35 30 25 20 15
5. Conclusion This work presents a novel CS-based face recognition scheme for distributed intelligent monitoring systems. A new compression strategy has been proposed based on the projection matrix optimization. The analytical solution set of the corresponding optimization problem has also been derived. With this new compression method, two frameworks have been presented for compressive face recognition. Experimental results on face recognition tasks demonstrate the superiority of the proposed approaches. The monitor system always encounters the problem that we need to register new face and update the whole system. The FR oriented online CS system learning is an interesting
8
24
40
56
72
80
Dimension 2 AlgPMO
l
AlgSRC PCA
AlgSRC PMO
AlgSRC RDM
Figure 10: 𝜎PSNR versus measurement dimension 𝑀.
direction of research for distributed intelligent monitor system design. In our approach, the dictionary is formed directly with the samples. It is expected that more efficient FR oriented CS systems can be achieved if both the dictionary and the sensing matrix are optimized alternatively or simultaneously.
12
International Journal of Distributed Sensor Networks
(a)
(b)
Figure 11: Visual effect of the reconstructed image. (a) Test image. (b) Reconstructed image.
Competing Interests The authors declare that they have no competing interests.
Acknowledgments This work was supported by NSFC Grants 61273195, 61304124, 61473262, and 61503339 and ZJNSF Grants LY13F010009 and LQ14F030008.
References [1] W. Y. Zhao, R. Chellappa, P. J. Phillips, and A. Rosenfeld, “Face recognition: a literature survey,” ACM Computing Surveys, vol. 35, no. 4, pp. 399–458, 2003. [2] G. K. Wallace, “The JPEG still picture compression standard,” IEEE Transactions on Consumer Electronics, vol. 38, no. 1, 1992. [3] D. S. Taubman and M. W. Marcellin, JPEG2000 Image Compression Fundamentals, Standards and Practice, Kluwer Academic, New York, NY, USA, 2002. [4] W. Chen, M. J. Er, and S. Wu, “PCA and LDA in DCT domain,” Pattern Recognition Letters, vol. 26, no. 15, pp. 2474–2482, 2005. [5] M. Turk and A. Pentland, “Eigenfaces for recognition,” Journal of Cognitive Neuroscience, vol. 3, no. 1, pp. 72–86, 1991. [6] D. L. Donoho, “Compressed sensing,” Transactions on Information Theory, vol. 52, no. 4, pp. 1289–1306, 2006. [7] E. J. Candes and M. B. Wakin, “An introduction to compressive sampling,” IEEE Signal Processing Magazine, vol. 25, no. 2, pp. 21–30, 2008. [8] Y. Liu, X. Zhu, L. Zhang, and S. H. Cho, “Distributed compressed video sensing in camera sensor networks,” International Journal of Distributed Sensor Networks, vol. 2012, Article ID 352167, 10 pages, 2012. [9] W. Li, T. Jiang, and N. Wang, “Compressed sensing based on the characteristic correlation of ECG in hybrid wireless sensor network,” International Journal of Distributed Sensor Networks, vol. 2015, Article ID 325103, 8 pages, 2015. [10] D. L. Donoho and M. Elad, “Optimally sparse representation in general (nonorthonormal) dictionaries via ℓ1 minimization,” Proceedings of the National Academy of Sciences, vol. 100, no. 5, pp. 2197–2202, 2003. [11] M. Elad, “Optimized projections for compressed sensing,” IEEE Transactions on Signal Processing, vol. 55, no. 12, pp. 5695–5702, 2007. [12] L. Zelnik-Manor, K. Rosenblum, and Y. C. Eldar, “Sensing matrix optimization for block-sparse decoding,” IEEE Transactions on Signal Processing, vol. 59, no. 9, pp. 4300–4312, 2011.
[13] G. Li, Z. H. Zhu, D. H. Yang, L. P. Chang, and H. Bai, “On projection matrix optimization for compressive sensing systems,” IEEE Transactions on Signal Processing, vol. 61, no. 11, pp. 2887–2898, 2013. [14] N. Cleju, “Optimized projections for compressed sensing via rank-constrained nearest correlation matrix,” Applied and Computational Harmonic Analysis, vol. 36, no. 3, pp. 495–507, 2014. [15] H. Bai, G. Li, S. Li, Q. Li, Q. Jiang, and L. Chang, “Alternating optimization of sensing matrix and sparsifying dictionary for compressed sensing,” IEEE Transactions on Signal Processing, vol. 63, no. 6, pp. 1581–1594, 2015. [16] J. Wright, A. Y. Yang, A. Ganesh, S. S. Sastry, and Y. Ma, “Robust face recognition via sparse representation,” IEEE Transactions on Pattern Analysis and Machine Intelligence, vol. 31, no. 2, pp. 210–227, 2009. [17] L. Qiao, S. Chen, and X. Tan, “Sparsity preserving projections with applications to face recognition,” Pattern Recognition, vol. 43, no. 1, pp. 331–341, 2010. [18] M. Aharon, M. Elad, and A. Bruckstein, “K-SVD: an algorithm for designing overcomplete dictionaries for sparse representation,” IEEE Transactions on Signal Processing, vol. 54, no. 11, pp. 4311–4322, 2006. [19] T.-J. Chin and D. Suter, “Incremental kernel principal component analysis,” IEEE Transactions on Image Processing, vol. 16, no. 6, pp. 1662–1674, 2007. [20] K. Jia, T.-H. Chan, and Y. Ma, “Robust and practical face recognition via structured sparsity,” in Computer Vision— ECCV 2012: 12th European Conference on Computer Vision, Florence, Italy, October 7–13, 2012, Proceedings, Part IV, vol. 7575 of Lecture Notes in Computer Science, pp. 331–344, Springer, Berlin, Germany, 2012. [21] M. Yang, L. Zhang, J. Yang, and D. Zhang, “Robust sparse coding for face recognition,” in Proceedings of the IEEE Conference on Computer Vision and Pattern Recognition (CVPR ’11), pp. 625–632, Providence, RI, USA, June 2011. [22] J. Mairal, F. Bach, and J. Ponce, “Task-driven dictionary learning,” IEEE Transactions on Pattern Analysis and Machine Intelligence, vol. 34, no. 4, pp. 791–804, 2012. [23] R. A. Horn and C. R. Johnson, Matrix Analysis, Cambridge University Press, Cambridge, UK, 2nd edition, 2012. [24] F. S. Samaria and A. C. Harter, “Parameterisation of a stochastic model for human face identification,” in Proceedings of the 2nd IEEE Workshop on Applications of Computer Vision, pp. 138–142, December 1994. [25] F. S. A. Georghiades, P. N. Belhumeur, and D. J. Kriegman, “From few to many: illumination cone models for face recognition under variable lighting and pose,” IEEE Transactions on
International Journal of Distributed Sensor Networks Pattern Analysis and Machine Intelligence, vol. 23, no. 6, pp. 643– 660, 2001. [26] K.-C. Lee, J. Ho, and D. J. Kriegman, “Acquiring linear subspaces for face recognition under variable lighting,” IEEE Transactions on Pattern Analysis and Machine Intelligence, vol. 27, no. 5, pp. 684–698, 2005. [27] T. Sim, S. Baker, and M. Bsat, “The CMU pose, illumination, and expression (PIE) database,” in Proceedings of the 5th IEEE International Conference on Automatic Face Gesture Recognition (FGR ’02), pp. 53–58, Washington, DC, USA, May 2002. [28] A. M. Martinez and R. Benavente, “The AR face database,” CVC Technical Report 24, 1998.
13
International Journal of
Rotating Machinery
Engineering Journal of
Hindawi Publishing Corporation http://www.hindawi.com
Volume 2014
The Scientific World Journal Hindawi Publishing Corporation http://www.hindawi.com
Volume 2014
International Journal of
Distributed Sensor Networks
Journal of
Sensors Hindawi Publishing Corporation http://www.hindawi.com
Volume 2014
Hindawi Publishing Corporation http://www.hindawi.com
Volume 2014
Hindawi Publishing Corporation http://www.hindawi.com
Volume 2014
Journal of
Control Science and Engineering
Advances in
Civil Engineering Hindawi Publishing Corporation http://www.hindawi.com
Hindawi Publishing Corporation http://www.hindawi.com
Volume 2014
Volume 2014
Submit your manuscripts at http://www.hindawi.com Journal of
Journal of
Electrical and Computer Engineering
Robotics Hindawi Publishing Corporation http://www.hindawi.com
Hindawi Publishing Corporation http://www.hindawi.com
Volume 2014
Volume 2014
VLSI Design Advances in OptoElectronics
International Journal of
Navigation and Observation Hindawi Publishing Corporation http://www.hindawi.com
Volume 2014
Hindawi Publishing Corporation http://www.hindawi.com
Hindawi Publishing Corporation http://www.hindawi.com
Chemical Engineering Hindawi Publishing Corporation http://www.hindawi.com
Volume 2014
Volume 2014
Active and Passive Electronic Components
Antennas and Propagation Hindawi Publishing Corporation http://www.hindawi.com
Aerospace Engineering
Hindawi Publishing Corporation http://www.hindawi.com
Volume 2014
Hindawi Publishing Corporation http://www.hindawi.com
Volume 2014
Volume 2014
International Journal of
International Journal of
International Journal of
Modelling & Simulation in Engineering
Volume 2014
Hindawi Publishing Corporation http://www.hindawi.com
Volume 2014
Shock and Vibration Hindawi Publishing Corporation http://www.hindawi.com
Volume 2014
Advances in
Acoustics and Vibration Hindawi Publishing Corporation http://www.hindawi.com
Volume 2014