ISPRS Annals of the Photogrammetry, Remote Sensing and Spatial Information Sciences, Volume IV-2, 2018 ISPRS TC II Mid-term Symposium “Towards Photogrammetry 2020”, 4–7 June 2018, Riva del Garda, Italy
RESIDUAL SHUFFLING CONVOLUTIONAL NEURAL NETWORKS FOR DEEP SEMANTIC IMAGE SEGMENTATION USING MULTI-MODAL DATA Kaiqiang Chen1,2 , Michael Weinmann3 , Xin Gao1 , Menglong Yan1 , Stefan Hinz4 , Boris Jutzi4 , Martin Weinmann4 1
Key Laboratory of Spatial Information Processing and Application System Technology, Institute of Electronics, Chinese Academy of Sciences, Beijing, P.R. China -
[email protected],
[email protected],
[email protected] 2 University of Chinese Academy of Sciences, Beijing, P.R. China 3 Institute of Computer Science II, University of Bonn, Bonn, Germany -
[email protected] 4 Institute of Photogrammetry and Remote Sensing, Karlsruhe Institute of Technology, Karlsruhe, Germany (stefan.hinz, boris.jutzi, martin.weinmann)@kit.edu Commission II, WG II/4 KEY WORDS: Semantic Segmentation, Aerial Imagery, Multi-Modal Data, Deep Learning, CNN, Residual Network
ABSTRACT: In this paper, we address the deep semantic segmentation of aerial imagery based on multi-modal data. Given multi-modal data composed of true orthophotos and the corresponding Digital Surface Models (DSMs), we extract a variety of hand-crafted radiometric and geometric features which are provided separately and in different combinations as input to a modern deep learning framework. The latter is represented by a Residual Shuffling Convolutional Neural Network (RSCNN) combining the characteristics of a Residual Network with the advantages of atrous convolution and a shuffling operator to achieve a dense semantic labeling. Via performance evaluation on a benchmark dataset, we analyze the value of different feature sets for the semantic segmentation task. The derived results reveal that the use of radiometric features yields better classification results than the use of geometric features for the considered dataset. Furthermore, the consideration of data on both modalities leads to an improvement of the classification results. However, the derived results also indicate that the use of all defined features is less favorable than the use of selected features. Consequently, data representations derived via feature extraction and feature selection techniques still provide a gain if used as the basis for deep semantic segmentation.
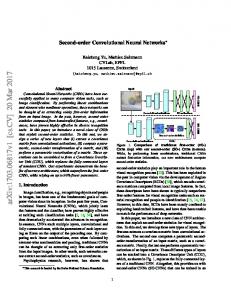
1. INTRODUCTION The semantic segmentation of aerial imagery in terms of assigning a semantic label to each pixel and thereby providing meaningful segments has been addressed in the scope of many recent investigations and applications. In this regard, much effort has been spent on the ISPRS Test Project on Urban Classification, 3D Building Reconstruction and Semantic Labeling1 , where one objective is given by a 2D semantic labeling of aerial imagery based on given multi-modal data in the form of true orthophotos and the corresponding Digital Surface Models (DSMs) (Rottensteiner et al., 2012; Cramer, 2010; Gerke, 2014) as shown in Figure 1. While the radiometric information preserved in an orthophoto can already be sufficient to distinguish specific classes, the geometric information preserved in the corresponding DSM might alleviate the separation of further classes, as each modality provides information about different aspects of the environment. Generally, the semantic segmentation of aerial imagery based on true orthophotos and the corresponding DSMs can be achieved via the extraction of hand-crafted features and the use of standard classifiers such as Random Forests (Gerke and Xiao, 2014; Weinmann and Weinmann, 2018) or Conditional Random Fields (CRFs) (Gerke, 2014). Nowadays, however, many investigations rely on the use of modern deep learning techniques which tend to significantly improve the classification results (Sherrah, 2016; Liu et al., 2017; Audebert et al., 2016; Audebert et al., 2017; Chen et al., 2018; Marmanis et al., 2016; Marmanis et al., 2018). 1 http://www2.isprs.org/commissions/comm3/wg4/tests.html
NIR-R-G
DSM
Reference
Figure 1. The challenge: given data in the form of a true orthophoto (left) and the corresponding DSM (center), a labeling close to the reference labeling (right) should be achieved, where the classes are given by Impervious Surfaces (white), Building (blue), Low Vegetation (cyan), Tree (green) and Car (yellow).
Some of these approaches also focus on using hand-crafted features derived from the true orthophotos or from their corresponding DSMs in addition to the given data as input to a deep learning technique. In this regard, the Normalized Difference Vegetation Index (NDVI) and the normalized Digital Surface Model (nDSM) are commonly used (Gerke, 2014; Audebert et al., 2016; Liu et al., 2017). Other kinds of hand-crafted features have however only rarely been involved so far although they might introduce valuable information for the semantic labeling task. In this paper, we focus on the deep semantic segmentation of aerial imagery based on multi-modal data. We extract a diversity of hand-crafted features from both the true orthophotos and their corresponding DSMs. Based on a separate and combined consideration of these radiometric and geometric features, we perform a supervised classification involving modern deep learning
This contribution has been peer-reviewed. The double-blind peer-review was conducted on the basis of the full paper. https://doi.org/10.5194/isprs-annals-IV-2-65-2018 | © Authors 2018. CC BY 4.0 License.
65
ISPRS Annals of the Photogrammetry, Remote Sensing and Spatial Information Sciences, Volume IV-2, 2018 ISPRS TC II Mid-term Symposium “Towards Photogrammetry 2020”, 4–7 June 2018, Riva del Garda, Italy
techniques. As standard deep networks (Krizhevsky et al., 2012; Simonyan and Zisserman, 2014) are composed of many layers to learn complex non-linear relationships, such networks tend to suffer from the vanishing gradient problem if they are very deep, i.e. the gradients backpropagated through the layers become very small so that the weights in early layers of the network are hardly changed. This, in turn, causes a decrease in the predictive accuracy of the network and can be resolved by using a Residual Network (ResNet) (He et al., 2016a). Relying on the ResNet architecture originally intended to classify image patches, we present a modified ResNet architecture that allows a dense semantic image labeling. More specifically, we make use of the ResNet-34 architecture and introduce both atrous convolution and a shuffling operator to achieve a semantic labeling for each pixel of the input imagery. We denote the resulting deep network as Residual Shuffling Convolutional Neural Network (RSCNN). Via performance evaluation on a benchmark dataset, we quantify the effect of considering the different modalities separately and in combination as input to the RSCNN. Thereby, we observe that the additional extraction of different types of geometric features based on the DSM and the definition of corresponding feature maps for the RSCNN leads to an improvement of the classification results, and that the best classification results are achieved when using selected feature maps and not when using all defined feature maps.
field-of-view without increasing the computational burden, ii) atrous spatial pyramid pooling to allow for robustly segmenting objects at multiple scales and iii) a combination of the responses at the final layer with a fully-connected CRF to improve localization accuracy. Instead of using a deconvolution to recover the spatial resolution, an efficient sub-pixel convolution layer involving a periodic shuffling operator has been proposed to upscale feature maps (Shi et al., 2016; Chen et al., 2018).
After briefly summarizing related work (Section 2), we explain the proposed methodology for the deep semantic segmentation of aerial imagery based on multi-modal data (Section 3). Subsequently, we demonstrate the performance of our methodology by presenting and discussing results achieved for a standard benchmark dataset (Sections 4 and 5). Finally, we provide concluding remarks and suggestions for future work (Section 6).
While lots of investigations focused on the improvement of the classification pipeline, however, only little attention has been paid to the input data itself. On the one hand, a true end-to-end processing pipeline from orthophotos and the corresponding DSMs to a semantic labeling (Marmanis et al., 2016) seems desirable. On the other hand, however, it remains unclear to which degree the use of hand-crafted features derived from the orthophotos or their corresponding DSMs in the form of additional feature maps serving as input to the deep network can still affect the quality of the semantic labeling. Such hand-crafted features have already been involved with the Normalized Difference Vegetation Index (NDVI) and the normalized Digital Surface Model (nDSM) (Gerke, 2014; Audebert et al., 2016; Liu et al., 2017), yet other kinds of hand-crafted radiometric or geometric features which can be extracted from a local image neighborhood (Gerke and Xiao, 2014; Tokarczyk et al., 2015; Weinmann and Weinmann, 2018) have only rarely been involved so far although they might introduce valuable information for the semantic labeling task.
2. RELATED WORK For many years, the semantic segmentation of aerial imagery based on multi-modal data has typically been addressed by extracting a set of hand-crafted features (Gerke and Xiao, 2014; Tokarczyk et al., 2015; Weinmann and Weinmann, 2018) and providing them as input to a standard classifier such as a Random Forest (Weinmann and Weinmann, 2018) or a Conditional Random Field (CRF) (Gerke, 2014). Due to the great success of modern deep learning techniques in the form of Convolutional Neural Networks (CNNs), however, many investigations nowadays focus on the use of such techniques for semantically segmenting aerial imagery as they tend to significantly improve the classification results. Regarding semantic image segmentation, the most popular deep learning techniques are represented by Fully Convolutional Networks (FCNs) (Long et al., 2015; Sherrah, 2016) and encoderdecoder architectures (Volpi and Tuia, 2017; Badrinarayanan et al., 2017). The latter are composed of an encoder part which serves for the extraction of multi-scale features and a decoder part which serves for the recovery of object details and the spatial dimension and thus addresses a more accurate boundary localization. A meanwhile commonly used encoder-decoder structure has been proposed with the SegNet (Badrinarayanan et al., 2017). To aggregate multi-scale predictions, a modification of the SegNet introduces a multi-kernel convolutional layer to perform convolutions with several filter sizes (Audebert et al., 2016). Further developments have been presented with the DeepLab framework (Chen et al., 2016) including i) atrous convolution by introducing upsampled filters to incorporate context within a larger
Specifically addressing semantic segmentation based on multimodal data in the form of orthophotos and the corresponding DSMs, different strategies to fuse the multi-modal geospatial data within such a deep learning framework have been presented (Marmanis et al., 2016; Audebert et al., 2016; Audebert et al., 2017; Liu et al., 2017), while the consideration of semantically meaningful boundaries in the SegNet encoder-decoder architecture and also in FCN-type models has been addressed by including an explicit object boundary detector to better retain the boundaries between objects in the classification results (Marmanis et al., 2018). As an alternative to involving a boundary detector, it has been proposed to discard fully-connected layers (which reduce localization accuracy at object boundaries) and to additionally avoid the use of unpooling layers (which are more complicated and e.g. used in SegNet) (Chen et al., 2017).
In this paper, we investigate the value of different types of handcrafted features for the semantic segmentation of aerial imagery based on multi-modal data. We extract a diversity of hand-crafted features from both the true orthophotos and their corresponding DSMs. Thereby, we involve hand-crafted radiometric features such as the NDVI and one of its variants, but also radiometric features derived from transformations in analogy to the definition of color invariants (Gevers and Smeulders, 1999). Furthermore, we involve hand-crafted geometric features in the form of the nDSM (Gerke, 2014) and features extracted from the 3D structure tensor and its eigenvalues. While the analytical consideration of these eigenvalues allows reasoning about specific object structures (Jutzi and Gross, 2009), we use the eigenvalues to define local 3D shape features (West et al., 2004; Demantk´e et al., 2011; Weinmann et al., 2015; Hackel et al., 2016) which can efficiently be calculated on the basis of local image neighborhoods (Weinmann, 2016; Weinmann and Weinmann, 2018). Based on a separate and combined consideration of these radiometric and geometric features, we perform a supervised classification using a deep network. For the latter, we take into account the potential of the Residual Network (ResNet) (He et al., 2016a) in comparison
This contribution has been peer-reviewed. The double-blind peer-review was conducted on the basis of the full paper. https://doi.org/10.5194/isprs-annals-IV-2-65-2018 | © Authors 2018. CC BY 4.0 License.
66
ISPRS Annals of the Photogrammetry, Remote Sensing and Spatial Information Sciences, Volume IV-2, 2018 ISPRS TC II Mid-term Symposium “Towards Photogrammetry 2020”, 4–7 June 2018, Riva del Garda, Italy
to standard networks like AlexNet (Krizhevsky et al., 2012) and the VGG networks (Simonyan and Zisserman, 2014) as it allows for a higher predictive accuracy due to its capability of reducing the problem of vanishing gradients. Relying on the ResNet-34 architecture, we introduce both atrous convolution (Chen et al., 2016) and a shuffling operator (Chen et al., 2018) to assign each pixel of the input imagery a semantic label. 3. METHODOLOGY The proposed methodology addresses the semantic interpretation of aerial imagery by exploiting data of several modalities (Section 3.1) which are provided as input to a deep network (Section 3.2). The result is a dense labeling, i.e. each pixel is assigned a respective semantic label. 3.1
Feature Extraction
Given a true orthophoto and the corresponding DSM on a regular grid, the information may be stored in the form of a stack of feature maps (i.e. images containing the values of a respective feature on a per-pixel level), whereby three feature maps correspond to the spectral bands used for the orthophoto and one feature map corresponds to the DSM. Further information can easily be taken into account by adding respective feature maps. In total, we define eight radiometric features (Section 3.1.1) and eight geometric features (Section 3.1.2) for the given regular grid. Based on these features, we define corresponding feature maps which serve as input to a CNN.
which is more sensitive to the chlorophyll concentration than the original NDVI. 3.1.2 Geometric Features In addition to the radiometric features, we extract a set of geometric features. The most intuitive idea in this regard is to take into account that the heights of objects above ground are more informative than the DSM itself. Consequently, we use the DSM to calculate the normalized Digital Surface Model (nDSM) via the approach presented in (Gerke, 2014). This approach relies on first classifying pixels into ground and off-ground pixels using the LAStools software2 . Subsequently, the height of each off-ground pixel is adapted by subtracting the height of the closest ground point. Besides the nDSM, we involve a set of local shape features extracted from the DSM as geometric features. Using the spatial 3D coordinates corresponding to a local 3×3 image neighborhood, we efficiently derive the 3D covariance matrix also known as the 3D structure tensor (Weinmann, 2016; Weinmann and Weinmann, 2018). The eigenvalues of the 3D structure tensor are normalized by their sum which results in normalized eigenvalues λ1 , λ2 and λ3 with λ1 ≥ λ2 ≥ λ3 ≥ 0 and λ1 +λ2 +λ3 = 1. The normalized eigenvalues, in turn, are used to calculate the features of linearity L, planarity P , sphericity S, omnivariance O, anisotropy A, eigenentropy E and change of curvature C (West et al., 2004; Pauly et al., 2003) which have been involved in a variety of investigations for 3D scene analysis (Demantk´e et al., 2011; Weinmann et al., 2015; Hackel et al., 2016):
3.1.1 Radiometric Features In our work, we assume that the spectral bands used for the orthophoto comprise the near-infrared (NIR), red (R) and green (G) bands (Cramer, 2010; Rottensteiner et al., 2012; Gerke, 2014). Accordingly, we define the reflectance in the near-infrared domain, in the red domain and in the green domain as features denoted by the variables RNIR , RR and RG , respectively. In addition, we consider color invariants as features. In analogy to the definition of color invariants derived from RGB imagery to improve robustness with respect to changes in illumination, we consider normalized colors which represent a simple example of such color invariants (Gevers and Smeulders, 1999): RnNIR
=
RnR
=
RnG
=
RNIR RNIR + RR + RG RR RNIR + RR + RG RG RNIR + RR + RG
3.2
RNIR − RR RNIR + RR
(2) (3)
(4)
and represents a strong indicator for vegetation. A slight variation of this definition by replacing RR with RG results in the Green Normalized Difference Vegetation Index (GNDVI) (Gitelson and Merzlyak, 1998) defined as GNDVI =
RNIR − RG RNIR + RG
=
P
=
S
=
O
=
A
=
E
=
C
=
λ1 − λ2 λ1 λ2 − λ3 λ1 λ3 λ1
p 3
λ1 λ2 λ3 λ1 − λ3 λ1 −λ1 ln (λ1 ) − λ2 ln (λ2 ) − λ3 ln (λ3 ) λ3 λ1 + λ2 + λ3
(6) (7) (8) (9) (10) (11) (12)
Supervised Classification
(1)
Besides these features derived via radiometric transformation, we extract further radiometric features in the form of spectral indices. In this regard, the Normalized Difference Vegetation Index (NDVI) (Rouse, Jr. et al., 1973) is defined as NDVI =
L
(5)
For classification, we focus on the use of modern deep learning techniques in the form of convolutional neural networks, where standard networks like AlexNet (Krizhevsky et al., 2012) and the VGG networks (Simonyan and Zisserman, 2014) are composed of a collection of convolutional layers, max-pooling layers and activation layers followed by fully-connected classification layers. The use of deep networks with many layers allows learning complex non-linear relationships, yet it has been found that the performance of very deep networks tends to decrease when adding further layers via simply stacking convolutional layers as indicated in the left part of Figure 2. This is due to the vanishing gradient problem during training, i.e. the gradient of the error function decreases when being backpropagated to previous layers and, if the gradient becomes too small, the respective weights of the network remain unchanged (He et al., 2016b). One of the most effective ways to address this issue is given with the Residual Network (ResNet) (He et al., 2016a) whose architecture is characterized by basic units as shown in the center part of Figure 2. These basic units, in turn, contain an identity mapping of 2 http://rapidlasso.com/lastools/
This contribution has been peer-reviewed. The double-blind peer-review was conducted on the basis of the full paper. https://doi.org/10.5194/isprs-annals-IV-2-65-2018 | © Authors 2018. CC BY 4.0 License.
67
ISPRS Annals of the Photogrammetry, Remote Sensing and Spatial Information Sciences, Volume IV-2, 2018 ISPRS TC II Mid-term Symposium “Towards Photogrammetry 2020”, 4–7 June 2018, Riva del Garda, Italy
XL
XL
BN
Conv
Conv BN ReLU
BN
ReLU
ReLU
Conv BN ReLU
BN
BN
Conv Addition
ReLU
Addition
ReLU
XL+1
XL+1
y[i] =
K X
x[i + r · k]w[k],
(13)
k=1
Conv
Conv
networks adopting a larger atrous rate will have a larger fieldof-view, thus resulting in better performance. Considering a onedimensional signal x[i], the output y[i] of atrous convolution with a filter w[k] of length K is defined as
XL
XL+1
Figure 2. Three popular network connection styles: plain structure (left), original residual structure (center) and full preactivation residual structure (right): the convolutional layers in residual structures are characterized by the number of filters n, the atrous rate r and the stride s (first convolutional layer: n, r, s; second convolutional layer: n, r = 1, s = 1).
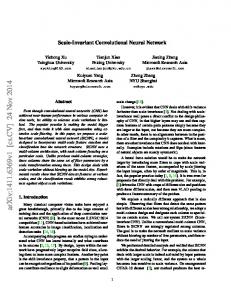
the input of the basic unit and are motivated by the fact that optimizing the residual mapping is easier than optimizing the original mapping. The additional gain in computational efficiency allows to form deep networks with more than 100 convolutional layers. A further upgrade of the original residual structure to full preactivation style (He et al., 2016b) is indicated in the right part of Figure 2 and has proven to be favorable in theory and through experiments as no ReLU layer will impede the flow of information and the backpropagation of errors. We make use of residual blocks as shown in the right part of Figure 2 to define our deep network. Therefore, each residual block is parameterized by the number of filters n, atrous rate r and stride s. Relying on these residual blocks, we use the structure of a ResNet-34 and modify it to the task of dense labeling by introducing atrous convolution (Chen et al., 2016) and a shuffling operator (Chen et al., 2018). Thereby, we take into account that pooling layers or convolutional layers with a stride larger than 1 will cause a reduction of the resolution. We refer to such layers as Resolution Reduction Layers (RRLs). To avoid severe resolution reduction and thus spatial information loss, we only keep the first three RRLs and change the strides of the remaining RRLs to 1. In addition, we remove the layer of global average pooling and its subsequent layers to allow for image segmentation. The resulting network is referred to as Residual Shuffling Convolutional Neural Network (RSCNN) and shown in Figure 3. Atrous Convolution As the field-of-view of the deeper layers will shrink after removing RRLs, we involve atrous convolution (Chen et al., 2016) which can be used to compute the final CNN responses at an arbitrary resolution through re-purposing the networks trained on image classification to semantic segmentation and to enlarge the field-of-view of filters without the need for learning any extra parameters. Experiments also reveal that
where r is the atrous rate. For r = 1, this corresponds to the standard convolution. The use of atrous convolution in our work thus follows the principles mentioned in (Chen et al., 2016). Shuffling Operator To achieve a dense prediction, we involve a shuffling operator to increase the resolution by combining feature maps in a periodic shuffling manner. The concept of the shuffling operator has been originally introduced for super-resolution (Shi et al., 2016) and it aims at the upscaling of feature maps. Inspired by this idea, it has been proposed to introduce this operator for the semantic segmentation of aerial imagery (Chen et al., 2018), and respective experiments reveal that the use of a shuffling operator improves the predictive accuracy through forcing networks to learn upscaling. For example, if we need to double the resolution of the feature map, we can combine four feature maps as shown in Figure 4, which can be expressed as I 0 (ci , x, y)
=
I(ci × u2 + mod(y, u) × u x y + mod(x, u), b c, b c), u u
(14) (15)
where I 0 refers to the feature map after the combination, I refers to the feature map before the combination, ci refers to the order of the feature map and (x, y) is the location. The only hyperparameter for the shuffling operator is the upscaling rate u. In our experiments, we adopt the shuffling operator with an upscaling rate of u = 4 and bilinear interpolation to recover the spatial resolution as done in (Chen et al., 2018).
4. EXPERIMENTAL RESULTS In the following, we first describe the used dataset (Section 4.1). Subsequently, we summarize the conducted experiments (Section 4.2) and, finally, we present the derived results (Section 4.3). 4.1
Dataset
For our experiments, we use the Vaihingen Dataset (Cramer, 2010; Rottensteiner et al., 2012) which was acquired over a relatively small village with many detached buildings and small multi-story buildings. This dataset contains 33 patches of different sizes, whereby the given regular grid corresponds to a ground sampling distance of 9 cm. For 16 patches, a very high-resolution true orthophoto and the corresponding DSM derived via dense image matching techniques are provided as well as a reference labeling with respect to six semantic classes represented by Impervious Surfaces, Building, Low Vegetation, Tree, Car and Clutter/Background. According to the specifications, the class Clutter/Background includes water bodies and other objects such as containers, tennis courts or swimming pools. We use 11 of the labeled patches for training and the remaining 5 labeled patches for evaluation.3 3 Please note that the definition of training and test data thus differs from the one used for the ISPRS benchmark.
This contribution has been peer-reviewed. The double-blind peer-review was conducted on the basis of the full paper. https://doi.org/10.5194/isprs-annals-IV-2-65-2018 | © Authors 2018. CC BY 4.0 License.
68
/8
X6
/8
X3
/8
/8
Shuffling, u = 4
X3
1x1, Conv, 6xu2
/8
Residual Block - n = 512 - r=4 - s=1
/4
Residual Block - n = 256 - r=2 - s=1
X3
Residual Block - n = 128 - r=1 - s=1
/4
Residual Block - n = 128 - r=1 - s=2
/2
Residual Block - n = 64 - r=1 - s=1
Input
Pooling, /2
7x7, Conv, 64, /2
ISPRS Annals of the Photogrammetry, Remote Sensing and Spatial Information Sciences, Volume IV-2, 2018 ISPRS TC II Mid-term Symposium “Towards Photogrammetry 2020”, 4–7 June 2018, Riva del Garda, Italy
u/8 Output
Figure 3. The overall structure of our Residual Shuffling Convolutional Neural Network (RSCNN): the symbol “/2” in the convolutional block refers to the stride of the convolutional layers and symbols like “/2” upon arrows indicate that the resolution is reduced to half of the input in length, while symbols like “X3” after a residual block indicate that the corresponding block is repeated three times.
A1
A2
B1
B2
A3
A4
B3
B4
C1
C2
D1
D2
C3
C4
D3
D4
Shuffling Operator
A1
B1
A2
B2
C1
D1
C2
D2
A3
B3
A4
B4
C3
D3
C4
D4
In all experiments, the Patches 1, 3, 5, 7, 13, 17, 21, 23, 26, 32 and 37 are used to train the deep network, while the Patches 11, 15, 28, 30 and 34 are used for performance evaluation. As evaluation metrics, we consider the Overall Accuracy (OA), the mean F1 score across all classes (mF1 ) and the mean Intersection-overUnion (mIoU). To reason about the performance for each single class, we additionally consider the classwise F1 -scores. 4.3
Figure 4. Basic concept of the shuffling operator: it converts c × u2 feature maps of size H × W into c feature maps of size (H × u) × (W × u). Here: H = 2, W = 2, u = 2, c = 1.
4.2
Experiments
For each orthophoto and the corresponding DSM, we extract the set of hand-crafted features (cf. Section 3.1). Based on the orthophoto, we derive eight feature maps containing radiometric information with respect to the reflectance in the near-infrared (NIR), red (R) and green (G) domains, the normalized nearinfrared (nNIR), normalized red (nR) and normalized green (nG) values, the Normalized Difference Vegetation Index (NDVI) and the Green Normalized Difference Vegetation Index (GNDVI). Based on the DSM, we derive eight feature maps containing geometric information with respect to the normalized Digital Surface Model (nDSM), linearity (L), planarity (P), sphericity (S), omnivariance (O), anisotropy (A), eigenentropy (E) and change of curvature (C). A visualization of the behavior of these features for a part of the considered scene is provided in Figure 5. Then, we focus on a separate and combined consideration of radiometric and geometric information as input to the RSCNN (cf. Section 3.2). We train and evaluate our network using the MXNet library (Chen et al., 2015) on one NVIDIA TITAN X GPU with 12 GB RAM. The network parameters are initialized using the method introduced in (He et al., 2015). Regarding the choice of the loss function, we use the cross-entropy error which is summed over all the pixels in a batch of 16 patches. To optimize this objective function, we use the standard Stochastic Gradient Descent (SGD) with a momentum of 0.9. During training, the samples in each batch are represented by patches of 56 × 56, 112 × 112, 224 × 224 and 448 × 448 pixels for 200 epochs, 50 epochs, 30 epochs and 20 epochs, respectively. The learning rate is kept at 0.01 as the adaptation of Batch Normalization (BN) (Ioffe and Szegedy, 2015) allows for training with a big training rate. Each patch fed into the network is normalized by the subtraction of the mean value and a subsequent division by the standard deviation. In contrast to the common strategy that prepares patches beforehand, and in which patches are regularly cropped from the original large images and then saved on hard-disks before training, each sample is cropped randomly and temporarily in our experiments as proposed in (Chen et al., 2017).
Results
The classification results derived for different subsets of the defined feature maps are provided in Table 1. This table also contains information about the number of parameters as well as the time required to train the RSCNN for the respective input data. For selected subsets, the achieved labeling is visualized in Figures 6 and 7 for a part of Patch 30 of the Vaihingen Dataset. 5. DISCUSSION The derived results (cf. Table 1) clearly indicate that reasonable classification results can already be achieved by only considering true orthophotos (OA = 84.59%, mF1 = 82.81%, mIoU = 59.54%). In contrast, the classification results are significantly worse when only considering geometric information (OA = 70.95 . . . 76.07%, mF1 = 59.58 . . . 71.04%, mIoU = 39.00 . . . 47.45%). For the class Building, the corresponding F1 score reveals a slight decrease in most cases. However, the decrease is more significant for the other classes, particularly for the classes Low Vegetation and Car for which the F1 -scores are reduced by more than 20%. The fusion of radiometric and geometric information improves the classification results. While the mF1 and mIoU reach an almost constant level around 83% and 60%, respectively, the OA is improved up to 85.69% when using the NIR, R, G, nDSM, NDVI, L, P and S feature maps as input to the classifier. The derived results also reveal that considering the NDVI feature map in addition to the NIR, R, G and nDSM feature maps does not yield better classification results which is in accordance with insights of other investigations (Gerke, 2014). In contrast, the consideration of geometric cues given in the L, P and S feature maps in addition to the NIR, R, G and nDSM feature maps leads to slightly improved classification results. Interestingly, the best classification result is not obtained for the case when all feature maps are used as input to the network (cf. Table 1). This effect is likely to indicate the Hughes phenomenon (Hughes, 1968; Guyon and Elisseeff, 2003) characterized by a decrease in classification accuracy when increasing the number of considered features. This might be due to the fact that redundant and possibly even irrelevant features are included in the semantic segmentation task. As a consequence, the end-to-end processing pipeline with a deep network should still involve feature extraction and feature selection techniques to select appropriate input data for the network.
This contribution has been peer-reviewed. The double-blind peer-review was conducted on the basis of the full paper. https://doi.org/10.5194/isprs-annals-IV-2-65-2018 | © Authors 2018. CC BY 4.0 License.
69
ISPRS Annals of the Photogrammetry, Remote Sensing and Spatial Information Sciences, Volume IV-2, 2018 ISPRS TC II Mid-term Symposium “Towards Photogrammetry 2020”, 4–7 June 2018, Riva del Garda, Italy
NIR
R
G
nNIR
nR
nG
NDVI
GNDVI
nDSM
L
P
S
O
A
E
C
Figure 5. Visualization of the used radiometric information (first and second row) and the used geometric information (third and fourth row) for a part of Patch 30: the color encoding reaches from blue (low values) via green (medium values) to yellow (high values).
The visualizations of derived results for semantic segmentation (cf. Figure 6) additionally reveal discontinuities in the final prediction when using only radiometric features or only geometric features. These artifacts in the classification results arise from the fact that, due to the limited GPU memory, the whole image is partitioned into patches of 448 × 448 pixels and these patches are fed into the network for prediction. Compared to the pixels at the center of patches, the marginal pixels have a smaller field-ofview which may result in inaccurate predictions and discontinuities. Indeed, the visualized results correspond to the bottom right part of Patch 30. When using both radiometric and geometric information, this issue is resolved as the geometric and radiometric information are complementary and their combination allows a better prediction. When visualizing the used radiometric and geometric features (cf. Figure 5), particularly the nDSM reveals
non-intuitive characteristics as local constraints like horizontal ridge lines are not preserved. Consequently, a potential source for improvement could be to directly approximate the topology of the considered scene from the spatial 3D coordinates using spatial bins and a coarse-to-fine strategy (Blomley and Weinmann, 2017) instead of using the LAStools software to derive the nDSM (Gerke, 2014). 6. CONCLUSIONS In this paper, we have focused on the use of multi-modal data for the semantic segmentation of aerial imagery. Using true orthophotos, the corresponding DSMs and further representations derived from both of them, we have defined different sets of feature maps as input to a deep network. For the latter, we
This contribution has been peer-reviewed. The double-blind peer-review was conducted on the basis of the full paper. https://doi.org/10.5194/isprs-annals-IV-2-65-2018 | © Authors 2018. CC BY 4.0 License.
70
ISPRS Annals of the Photogrammetry, Remote Sensing and Spatial Information Sciences, Volume IV-2, 2018 ISPRS TC II Mid-term Symposium “Towards Photogrammetry 2020”, 4–7 June 2018, Riva del Garda, Italy
Considered Feature Maps NIR-R-G DSM nDSM L-P-S nDSM-L-P-S NIR-R-G-DSM NIR-R-G-nDSM NIR-R-G-nDSM-NDVI NIR-R-G-nDSM-NDVI-L-P-S Radiometry Geometry Radiometry & Geometry
NP 21.1448 M 21.1385 M 21.1385 M 21.1448 M 21.1479 M 21.1479 M 21.1479 M 21.1510 M 21.1542 M 21.1604 M 21.1604 M 21.1855 M
ttrain 5h 3h 3h 5h 6h 6h 6h 7h 7h 7h 7h 10 h
F1 (IS) 86.29 72.45 68.20 72.01 73.70 86.75 87.41 87.43 87.63 86.60 74.44 87.65
F1 (B) 91.42 89.27 88.78 84.74 90.26 92.44 92.98 92.64 92.81 91.31 90.45 92.72
F1 (LV) 75.03 52.80 46.92 54.08 54.90 75.27 75.61 75.75 76.31 75.34 57.23 75.47
F1 (T) 85.01 78.81 76.83 78.30 79.40 85.16 85.25 85.30 85.47 85.08 80.00 85.11
F1 (C) 76.29 47.89 17.16 52.81 53.56 77.75 77.40 75.68 76.55 75.45 53.08 75.82
OA 84.59 74.12 70.95 72.78 75.30 85.06 85.47 85.42 85.69 84.72 76.07 85.40
mF1 82.81 68.24 59.58 68.39 70.37 83.47 83.73 83.36 83.76 82.76 71.04 83.35
mIoU 59.54 44.97 39.00 44.51 46.81 60.11 60.89 60.03 60.48 59.24 47.45 60.35
Table 1. Number of parameters NP , training time ttrain and derived classification results for different subsets of the defined feature maps serving as input to the RSCNN: the F1 -scores and the values for OA, mF1 and mIoU are given in % and the classes are abbreviated (IS: Impervious Surfaces; B: Building; LV: Low Vegetation; T: Tree; C: Car).
Reference
Radiometry
Geometry
Radiometry & Geometry
Figure 6. Visualization of the reference labeling and the results for semantic segmentation when using only radiometric features, when using only geometric features and when using both geometric and radiometric features (from left to right): the color encoding addresses the classes Impervious Surfaces (white), Building (blue), Low Vegetation (cyan), Tree (green) and Car (yellow).
Reference
NIR-R-G-DSM
NIR-R-G-nDSM-NDVI-L-P-S
Radiometry & Geometry
Figure 7. Visualization of the reference labeling and the results for semantic segmentation when using the original data (i.e. only the NIR, R, G and DSM feature maps), when using a specific subset of all defined feature maps (here the NIR, R, G, nDSM, NDVI, L, P and S feature maps) and when using all defined feature maps (from left to right): the color encoding addresses the classes Impervious Surfaces (white), Building (blue), Low Vegetation (cyan), Tree (green) and Car (yellow).
have proposed a Residual Shuffling Convolutional Neural Network (RSCNN) which combines the characteristics of a Residual Network with the advantages of atrous convolution and a shuffling operator to achieve a dense semantic labeling. Via performance evaluation on a benchmark dataset, we have analyzed the value of radiometric and geometric features when used separately and in different combinations for the semantic segmentation task. The derived results clearly reveal that true orthophotos are better suited as the basis for classification than the DSM, the nDSM and different representations of geometric information and their combination. However, the combination of both radiometric and geometric features yields an improvement of the classification results. The derived results also indicate that some features such as
the NDVI are less suitable, and that the use of many features as the basis for semantic segmentation can decrease the predictive accuracy of the network and might thus suffer from the Hughes phenomenon. We conclude that selected data representations derived via feature extraction and feature selection techniques provide a gain if used as the basis for deep semantic segmentation. ACKNOWLEDGEMENTS This work is supported by the foundation of China Scholarship Council under Grant 201704910608. The Vaihingen Dataset was provided by the German Society for Photogrammetry, Re-
This contribution has been peer-reviewed. The double-blind peer-review was conducted on the basis of the full paper. https://doi.org/10.5194/isprs-annals-IV-2-65-2018 | © Authors 2018. CC BY 4.0 License.
71
ISPRS Annals of the Photogrammetry, Remote Sensing and Spatial Information Sciences, Volume IV-2, 2018 ISPRS TC II Mid-term Symposium “Towards Photogrammetry 2020”, 4–7 June 2018, Riva del Garda, Italy
mote Sensing and Geoinformation (DGPF) (Cramer, 2010): http://www.ifp.uni-stuttgart.de/dgpf/DKEP-Allg.html. REFERENCES Audebert, N., Le Saux, B. and Lef`evre, S., 2016. Semantic segmentation of Earth observation data using multimodal and multi-scale deep networks. In: Proceedings of the 13th Asian Conference on Computer Vision (ACCV), Taipei, Taiwan, Vol. I, pp. 180–196. Audebert, N., Le Saux, B. and Lef`evre, S., 2017. Beyond RGB: very high resolution urban remote sensing with multimodal deep networks. ISPRS Journal of Photogrammetry and Remote Sensing. In Press. Badrinarayanan, V., Kendall, A. and Cipolla, R., 2017. SegNet: a deep convolutional encoder-decoder architecture for image segmentation. IEEE Transactions on Pattern Analysis and Machine Intelligence 39(12), pp. 2481–2495. Blomley, R. and Weinmann, M., 2017. Using multi-scale features for the 3D semantic labeling of airborne laser scanning data. In: ISPRS Annals of the Photogrammetry, Remote Sensing and Spatial Information Sciences, Wuhan, China, Vol. IV-2/W4, pp. 43–50. Chen, K., Fu, K., Gao, X., Yan, M., Sun, X. and Zhang, H., 2017. Building extraction from remote sensing images with deep learning in a supervised manner. In: Proceedings of the 2017 IEEE International Geoscience and Remote Sensing Symposium (IGARSS), Fort Worth, TX, USA, pp. 1672–1675. Chen, K., Fu, K., Yan, M., Gao, X., Sun, X. and Wei, X., 2018. Semantic segmentation of aerial images with shuffling convolutional neural networks. IEEE Geoscience and Remote Sensing Letters 15(2), pp. 173– 177. Chen, L. C., Papandreou, G., Kokkinos, I., Murphy, K. and Yuille, A. L., 2016. DeepLab: semantic image segmentation with deep convolutional nets, atrous convolution, and fully connected CRFs. arXiv preprint arXiv:1606.00915. Chen, T., Li, M., Li, Y., Lin, M., Wang, N., Wang, M., Xiao, T., Xu, B., Zhang, C. and Zhang, Z., 2015. MXNet: a flexible and efficient machine learning library for heterogeneous distributed systems. arXiv preprint arXiv:1512.01274. Cramer, M., 2010. The DGPF-test on digital airborne camera evaluation – Overview and test design. PFG Photogrammetrie – Fernerkundung – Geoinformation 2/2010, pp. 73–82. Demantk´e, J., Mallet, C., David, N. and Vallet, B., 2011. Dimensionality based scale selection in 3D lidar point clouds. In: The International Archives of the Photogrammetry, Remote Sensing and Spatial Information Sciences, Calgary, Canada, Vol. XXXVIII-5/W12, pp. 97–102. Gerke, M., 2014. Use of the stair vision library within the ISPRS 2D semantic labeling benchmark (Vaihingen). Technical report, ITC, University of Twente. Gerke, M. and Xiao, J., 2014. Fusion of airborne laserscanning point clouds and images for supervised and unsupervised scene classification. ISPRS Journal of Photogrammetry and Remote Sensing 87, pp. 78–92. Gevers, T. and Smeulders, A. W. M., 1999. Color based object recognition. Pattern Recognition 32(3), pp. 453–464. Gitelson, A. A. and Merzlyak, M. N., 1998. Remote sensing of chlorophyll concentration in higher plant leaves. Advances in Space Research 22(5), pp. 689–692. Guyon, I. and Elisseeff, A., 2003. An introduction to variable and feature selection. Journal of Machine Learning Research 3, pp. 1157–1182. Hackel, T., Wegner, J. D. and Schindler, K., 2016. Fast semantic segmentation of 3D point clouds with strongly varying density. In: ISPRS Annals of the Photogrammetry, Remote Sensing and Spatial Information Sciences, Prague, Czech Republic, Vol. III-3, pp. 177–184. He, K., Zhang, X., Ren, S. and Sun, J., 2015. Delving deep into rectifiers: surpassing human-level performance on ImageNet classification. In: Proceedings of the 2015 IEEE International Conference on Computer Vision (ICCV), Santiago, Chile, pp. 1026–1034. He, K., Zhang, X., Ren, S. and Sun, J., 2016a. Deep residual learning for image recognition. In: Proceedings of the 2016 IEEE Conference on Computer Vision and Pattern Recognition (CVPR), Las Vegas, NV, USA, pp. 770–778. He, K., Zhang, X., Ren, S. and Sun, J., 2016b. Identity mappings in deep residual networks. In: Proceedings of the European Conference on Computer Vision (ECCV), Amsterdam, The Netherlands, pp. 630–645.
Hughes, G. F., 1968. On the mean accuracy of statistical pattern recognizers. IEEE Transactions on Information Theory 14(1), pp. 55–63. Ioffe, S. and Szegedy, C., 2015. Batch normalization: accelerating deep network training by reducing internal covariate shift. In: Proceedings of the 32nd International Conference on Machine Learning (ICML), Lille, France, pp. 448–456. Jutzi, B. and Gross, H., 2009. Nearest neighbour classification on laser point clouds to gain object structures from buildings. In: The International Archives of the Photogrammetry, Remote Sensing and Spatial Information Sciences, Hannover, Germany, Vol. XXXVIII-1-4-7/W5. Krizhevsky, A., Sutskever, I. and Hinton, G. E., 2012. ImageNet classification with deep convolutional neural networks. In: Proceedings of the 25th International Conference on Neural Information Processing Systems (NIPS), Lake Tahoe, NV, USA, Vol. I, pp. 1097–1105. Liu, Y., Piramanayagam, S., Monteiro, S. T. and Saber, E., 2017. Dense semantic labeling of very-high-resolution aerial imagery and lidar with fully-convolutional neural networks and higher-order CRFs. In: Proceedings of the 2017 IEEE Conference on Computer Vision and Pattern Recognition Workshops (CVPRW), Honolulu, HI, USA, pp. 1561–1570. Long, J., Shelhamer, E. and Darrell, T., 2015. Fully convolutional networks for semantic segmentation. In: Proceedings of the 2015 IEEE Conference on Computer Vision and Pattern Recognition (CVPR), Boston, MA, USA, pp. 3431–3440. Marmanis, D., Schindler, K., Wegner, J. D., Galliani, S., Datcu, M. and Stilla, U., 2018. Classification with an edge: improving semantic image segmentation with boundary detection. ISPRS Journal of Photogrammetry and Remote Sensing 135, pp. 158–172. Marmanis, D., Wegner, J. D., Galliani, S., Schindler, K., Datcu, M. and Stilla, U., 2016. Semantic segmentation of aerial images with an ensemble of CNNs. In: ISPRS Annals of the Photogrammetry, Remote Sensing and Spatial Information Sciences, Prague, Czech Republic, Vol. III-3, pp. 473–480. Pauly, M., Keiser, R. and Gross, M., 2003. Multi-scale feature extraction on point-sampled surfaces. Computer Graphics Forum 22(3), pp. 81–89. Rottensteiner, F., Sohn, G., Jung, J., Gerke, M., Baillard, C., Benitez, S. and Breitkopf, U., 2012. The ISPRS benchmark on urban object classification and 3D building reconstruction. In: ISPRS Annals of the Photogrammetry, Remote Sensing and Spatial Information Sciences, Melbourne, Australia, Vol. I-3, pp. 293–298. Rouse, Jr., J. W., Haas, R. H., Schell, J. A. and Deering, D. W., 1973. Monitoring vegetation systems in the Great Plains with ERTS. In: Proceedings of the 3rd Earth Resources Technology Satellite-1 Symposium (ERTS), Washington, D.C., USA, Vol. I, pp. 309–317. Sherrah, J., 2016. Fully convolutional networks for dense semantic labelling of high-resolution aerial imagery. arXiv preprint arXiv:1606.02585. Shi, W., Caballero, J., Husz´ar, F., Totz, J., Aitken, A. P., Bishop, R., Rueckert, D. and Wang, Z., 2016. Real-time single image and video super-resolution using an efficient sub-pixel convolutional neural network. In: Proceedings of the 2016 IEEE Conference on Computer Vision and Pattern Recognition (CVPR), Las Vegas, NV, USA, pp. 1874–1883. Simonyan, K. and Zisserman, A., 2014. Very deep convolutional networks for large-scale image recognition. arXiv preprint arXiv:1409.1556. Tokarczyk, P., Wegner, J. D., Walk, S. and Schindler, K., 2015. Features, color spaces, and boosting: new insights on semantic classification of remote sensing images. IEEE Transactions on Geoscience and Remote Sensing 53(1), pp. 280–295. Volpi, M. and Tuia, D., 2017. Dense semantic labeling of subdecimeter resolution images with convolutional neural networks. IEEE Transactions on Geoscience and Remote Sensing 55(2), pp. 881–893. Weinmann, M., 2016. Reconstruction and analysis of 3D scenes – From irregularly distributed 3D points to object classes. Springer, Cham, Switzerland. Weinmann, M. and Weinmann, M., 2018. Geospatial computer vision based on multi-modal data – How valuable is shape information for the extraction of semantic information? Remote Sensing 10(2), pp. 1–20. Weinmann, M., Schmidt, A., Mallet, C., Hinz, S., Rottensteiner, F. and Jutzi, B., 2015. Contextual classification of point cloud data by exploiting individual 3D neighborhoods. In: ISPRS Annals of the Photogrammetry, Remote Sensing and Spatial Information Sciences, Munich, Germany, Vol. II-3/W4, pp. 271–278. West, K. F., Webb, B. N., Lersch, J. R., Pothier, S., Triscari, J. M. and Iverson, A. E., 2004. Context-driven automated target detection in 3-D data. Proceedings of SPIE 5426, pp. 133–143.
This contribution has been peer-reviewed. The double-blind peer-review was conducted on the basis of the full paper. https://doi.org/10.5194/isprs-annals-IV-2-65-2018 | © Authors 2018. CC BY 4.0 License.
72