Resource Usage Control In Multi-Tenant Applications Rouven Krebs
Simon Spinner
Nadia Ahmed
Samuel Kounev
SAP AG Karlsruhe Institute of Technology SAP AG Karlsruhe Institute of Technology HANA - Applied Research IPD HANA - Applied Research IPD 69190 Walldorf 76131 Karlsruhe 69190 Walldorf 76131 Karlsruhe Germany Germany Germany Germany
[email protected] [email protected] [email protected] [email protected]
Abstract—Multi-tenancy is an approach to share one application instance among multiple customers by providing each of them a dedicated view. This approach is commonly used by SaaS providers to reduce the costs for service provisioning. Tenants also expect to be isolated in terms of the performance they observe and the providers inability to offer performance guarantees is a major obstacle for potential cloud customers. To guarantee an isolated performance it is essential to control the resources used by a tenant. This is a challenge, because the layers of the execution environment, responsible for controlling resource usage (e.g., operating system), normally do not have knowledge about entities defined at the application level and thus they cannot distinguish between different tenants. Furthermore, it is hard to predict how tenant requests propagate through the multiple layers of the execution environment down to the physical resource layer. The intended abstraction of the application from the resource controlling layers does not allow to solely solving this problem in the application. In this paper, we propose an approach which applies resource demand estimation techniques in combination with a request based admission control. The resource demand estimation is used to determine resource consumption information for individual requests. The admission control mechanism uses this knowledge to delay requests originating from tenants that exceed their allocated resource share. The proposed method is validated by a widely accepted benchmark showing its applicability in a setup motivated by today’s platform environments.
I.
I NTRODUCTION
Cloud computing has attracted significant attention in industry and academia [1], [2]. It enables resource sharing among different customers and economies of scale to lower IT costs [3]. Mell [4] differentiates between three service models. Infrastructure-as-a-Service (IaaS) provides fundamental computing resources that enable users to deploy and run arbitrary software. Platform-as-a-Service (PaaS) provides a runtime environment for custom applications and Software-as-a-Service (SaaS) allows customers to use a centrally operated software accessible through a thin client interface. SaaS environments often use multi-tenant software architectures (e.g., SAP Business By Design [5], Salesforce [6]) to increase efficiency. Multi-tenancy is projected to gain in importance in the next years [7], [2]. Multi-tenancy shares an application instance between multiple tenants by providing every tenant with a dedicated share of the instance, which is isolated from other shares [8], [9]. This isolation embraces, e.g., tenant-specific customizations, tenant-specific data and tenant-specific Service
Level Agreements (SLAs). Besides security and privacy issues, performance problems are one of the major obstacles for potential Cloud consumers [10], [11], [12] and tenants of a multi-tenant SaaS application also expect a reliable performance. If the guaranteed performance is maintained for tenants working within their quotas, although other tenants exceed their quotas [13] a system is performance-isolated. In [13], performance-isolation is linked to application level SLAs like request rate for the quota and response times for the guaranteed performance. Elasticity dynamically controls the available resources for the whole application and helps to maintain the applications overall performance. However, it does not enable to control the performance of single tenants and the isolation aspect [13]. Therefore, there is a need to control the performance a tenant observes. The amount of resource available, influences the response times and throughput of applications. Thus, resource control on a tenant basis, and consequently the isolation of tenant-specific shares of a resource, is an essential step to guarantee a certain tenant-specific application performance. Given that sharing in the context of multi-tenancy is done at the application layer, resource usage control is a challenge. The entity of a tenant is unknown in the lower layers providing resource control mechanisms (e.g., operating system) and the application is intentionally abstracted from the resource control. Hence, hardware resources are not explicitly allocated to a tenant. This leads to inferior performance that is caused by disruptive tenants with high workloads. Fluctuating resource requirements of tenants due to variable load or changing request mixes and customized configuration or increasing amount of persistent data further increase the complexity. Furthermore, to efficiently utilize the available system resources, they are usually over-committed. In overcommitted scenarios unused resources from one tenant can be used by other tenants to fulfil their SLAs in case of high load. Additionally, it is challenging to measure a tenant’s resource consumption due to the inability to directly map tenant requests to processing jobs at the lower system levels where monitoring tools typically operate. To the best of our knowledge, the approach described in this paper, is the first that manages to ensure a defined resource share for individual tenants sharing one application instance. This approach could be used to maintain performance
isolation, or to provide various QoS for different tenants. To realize this approach, we evaluated relevant resource demand estimation techniques (RDE) regarding their accuracy and time they need to obtain meaningful data when analyzing a high amount of request types. The dynamic request-based admission control, introduced as part of our solution, processes the information provided by the RDE to enforce the configured resource shares. A case study based on the widely accepted TPC-W benchmark [14], which run in a PaaS motivated system configuration, was used to evaluate the whole approach. The results show that the resource demand estimates are accurate enough to achieve a good isolation of resources which results in a proper performance isolation. Furthermore, it shows how the approach utilise unused resources from a tenant with low load and a good ability to adapt to a changing system state or load behaviour. This allows providers to run overcommitted systems. This approach allows providers of Multitenant Applications (MTA) to offer SLAs of high quality and enables new business models where a tenant buys shares of a resource instead of paying for the amount of requests he sent. The mapping of an application level SLA to a certain low level resource metric is a research question in itself [15] and out of scope for this work. In summary, this paper presents three complementary contributions. First, a general approach how resources for single tenants can be controlled is presented. Second, an evaluation on the feasibility of three existing resource demand estimation techniques is done and for the most promising one we show it is applicable in the context of MTAs. Third, a request based admission control to enforce resource quotas for tenants is presented. In a case study, we show how the first contribution successfully uses the second and third to control resources on a tenants base. The reminder of the paper is structured as follows. Section 2 introduces the general approach on how to achieve resource control on per tenant basis. Section 3 discusses solutions to estimate the resource demand per request type for each tenant. Section 4 shows the request admission control mechanism used to enforce resource control and its design criterion. Further, in Section 5 we present a case study showing the benefits of the approach. Section 6 discusses related work and the last Section concludes the paper. II.
G ENERAL R ESOURCE I SOLATION A PPROACH
In this Section, we describe our approach to resource usage control in MTAs. The general idea is to quantify the resource demands of each tenant in a first step. In a second step these resource demands are used to control the resource usage of individual tenants. This is done by throttling requests of a tenant once it exceeded its predefined resource shares. Traditional monitoring tools (e.g., top) are available to continuously monitor the systems utilization in data centres. However, they are not applicable for getting tenant related information. Other approaches (e.g., ThreadMXBean) can measure resource consumption on a per-thread basis, but introduce additional overheads and are often unable to capture the complete resource consumption (e.g., if the thread forks other threads or communicates with other processes).
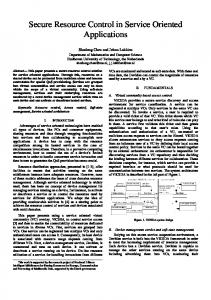
Fig. 1: General Approach
Existing methods for resource demand estimation (RDE), such as [16], [17], [18] can be used to determine the resource demands based on observation data from the running system for an application level entity. The advantage of these methods is that they do not require fine-grained instrumentation of the application and therefore, the measurement overhead is minimal. However, these methods also need to collect a meaningful amount of data before they can provide reliable estimates. If the load profile is highly variable, the controller might react too slowly, because not enough data for resource demand estimation is available. Changes to resource demands of a particular request type are relatively infrequent (e.g., configuration change) and less disruptive/abrupt (e.g., cache warm up at start or increasing database size) compared to changes in the workload. Thus our approach estimates the resource demands of particular request types and uses them as basis of the resource control instead of directly estimating the demands and resource consumptions of a tenant. Once a request is accepted by the server, it is complicated to restrict the resources it uses. However, the processing of a request flow of a tenant could be preempted by stopping or delaying the admission to the application, and consequently the resource share of a tenant is limited. Figure 1 depicts the proposed solution. The Application Server hosts the MTA serving different request types which vary in their resource demands. The Monitoring component measures the throughput Xt,c and the time Rt,c a request is being processed by the server for each tenant t ∈ T and request type c ∈ C. It is worth mentioning that Xt,c and Rt,c are measured between the application server and the admission control. The measured data is sampled and continuously forwarded to the Resource Demand Estimation component. The application server is configured to continuously forward samples of its utilization Ui of resource i to the RDE component. Using existing RDE approaches (see Section III) it estimates the demand dt,c,i per request type and tenant. The Admission Control uses the estimated resource demands to compute the consumption of a resource for each tenant based on the accepted requests within a control interval. In case the system consists of more than one application server, each one has an individual admission control and monitoring system to reflect the individual computing power. One to n RDE component might be shared among all nodes. We distinguish between three time intervals. (1) All re-
quests that are accepted by the admission control within a control interval are used to determine the tenants utilization. This needs to be done very often and it usually lies in the range of one to a few seconds. (2) The estimation interval determines how often the estimated resource demands are updated. This can be configured depending on the workload characteristics, but it is often also limited by the sampling intervals supported by the monitoring tools. (3) The observation window is a sliding window on the observed data which limits the data used for resource demand estimation and it is typically in the range of a couple of minutes to a few hours. A trade-off between the estimation accuracy and the adaptation speed for the estimation needs to be found for the observation window. This generic approach closes the gap between the various layers by (1) connecting the monitoring information from lower layers using RDE techniques to gain knowledge about the requests impact and (2) by controlling the request flow to limit the resources used by a tenant. In the present solution the current consumption is dynamically calculated at runtime based on the admitted requests within the control interval in which the guarantee should be assured. Though it can react to load changes and variable composition of request types at runtime. Due to the admission control, a smoothed load arrives at the application server and an overloaded situation for the application server can be avoided. This has a positive impact onto the quality of the RDE. Furthermore, changes in the resource demands for a particular tenant are registered and lead to a modified behaviour of the admission control. Nevertheless, a fast and accurate estimation method that can work with a low amount of data is still beneficial. In the following Sections we introduce a concrete solution for the RDE and the admission control. III.
M ULTI -T ENANT R ESOURCE D EMAND E STIMATION
A resource demand specifies the processing time for a single request at a dedicated resource. Each request belongs to a certain request type according to predefined criteria depending on the application (e.g., HTTP requests URL). In case of MTAs, each request can be associated with a certain tenant. Given that the resource demands for a request type may vary significantly between two tenants (e.g., due to different database sizes), the estimation needs to distinguish between resource demands of request types originating from different tenants. Assuming an application with a set of request types C, and serving a set of tenants T , we need to estimate |C| × |T | resource demands. Previous work, such as [17], [16], [19], only considers the estimation in scenarios with a low number of resource demands (maximum of 16 different demands in [19]). Therefore, we evaluate the behaviour of relevant existing resource demand estimation methods with a high number of request types in Section III-B. Given that the resource demands may dynamically change during system runtime, we need to re-run the estimation in regular intervals to get updated values. Therefore, a fastconverging resource demand estimation method is best suited in our scenario. In this work, we consider three methods which have been successfully used in [20], [21], [22] for the dynamic estimation of resource demands at system runtime: linear
regression, Service Demand Law (SDL) and Kalman filter. We did not consider methods based on general optimization, such as [23], [17], due to their computational complexity which limits their applicability during system runtime. A. Methods for Resource Demand Estimation In the following we discuss the three selected methods for resource demand estimation. Linear regression based approaches are used for resource demand estimation in [16], [20], [24], [25]. The linear model for the regression is based on the Utilization Law [26]:
Ui =
|C| ∑
Dc λc,i + U0
(1)
c=1
Dc is the resource demand of each request type c ∈ C and U0 represents the intercept term capturing any processing that cannot be attributed to requests. In each monitoring interval i, the aggregate CPU utilization Ui and the average arrival rates of all request types λ1 . . . λ|C| are observed. By using nonnegative least squares (NNLS) regression, we can obtain the coefficients D1 . . . D|C| representing the resource demand per request type c. The second approach is based on the Service Demand Law [26], which allows computing the resource demand Dc c from the throughput λc and the utilization Uc : Dc = U λc . The utilization Uc is the portion of the total utilization that can be attributed to the processing of requests of type c. However, monitoring tools commonly provide only the total utilization U . Therefore, a method for partitioning the total utilization between the request types is required. Assuming that the response time of a request is approximately proportional to its resource demand, the following partition scheme based on weighted response times is proposed by Brosig et al. [27]: Rc · λc Uc = U · ∑C d=1 Rd · λd
(2)
Where C is the number of request types, Rc is the response time of request type c and λc its arrival rate. A Kalman filter [28] is a stochastic filtering technique for estimating the hidden state of a dynamic system based on a series of noisy measurements. In our case, the resource demands of a system are the hidden state. The Kalman filter recursively updates its internal filter state and the resulting estimates as soon as new observations become available. Different Kalman filter designs have been proposed for resource demand estimation [18], [29], [22]. These filter designs differ in the input observations they expect for the estimation. We use the filter design used by Wang et al. [22] in a multi-tenant scenario, which is based on the Utilization Law [26]. B. Evaluation The goal of this evaluation is to assess the accuracy and the convergence behaviour of the considered methods for resource demand estimation in cases where a high number of resource demands needs to be determined. Our implementations of linear regression, Service Demand Law (SDL) and Kalman
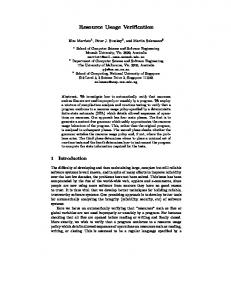
filter methods are based on the descriptions in [20], [27], [22]. We obtained the observation traces for evaluating these implementations through simulation. 1) Experiment Design: The simulator, which has been used successfully in [13], is based on a queuing network model with a closed workload and a finite population of users. It contains a queue for each tenant representing the think time of the users of this tenant. The think times are exponentially distributed with a mean value of 6 seconds. Additionally, there is one queue with a first-come, first-served scheduling strategy representing an application server. This queue contains N servers representing the number of threads that can run simultaneously in the application server. The resource demands are described by randomly generated gaussian distributions with a mean value between 10ms-120ms and up to 10% standard deviation. We simulated the experiments with 5 tenants and 5, 25 and 100 request types. In low load scenarios the competition of the tenants for the resource is low. Consequently the interference is low and there is not much need to actively control the request flow. Thus, for low load scenarios the accuracy of the estimator is less important. Additionally, RDE methods are prone to work less accurate for high utilizations. Thus, the workload was adjusted for a utilization of around 95%. For SDL, the resource demands were estimated every 30 simulated seconds using all observations from the beginning of the steady state period. In case of NNLS and Kalman filter the length of the required samples was adjusted for each experiment to find an optimal value. In addition we used different initializations of the Kalman filter. 2) Experiment Results: Figure 2 shows the total mean relative errors for 5, 25 and 100 request types with the best fitting sample lengths and initialization parameters. In Figure 2a all methods continuously increase their accuracy. NNLS becomes stable at an error twice as high as the other two methods. The behaviour for 25 types is similar (see Figure 2b). In Figure 2c an oscillation of the Kalman filter is observed before it starts to converge to a similar accuracy as the SDL. In case of 100 request types the NNLS increases its accuracy only slowly. We had significant efforts to manually find good settings for the sample length, actualization rate and initialization values for the NNLS and Kalman filter which are scenario specific. In general, the estimates are less accurate for a high amount of types and need more time to converge. It is remarkable that SDL always provides results better or as good as the Kalman filter and both outperform NNLS. Further experiments with 300 request types showed that NNLS is not able to create a valid regression within a relevant observation time. Additionally, SDL completed the actual computation in less than 0.3ms for 100 request types. As a consequence we identified SDL as the most appropriate approach. It converges fast, has low error, has the lowest complexity and has a low resource consumption. IV.
A DMISSION C ONTROL A LGORITHM
This Section presents the design criteria for a concrete admission control and the controller we developed with respect to our overall approach presented in Section II. The component aims at controlling the resource usage level for each tenant,
so that they comply with their guarantees. Its input consists of (1) the resource demand for each tenant’s request type, (2) the resource guarantee/share per tenant, and (3) incoming requests. The requests that are forwarded to the server are the output. The algorithm focuses on active time sharing resources like CPUs. A. General Requirements and Design Decisions The proposed admission control maintains one FIFO request queue for each tenant. When a thread in the application server becomes available, the admission control is triggered to return the next request to be served. The goal is to achieve a resource consumption for each tenant corresponding to the preconfigured values and an efficient resource usage. Efficiency in this context means, a resource should not idle if pending requests exist. Furthermore, unused portions of the resource from one tenant should be available for other tenants to enable over commitment. Additionally, the approach has to be of low complexity to avoid unnecessary delays in the request processing. In general, the priority on how to select requests from a set of queues could be statically or dynamically. We compute the priorities periodically every time the scheduler forwards a request. This allows to continuously adjust the prioritized queue based on the actual consumption in the control interval. In our case the priority reflects the ratio of guaranteed vs. already consumed resources for a tenant. We assume the thread pool size of the server is configured in such a way, that it achieves an optimal throughput to avoid overloaded situations. B. Scheduling Algorithm Algorithm 1 uses predefined functions. The dequeue function returns the first elements from a FIFO queue and removes it from the queue. The demand function returns the resource demand of a particular request type based on the previous estimations from the RDE. The admission control component’s inputs are the resource demand for each tenant/request type used in demand, and the resource guaranties per tenant G. A guarantee g|g ∈ G ∧ 0 < g < 1 expresses the fraction of time a tenant is allowed to use the resource under investigation. The intrinsic parameters of the admission control component used for the scheduling algorithm are the configured duration of the control interval tcontrolInterval for which the used resources have to converge to the given guarantee, and a reference to the queues Q, with pending requests for each tenant. The queues are continuously updated. The algorithm internal set P contains triples (priority, queue, tenant) used to find the next request. A lower value for the priority corresponds to a higher probability to be selected. The variable t specifies timestamps identified by the given index and ui represents the already used amount of computing time for a tenant i. In line 10 the method checks whether a new interval has begun. If this is the case, tlastInterval is reset in line 11 to have a trigger when the next interval will finish. P is reset in line 12 and initialized with priority 0 in lines 13-16. In lines 29-23, the entry p ∈ P is searched which has the lowest
NNLS Kalman
0,6 0,5 0,4 0,3 0,2 0,1
Mean Relative Error
Mean Relative Error
0,8
SDL
0,7
0,7
SDL
0,8
SDL
NNLS
0,7
NNLS
Kalman
0,6 0,5 0,4
0,3 0,2 0,1 0
0 0
60
120
180
240
300
360
420
Mean Relative Error
0,8
Kalman
0,6 0,5 0,4
0,3 0,2 0,1 0
0
60
120
180
240
300
360
420
0
60
120
(a) 5 Request Types
180
240
300
360
420
Time (s)
Time (s)
Time (s)
(b) 25 Request Types
(c) 100 Request Types
Fig. 2: Accuracy of RDE Methods in Dependency of the Measurement Time
Algorithm 1 Admission Control 1: 2: 3: 4: 5: 6: 7: 8: 9: 10: 11: 12: 13: 14: 15: 16: 17: 18: 19: 20: 21: 22: 23: 24: 25: 26: 27: 28:
INPUT: Q = {q1 , · · · , q|T | } set of FIFO request queues G = {g1 , · · · , g|T | } set of guaranteed fraction of resource tcontrolInverval GLOBAL VARIABLES: tlastInterval = 0 u1 · · · u|Q| P = {(p1 , q1 , t1 ), · · · (p|Q| , q|Q| , t|Q| )} FUNCTION: if tcurrent − tlastInterval >tcontrolInterval then tlastIntrval = tcurrent P =∅ for i = 1 to |Q| do ui = 0 P = P ∪ {(0, qi , t)} end for end if plow = (∞, null, null); for all p ∈ P do if p[1] ≤ plow [1] AND |p[2]| ̸= 0 then plow = p end if end for P = P \ {plow } rreturn = dequeue(plow [2]) uplow [3] = uplow [3] + demand(rreturn ) ui P = P ∪ {( (gp [3] ·tcontrolInterval ) , qi , p[3])} low return rreturn
value for the priority and is stored in the temporary variable plow defined in line 18. In line 24, the current selection of p is removed from the set of all P to update it later with a modified priority. Line 25 gets the next request from the selected queue which is returned later as a result of the execution of this algorithm. In line 26, the consumed resources for this period are re-computed based on the demand of the request selected. The updated utilization ut for this tenant is used to update the priority in line 27. The priority is the ratio of the already used resource in this period and the maximum guaranteed consumption. In a concrete implementation, the set P could be replaced by a priority sorted set to improve the performance. We discuss the design goals resource isolation/control and efficiency in more detail in this paragraph. The control is performed by delaying a tenant’s request processing when he already used a larger proportion of his quota compared
to other tenants with pending requests. If all tenants have always pending requests within a control interval the requests are selected with the same probability during the complete period, corresponding to the guaranteed share. If a tenant does not have pending requests at the beginning of a period other tenants are handled instead to maintain the resource utilized. However, compared to the already active tenants, a tenant that starts sending requests later is preferred due to its priority. This again ensures the isolation aspect of the approach. In cases where a tenant already exceeded its guarantee, it is still selected if no other tenant has pending requests. In case several tenants are exceeding their quota, the priority function selects the tenant that exceeds its quota the least. V.
E VALUATION
The goals for the Evaluation are as follows. (1) Evaluation of the SDL to estimate resource demands in a realistic context. (2) Evaluation of the realized resource control containing the complete feedback loop. The evaluation in both cases is done in a realistic environment. In the following, we start with the description of the system environment, followed by two separate sections discussing more detailed questions and outcomes for the evaluation goals. We focus on the control of the CPU. Driven by increasing industry requirements we assume a setup in which the MTA is hosted by a PaaS. A. Experiment Environment 1) Multi-tenancy Benchmark: To perform the evaluation in a realistic environment, the existing and widely accepted TPCW [14] benchmark was enhanced with multi-tenancy support (MT-TPC-W) in [30]. TPC-W was already used before in multi-tenant performance isolation scenarios (e.g.,[22]). MTTPC-W is an online book store emulating multiple online browsers (EB), wherein the workload is dynamically generated by accessing web pages. To support multi-tenancy, it differentiates between requests originating from different tenants by isolating their data. It generates a closed loop workload, whereby one EB behaves like a user which is characterized by a think time and a Markov Chain describing the request flow. 2) PaaS Runtime Environment: For the application server hosting the MT-TPC-W we selected the JAVA-based runtime container of the SAP Hana Cloud [31] environment which is a PaaS offered by SAP. Several PaaS environments serve a dedicated runtime container within a VM for each application to ensure proper isolation between different applications [31], [32]. However, this does not ensure isolation between tenants sharing the application within the same VM. The runtime
container differentiates tenants by the hostname they use to access the application.
browsers another 3 minutes are spent to warm up the system which shows stable results from this point. In this scenario each tenant serves 250 users in order to achieve a high CPU utilization of around 95%. 2) Results: Table I shows the resource demands per request type of tenant t1 including the 95% confidence interval. In general, the observed confidence intervals reflect a high precision. The average resource demand per request for the tenants are: t1 = 3.2ms, t2 = 3.3, t3 = 3.5, t4 = 3.5, t5 = 3.1, t6 = 3.4, t7 = 5.1, t8 = 4.6. The obtained results show considerably higher demands for tenant 7 and tenant 8 which are caused by the larger dataset.
Fig. 3: Experiment Environment 3) Environment Setup: Figure 3 depicts the test environment which consists of the 8 major components we discuss subsequently. The Load Driver creates EBs that send requests to the online store application (MT-TPC-W). It is separated from the system under test (SUT) to avoid influence. MT-TPCW is hosted on a SAP Hana Cloud runtime container which is hosted within a VM. A MySQL database is used to persist the applications data and is hosted within the same VM. The VM runs SLES11 SP2 and is hosted on the XEN hypervisor 4.1. It hosts the SAP Hana Cloud Runtime Container, the application and the database. The runtime container runs JAVA programs and executes the MT-TPC-W and the Admission Control. In the present solution the Admission Control is implemented as a valve [33] and deployed together with the application in the runtime container. It realizes the algorithm described in Section IV and monitors throughput and average response time. A CPU Monitor is installed in the hypervisor to collect the CPU utilization of the CPU pinned to the VM. These measurements are required as inputs for the resource demand estimation. The RDE System receives metering information from the CPU Monitor and the Admission Control, thus it has a physical network connection to the Server 2 and a virtual one to the VM. The two servers are equipped with 4 cores providing 16 x 2.13 GHz and 16 GB memory each, and they are connected with a 1 GBit/s Ethernet. The virtual machine in the SUT is pinned to one CPU and has 2 GB memory. The RDE runs on a standard desktop PC and was physically connected with 100 MBit/s to Server 2. B. RDE Evaluation In the following we briefly discuss our observations concerning the resource demand estimation approach presented in Section III. 1) Scenario Details: The scenario defines 8 tenants, resulting in 112 request types. The databases content is randomly generated, whereby tenant 1 to tenant 6 use an equally sized small dataset and tenant 7 and tenant 8 an equally sized dataset with 8 times more data. We collected the response time and throughput for each request type of each tenant plus the overall CPU utilization. The information was aggregated periodically and sent to the RDE every 10 seconds. The experiment ran 17 minutes. The first 3 minutes are used to ramp up the emulated
Requests type Home interaction Admin request Admin response Best sellers Buy confirm Buy request Customer registration
Demand (ms) 2.2 [2.1—2.3] 3.6 [2.5—4.6] 7.2 [5.7—8.7] 5.8 [5.5—6.0] 6.5 [6.0—7.0] 3.7 [3.5—4.0] 2.0 [1.2—2.7]
Requests type Execute New products Order display Product detail Search request Shopping cart Order inquiry
Demand (ms) 4.0 [3.9—4.1] 4.3 [4.1—4.6] 2.6 [2.3—2.8] 2.0 [1.9—2.1] 1.9 [1.8—2.0] 3.7 [3.4—4.0] 0.03[0.03—0.03]
TABLE I: MT-TPC-W Request Types and Demands The resource demand estimates are continuously updated by our solution. Thus, the values are estimated at a similar state of the system where they are used by the admission control. Therefore, samples are collected at a stable load of 95% utilization and used for a cross-validation. The set of samples is randomly partitioned into a training and validation set. The training set is used for the resource demand estimation. The remaining set is used to compare the predicted utilization with the measurement. The same process is repeated to get different training and validation sets. The observed mean error was 9%. We assume that the cross-validation at the same load fits well to our requirements, because the estimation is done online at the relevant workload. To get an error estimate for scenarios where the workload increases fast from a low to a high utilization we considered a scenarios with different utilization. We run an estimation for the requests demand at 60% utilization. The results were used for a prediction at 60% utilization which result in an error of 19% and and error of 28% for 90% utilization. According to [34] the error rates are acceptable values. Furthermore, SDL underestimated the demands for all tenants. Thus the control mechanism still maintains a similar ratio between tenants and consequently a lower error compared to the real resource share. The case study shows that the SDL approach is able to deliver good results in scenarios with high loads and a huge amount of request types. C. End-to-End Evaluation In this Section the results of the end-to-end resource control mechanism are presented. The questions we discuss are (Q1) the ability to achieve performance isolation with regards to response times and throughput by applying resource control, (Q2) the quality of the resource isolation, (Q3) the efficiency of the approach for scenarios with over-commitment, (Q4) the ability to reflect the demands of a tenant in the request processing, (Q5) the ability to provide different resource guarantees
6
4 2
100 50 Tenant 1 Tenant 2
0
1000
1500
2000
0
2500
500
1000
2000
(a) Q1: Non-Isolated System Response Time
4 2
0
10 Tenant 1 Tenant 2
150 100
50 0
0
500
1000
1000
1500
500
2500
6 4 2
1000
1500
0
500
1000
Time (s)
(d) Q1: Isolated System Response Time
2000
Tenant 1 Tenant 2
8
0 0
Time (s)
1500
(c) Q2: Non-Isolated System Resource Consumption Consumption (avg in 10s)
6
500
Time (s)
users added
Throughput (Req/10s)
users added
8
0 0
200 Tenant 1 Tenant 2
2
2500
(b) Q1: Non-Isolated System Throughput
12 10
4
Time (s)
Time (s)
Response Time (s)
1500
6
users added
500
Tenant 1 Tenant 2
8
users added
150
0
0
Consumption (avg in 10s)
8
10 users added
Tenant 2
Throughput (Req/10s)
Tenant 1
10
200
users added
Response Time (s)
12
1500
Time (s)
(e) Q1: Isolated System Throughput
(f) Q2: Isolated System Resource Consumption
Fig. 4: Isolation Capabilities of the Resource Control Mechanism
1) Scenario and Results for Q1, Q2: In order to answer Q1 and Q2 a comparison between an isolated and a nonisolated system is required. For answering Q1 a comparison is performed based on the observed response time and throughput behavior of each tenant. For answering Q2 a comparison is performed based on the resource consumption of each tenant. The first experiment uses a standard FIFO access mechanism without admission control. In the beginning of the experiment each tenant has 1000 users. After a warm-up phase 1000 additional users are added to tenant 1 to increase the load. In the second experiment the proposed admission control mechanism is implemented and each tenant is allowed to allocate 50% of the resource. The reference workload is composed of 1250 users for each tenant, and the disruptive workload has 1000 users more for tenant 1. a) Results Q1: At the beginning of the non-isolated case (see Figure 4a) the response time for both tenants is the same since both tenants have 1000 users. After adding 1000 users at 1600s the load for tenant 1 increased. Although tenant 2 still works with the same load as previously its response time increases in the same way as for tenant 1 because the FIFO queue cannot distinguish between different tenants. Figure 4b shows the complementary throughputs and how they decrease for tenant 2 in response to the disruptive behavior of the other tenant. In general, a slightly increasing response time and decreasing throughput for both tenants is visible. This can be explained with an increasing database volume during the experiment run. The isolated scenario (see Figure 4d and 4e) starts for both
The mechanism provides stable response times for the tenant with stable load while another increases its load. Thus it enforces performance isolation. b) Results Q2: When tenant 1 increases its load in a FIFO scheduled system, its resource consumption also increases (see Figure 4c). This has a negative impact tenant 2 since the consumption of it decreases. In contrast, the consumption of tenant 1 maintains the guaranteed level in the isolated case (see Figure 4f) and the consumption of tenant 2 is not influenced. In conclusion, the method is able to ensure resource isolation between individual tenants. 2) Scenario and Results for Q3: To answer Q3, the guaranteed resources are uniformly distributed between both tenants. At the beginning of the experiment each tenant has 1500 users, and after 500 seconds 1000 users are removed from tenant 1. Therefore, the request rate of tenant 1 is too low to allocate all its guaranteed resources. As a consequence, the second tenant should be able to use these resources in addition to its own share. In the first 210 seconds shown in Figure 5, the ramp up time of the measurement is visible. Until 500 seconds 200 Tenant 1 Tenant 2
150 100 users removed
In the context of the evaluation the response time refers to timespan observed by the end users between sending a request and receiving a response. The control interval was configured to 1s, the estimation interval is set to 15s, the observation window to 300s and the monitoring information sample length is set to 10s.
tenants with response times at the same level. After adding 1000 users to tenant 1 at 900 seconds, the response time of tenant 1 shows a strong increase. Despite, the increasing database size the response time of the abiding tenant maintains a significantly lower value.
Throughput (Req/10s)
to individual tenants, and (Q6) the ability of the mechanism to adapt to changing resource demands. To answer these questions we defined 5 scenarios described in the following.
50 0 0
100
200
300
400
500
600
700
Time (s)
Fig. 5: Q3: Efficiency of the System
800
both tenants have 1500 users and the same response time. At 500 seconds the workload of tenant 1 is decreased. As a consequence, the amount of available resources increases and tenant 1 takes advantage of them. Although the resource guarantees are assigned equally to both tenants, tenant 1 consumes more resources in this case. Both tenants observed a reduced response time. Thus, the proposed mechanism ensures an efficient resource usage and allows over-commitment. 3) Scenario and Results for Q4: In order to answer Q4, tenant 1 is configured to access a small database, and tenant 7 by accessing a larger database. This results in different resource demands (cf. Section V-B2). This way, we can evaluate if the first tenant is negatively influenced by the tenant with higher demands, although the share of the resource is the same. Both tenants run 1250 users. Figure 6a shows that tenant 1 with low demand request has a better response time than the tenant with high load requests. In case of a non-isolated system the throughput would be the same for both and thus the ratio of the share would be 0.39 for tenant 1 and 0.61 for tenant 7 which is an error of 22% (cf. Section V-B2). In the given experiment the throughput ratio was 0.58 for tenant 1 and 0.42 for tenant 7 (see Figure 6b) which results (cf. Section V-B2) in a resource share of approximately 0.48 and 0.52 which is an error of 4%. This shows the ability of the method to treat tenants with different demands in a differentiated manner, and proves the ability of the mechanism to use the estimated demands. 4) Scenario and Results for Q5: Answering Q5, different resource shares are allocated to the tenants. Tenant 1 has 25% of the resource and tenant 2 has 75%. The number of users for both tenants is 1250. The tenant with 75% of the resources has better response times (see Figure 6c) and a higher throughput (see Figure 6d). Thus, the proposed resource controller is able to differentiate QoS by providing different shares to each tenant. 5) Scenario and Results for Q6: To identify the systems ability to adapt to changing resource demands we set up two tenants using the system at high utilization. After 1450 seconds the resource demands for each request type of tenant 1 were increased to a higher value, by adding artificially computational overhead, simulating a change in the tenant-specific configuration. In a second experiment, we ran the system at a utilization of around 30% and increased the load of one tenant to achieve a utilization close to 100% after 3 minutes to examine the impact of the estimation error found in V-B2 in a scenario with changing loads. Figure 6f depicts the error of the resource demand estimated in percent. At 1450 seconds the demand is 20% underestimated and due to the sliding window approach it needs some minutes to converge again to a good estimation. In total, it took around 8 minutes before the estimated demands become stable again due to the adaptation process which includes the admission, that itself changes the load behaviour. A smaller observation window can speedup the adaptation at the cost of the prediction accuracy. Figure 6e depicts the difference of the resource consumption between the two tenants in percent. Once the demand increased the difference raises up to 50% before the estimation and system becomes stable at around
2100 seconds. The experiment was repeated several times with similar results. The seconds experiment presented a very good resource isolation similar to Figure 4f with a negligible error. This proves that the RDE error in various load scenarios has only a small impact on the isolation and control mechanism. 6) Scalability: We ran experiments with up to 8 tenants. In an exemplary manner, we describe the results from an experiment based on the scenario used to answer Q4 and Q5. In this scenario, tenants t5 and t6 have a larger dataset compared to the other tenants. The CPU shares of the tenants 9 2 ;t7..t8= 30 ). We observed that with a are set to (t1..t6= 30 higher number of tenants, a longer control interval and a larger observation window are beneficial. Therefore, we set the control interval to 3 seconds and the observation window to 7 minutes. The observed response times show that the system is capable to isolate the resource usage between the tenants and to provide different QoS levels for different tenants (t1 = 5.0s; t2 = 4.3s; t3 = 4.2s; t4 = 5.0s; t5 = 7.1s; t6 = 7.5s; t7 = 0.8s; t8 = 0.5s). Additionally, we observed that the request response time without artificial delays was increased by less than 5%. VI.
R ELATED W ORK
We primarily focus on work concerning performance isolation and resource control. Additionally, a brief overview of relevant work in the field of RDE is given. A. Isolation and Resource Control Fehling et al. [35] analysed challenges arising from multitenant scenarios and provided a method to place tenants onto locations with different QoS in a way resources are used optimal without SLA violations. However, this approach doesn’t cover isolation aspects nor uses knowledge of online estimated resource demands. Abdelzaher et al. [36] present an example of work where different requests/connections are given different priorities on TCP level. Their approach focus on differentiating QoS without knowledge or particular resource demands. In our previous work [13], different static admission control strategies like Round Robin were realized. However, in this work no knowledge of resources or other feedback was available. In several situations the solutions could not provide proper isolation or efficiency. In [37], the authors propose a feedback-control-based performance regulation for MTAs to control QoS for different tenants. The focus is to guarantee different quality of services to different tenants. They indirectly provide measures for performance isolation. However, in situations with high load it would fail to guarantee isolation because the mechanism does not provide isolated queues. Therefore, requests are rejected although the response times would still be sufficient. Gupta et al. [38] is one representative of authors developing mechanisms to performance isolate VMs. In their particular case, they determine the CPU overhead for I/O of a XEN Domain in Dom0 and leverage this within the CPU scheduler to achieve lower interference of VMs. However, all the approaches isolating virtual machines can directly measure the resource consumptions and have direct access to the hardware and schedulers. The work of [39] aims to maximize the overall resource utilization of a resource pool (set of computing nodes) with respect of guaranteed SLAs for different tenants. The aim is to place a set of sequentially
10 5 Tenant 1
Tenant 7
0 200
400
600
800
12
120
10
Tenant 1
100 80 60 40 Tenant 1
20
Tenant 7
0 200
400
Time (s)
2
1000
0
200
400
50
Tenant 1 Tenant 2
0 800
1000
50 40 30 20 10 0 -10 1100
1600
Time (s)
2100
800
1000
(c) Q5: Different Resource Guarantees Response Time
2600
30
20 10 0
-10 -20 -30 1100
1600
Time (s)
(d) Q5: Different Resource Guarantees Throughput
600
Time (s)
RDE Error Tenant 2 (%)
100
600
800
demand change
Diff. Consumption (%)
Throughput (Req/10s)
60
150
400
600
(b) Q4: Tenant Differentiation Throughput
200
200
4
Time (s)
(a) Q4: Tenant Differentiation Response Time
0
6
0 0
1000
Tenant 2
8
demand change
0
140
Response Time (s)
15
Throughput (Req/10s)
Response Time (s)
20
2100
2600
Time (s)
(e) Q6: Resource Consumption while Demands Change
(f) Q6: Resource Demand Estimation Error
Fig. 6: Evaluation Results of the Resource Control Mechanism
on-boarding tenants to a set of available resources without violating the SLAs. It is assumed, that, while a certain response time is guaranteed, the consumption of a particular resource, is linear on the number of the tenant’s active users. However, tenants allocating the same node still influence each other and variable demands are not covered. In [22], a Kalman filter is used to estimate the CPU consumption of tenants sending different request types. The isolation strategy checks if the current CPU utilization exceeds a predefined CPU threshold. If this is the case it identifies the tenant and request type that causes the largest CPU utilization. As a consequence, the allowed request rate for this transaction type of the disruptive tenant is decreased by rejecting requests. Their approach assumes that the same request type sent by different tenants have the same demand. Furthermore, the demand estimation is only used to identify malicious workload but not to define individual shares. Incoming malicious request types are rejected. Our approach supports various resource demands, it enables resource shares and still handles requests with some delay instead of rejecting them.
B. Resource Demand Estimation Previous evaluations of methods for resource demand estimation are limited to a low number of request types. To the best of our knowledge, there is no previous work considering 20 and more request types. There are case studies with linear regression [25], [40], or Kalman filters [22] using the TPC-W application benchmark, which has 14 different request types. However, the number of request types is not varied in these case studies. Kraft et al. [17] evaluate the influence of the number of request types (between one and five) on different linear regression and maximum-likelihood resource demand estimation methods. In [16], Rolia et al. describe experiments using linear regression and varying the number of request types between three and ten. In [19], several methods for resource demand estimation are evaluated for up to 16 workload types.
VII.
C ONCLUSION
This paper describes an approach that supports Multi-tenant Applications to guarantee a performance for each tenant. Resource control is required to manage performance. The layers with direct access to resources (e.g., operating system) have no knowledge of the application-level entity of a tenant. Consequently it is one of the major challenges to overcome the applications decoupling from the hardware. The presented approach is based on resources demand estimation methods to quantify the resource consumption of a tenant at runtime. This allows to control the amount of requests admitted to the application for each tenant to ensure a certain share of the resource. Three different promising resource demand estimation methods based on Kalman filter, linear regression and the Service Demand Law (SDL) were evaluated. The best approach for our scenario, based on the SDL, was combined with a request admission control. The chosen approach can be used for high utilized scenarios, with a huge amount of request types. The request admission control dynamically computes a tenant’s priority. While the consumed resources of a tenant converge to a predefined share, the tenant’s priority is reduced compared to the others. Thus, other tenants will be preferred and the resources used by a tenant are isolated. The evaluation based based on TPC-W showed the ability of the mechanism to isolate the CPU time for each tenant. In addition, overcommitted systems and differentiation of the QoS different tenants experience can be handled. The contribution was threefold. (1) We presented a general approach how resource isolation could be achieved on the application level. (2) We analysed three resource demand estimations methods with regards to the expected applications realizing 1. (3) A concrete admission control to enforce resource isolation based on the evaluation in 2. These contributions allow providing better SLAs guarantees in the area of SaaS, realized by multi-tenant applications. Our future work will focus on the combination of several resources of different type, and distributed systems where
several computing nodes host the Multi-tenant Application. Furthermore, we plan to contribute in the field of resource demand estimation methods. ACKNOWLEDGMENT Research leading to these results has received funding from the European Union Seventh Framework Programme (FP7/20072013) under grant no 317704 (CloudScale). R EFERENCES [1] [2] [3]
[4]
[5] [6]
[7] [8]
[9]
[10]
[11] [12]
[13]
[14] [15]
[16] [17]
[18]
[19]
bitcurrent, “Bitcurrent cloud computing survey 2011,” bitcurrent, Tech. Rep., 2011. D. Smith, “Hype cycle for cloud computing, 2011,” Gartner, Tech. Rep., July 2011, iD Number: G00214915. Optimal Multivariate Control for Differentiated Services on a Shared Hosting Platform. 46th IEEE Conference on Decision and Control, 2007. P. Mell and T. Grance, The NIST Definition of Cloud Computing, National Institute of Standards and Technology Std. Special Publication 800-145, 2011. SAP, “SAP business bydesign? innovations and key capabilities,” SAP AG, Walldorf, Tech. Rep., 2012. C. D. Weissman and S. Bobrowski, “The design of the force.com multitenant internet application development platform,” in Proceedings of the 35th SIGMOD International Conference on Management of Data. New York, NY, USA: ACM, 2009, pp. 889–896. Y. Natis, “Gartner reference model for elasticity and multitenancy,” Gartner, Gartner Report, June 2012. H. Koziolek, “The SPOSAD architectural style for multi-tenant software applications,” in Workshop on Architecting Cloud Computing Applications and Systems (procedings of WICSA’11). IEEE, 2011. R. Krebs, C. Momm, and S. Kounev, “Architectural Concerns in MultiTenant SaaS Applications,” in Proceedings of the 2nd International Conference on Cloud Computing and Services Science (CLOSER 2012). SciTePress, April 2012. E. Packman, P. Taylor, L. Rachitsky, S. Rejali, S. Power, I. Rae, and D. Koffler, “Bitcurrent: Cloud comuting performance,” bitcurrent, bitcurrent, Tech. Rep., June 2010. IBM, “Dispelling the vapor around cloud computing,” IBM, New Orchard Road Armonk, NY 10504 U.S.A., Tech. Rep., 2010. M. Armbrust, A. Fox, R. Griffith, A. D. Joseph, R. Katz, A. Konwinski, G. Lee, D. id Patterson, A. Rabkin, I. Stoica, , and M. Zaharia, “A view of cloud computing,” Communications of the ACM, vol. 53, no. 4, pp. 50–58, 2010. R. Krebs, C. Momm, and S. Kounev, “Metrics and Techniques for Quantifying Performance Isolation in Cloud Environments,” Elsevier Science of Computer Programming Journal (SciCo), 2013. TPC BENCHMARK W, Transaction Processing Performance Council Std., 2002, transaction Processing Performance Council. V. C. Emeakaroha, I. Brandic, M. Maurer, and S. Dustdar, “Low level Metrics to High level SLAs - LoM2HiS framework: Bridging the gap between monitored metrics and SLA parameters in cloud environments,” in High Performance Computing and Simulation (HPCS) 2010, 2010. J. Rolia and V. Vetland, Parameter estimation for performance models of distributed application systems. IBM Press, 1995, p. 54. S. Kraft, S. Pacheco-Sanchez, G. Casale, and S. Dawson, Estimating service resource consumption from response time measurements. ICST Institute for Computer Sciences, Social-Informatics and Telecommunications Engineering, 2009. T. Zheng, C. M. Woodside, and M. Litoiu, “Performance model estimation and tracking using optimal filters,” Software Engineering, IEEE Transactions on, vol. 34, no. 3, p. 391?406, 2008. S. Spinner, “Evaluating Approaches to Resource Demand estimation,” Master’s thesis, Karlsruhe Institute of Technology (KIT), Am Fasanengarten 5, 76131 Karlsruhe, Germany, July 2011.
[20] G. Pacifici, W. Segmuller, M. Spreitzer, and A. Tantawi, “Cpu demand for web serving: Measurement analysis and dynamic estimation,” Performance Evaluation, vol. 65, no. 6-7, p. 531?553, 2008. [21] F. Brosig, N. Huber, and S. Kounev, “Automated Extraction of Architecture-Level Performance Models of Distributed ComponentBased Systems,” in 26th IEEE/ACM International Conference On Automated Software Engineering (ASE 2011), 2011. [22] W. Wang, X. Huang, X. Qin, W. Zhang, J. Wei, and H. Zhong, “Application-Level CPU Consumption Estimation: Towards Performance Isolation of Multi-tenancy Web Applications,” 2012 IEEE Fifth International Conference on Cloud Computing, pp. 439–446, 2012. [23] Z. Liu, L. Wynter, C. H. Xia, and F. Zhang, “Parameter inference of queueing models for it systems using end-to-end measurements,” Performance Evaluation, vol. 63, no. 1, p. 36?60, 2006. [24] G. Casale, P. Cremonesi, and R. Turrin, “Robust Workload Estimation in Queueing Network Performance Models,” 16th Euromicro Conference on Parallel, Distributed and Network-Based Processing (PDP 2008), pp. 183–187, Feb. 2008. [25] Q. Zhang, L. Cherkasova, and E. Smirni, A Regression-Based Analytic Model for Dynamic Resource Provisioning of Multi-Tier Applications. IEEE Computer Society, 2007, p. 27ff. [26] R. Jain, The Art of Computer Systems Performance Analysis: techniques for experimental design, measurement, simulation, and modeling. Wiley, 1991. [27] F. Brosig, S. Kounev, and K. Krogmann, Automated extraction of palladio component models from running enterprise Java applications. ICST (Institute for Computer Sciences, Social-Informatics and Telecommunications Engineering), 2009. [28] R. E. Kalman, “A new approach to linear filtering and prediction problems,” Transactions of the ASME-Journal of Basic Engineering, vol. 82, no. Series D, pp. 35–45, 1960. [29] D. Kumar, A. Tantawi, and L. Zhang, “Real-Time Performance Modeling for Adaptive Software Systems,” Proceedings of the 4th International ICST Conference on Performance Evaluation Methodologies and Tools, 2009. [30] R. Krebs, A. Wert, and S. Kounev, “Multi-Tenancy Performance Benchmark for Web Application Platforms,” in Proceedings of the 13th International Conference on Web Engineering (ICWE 2013), Aalborg University, Denmark. Springer-Verlag, July 2013. [31] SAP, “SAP HANA Cloud Platform,” https://account.hanatrial.ondemand.com/, [accessed 31-Oct-2013]. [32] Amazon, “AWS Elastic Beanstalk,” http://aws.amazon.com/elasticbeanstalk/, [accessed 31-Oct-2013]. [33] Apache, “Apache Tomcat Configuration Reference - The Valve Component,” http://tomcat.apache.org/tomcat-5.5-doc/config/valve.html, [accessed 31-Oct-2013]. [34] D. A. Menasc´e and V. A. F. Almeida, Scaling for E-Business: Technologies, Models, Performance, and Capacity Planning, 2000. [35] C. Fehling, F. Leymann, and R. Mietzner, “A framework for optimized distribution of tenants in cloud applications,” in CLOUD 2010 IEEE 3rd International Conference on Cloud Computing, 2010, pp. 252 –259. [36] T. Abdelzaher, J. Stankovic, C. Lu, R. Zhang, and Y. Lu, “Feedback performance control in software services,” Control Systems, IEEE, vol. 23, no. 3, pp. 74–90, 2003. [37] H. Lin, K. Sun, S. Zhao, and Y. Han, “Feedback-Control-Based Performance Regulation for Multi-Tenant Applications,” in Proceedings of the 15th International Conference on Parallel and Distributed Systems, ser. ICPADS ’09. IEEE Computer Society, 2009, pp. 134–141. [38] D. Gupta, L. Cherkasova, R. Gardner, and A. Vahdat, “Enforcing performance isolation across virtual machines in Xen,” in Proceedings of the ACM/IFIP/USENIX 2006 International Conference on Middleware, ser. Middleware ’06. Springer-Verlag New York, Inc., 2006, pp. 342–362. [39] Y. Zhang, Z. Wang, B. Gao, C. Guo, W. Sun, and X. Li, “An effective heuristic for on-line tenant placement problem in SaaS,” Web Services, IEEE International Conference on, vol. 0, pp. 425–432, 2010. [40] J. Rolia, A. Kalbasi, D. Krishnamurthy, and S. Dawson, Resource demand modeling for multi-tier services. ACM, 2010.