period, residual feed weighted and FI were calculated for per family in all of the period and family FCR were ... and Washburn, 1974; Pym and Nicholls, 1979).
Response To Selection For Feed Conversion Ratio and Correlated Genetic Response In Body Weight In Japanese Quail SH. Varkooh*, M. Moradi Shahrbabak*, A. Pakde*, A. Nejati Javaremi*, M. Zaghar* and A. Kause†
Introduction Feed conversion is an important and economic trait and a complex, highly aggregate trait that is the net result of the interaction of many different component traits for example behavior, carcass composition, digestibility, appetite, growth curve, livability, level of production and additional component traits. Selection for feed conversion influences these component traits in a relatively undirected manner (Emmerson et al., 1997). The relationship between feed efficiency and live weight gain is of both biological and economic significance, since until recently genetic improvement in food utilization efficiency in commercial broiler chickens has been achieved almost entirely as a response to the shorter growth period achieved through selection for increased growth rate (Crawford et al., 1990). Direct versus indirect selection for FCR of growth after selection for live body weight (LWT), a sequential scheme often applied in broilers, was considered (Koerhuis et al., 1995). There aren’t enough papers about FCR in quail. In the current study, we investigated firstly: realized genetic response in FCR, secondly: correlated genetic response in BW and WG in Japanese quail.
Material and methods Population structure and animal management. In the current study, the base population of Japanese quail (Coturnix Coturnix Japonica) was maintained at the animal research station of Tehran University, in 2009. 210 birds were randomly selected from the base population and divided equally into two lines. One line selected for 4-week FCR (F) and another line was control (C). Quails were breeded for 4 generation and there were 2 hatches in per generation. Each of these generations maintained with 70 families in each of lines (one male and two females). Two females were placed at two-floor cages and one male alternatively was mating with them every two days. The birds in the F line were leg-banded with a numbered plastic (70 female and 35 male). Eggs were collected daily and labeled by dam number. Eggs were put in setter after 7 days for 14 days, and then eggs of each dam transferred to cells in Hatcher tray separately and were put in Hatcher for 3 days. When the
*
Department of Animal Science, Faculty of Agriculture, Tehran University, Karaj, Iran Department of Animal Breeding and Genomics Center, Wageningen University, Netherland
†
chickens hatched, were leg-banded and the chickens of each family in the F line placed into separated cages and the chickens in the C line were randomly placed in other cages. In the F line, chickens of each family were weighted at 1 and 28 d of age and family WG were recorded in all of the period. Feed weighted for per family separately and at the end of period, residual feed weighted and FI were calculated for per family in all of the period and family FCR were calculated. In the C line, chickens weighted together in 1 and 28 d of age and WG were recorded together in all of the period. Feed weighted for all of the group and residual feed weighted and FI were calculated in all of the period for C line and then FCR were calculated for all of the group. To generate selection line, birds selected based on low FCR and birds in C line selected randomly (70 female and 35 male for each line). Selected birds transferred to the special cage laying egg. At the first, second, Third and fourth generation, F and C lines maintained under 26, 26, 27, 28 percent CP diet, respectively and 2900 kcal/kg ME from 1 to 28 days of age. Food and water were available ad libitum. Statistical methods. Calculation of means was done by SAS software 9.2 following used below generalized linear model: Yijklm = µ + Li + H j + G k + G k * H j + G k * Li + H j * Li + fSex l + eijklm
Where: Y ijklm = observed trait; µ
= overall mean; Li = fixed effect of ith line; H j = fixed
effect of jth hatch; G k = fixed effect of kth generation; G k × H j = interaction of G k and H j ; G k × Li = interaction of
G k and Li ; H j × Li = interaction of H j and Li ; fSex l = continue
covariate of average family sex ratio ; e ijklm = random error.
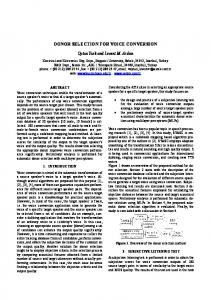
Results and discussion Selection response and realized heritability for FCR are presented in Table 1. Results showed that genetic improvement was 0.16, 0.17 and 0.03 for generation 2, 3 and 4 respectively. Response to selection and realized heritability for FCR in 4 generation were 0.36 and 0.46 respectively. Realized estimates for the heritability of time-constant measures of feed efficiency have generally been in ranging from 0.18 to 0.56 with a mean of about 0.25 (Gill and Washburn, 1974; Pym and Nicholls, 1979). In this study improvement in FCR has been shown after 4 generation selection (Figure 1-b). Means of family FCR for F line and C line in first generation were 2.68 and 2.64 and in last generation were 2.13 and 2.61 respectively (18.4% improvement; 4.6% in per generation). For FCR at different recording treatment-by-generation interaction was significant (Table, 2). Both genetic and environmental factors exert major influences on FCR and growth parameters in poultry. Although the appropriate genetic back ground is critical, diet is perhaps the major environmental factor that determines whether birds grow at their maximum genetic potential. Improvement in FCR is due to population genetic structure, the kind of diet and environmental conditions.
The results show that selection for FCR is effective on BW and WG. With decrease of FCR, BW and Wg increase. Means of BW28 for F line and C line in last generation were 193.2 and 166 respectively (16.4% improvement; 4.1% in per generation) and Means of Wg for F line and C line in last generation were 184.2 and 157.9 respectively (17.2% improvement; 4.3% in per generation). For BW28 and Wg1-28 d at different recording treatment-bygeneration interaction was significant (Table, 2). Marks (1980) reported that selection for increased 4-wk BW in selected line has resulted in the improvement of feed efficiency in this line. Buyse (1999) stated selection for low FCR result of indirect selection for leanness. It seems to improve FCR in relation selection for BW is due to increase maturity body weight and so lower fat desposition. Table1: Selection response and realized heritability for FCR
Generation 1 2 3 4
Population mean S C 2.68 2.64 2.46 2.58 2.24 2.53 2.13 2.61
Selected mean S 2.37 2.24 1.99 -
Selection differential S 0.31 0.22 0.25 0 ∑ .78
Response S 0.22 0.22 0.11
C 0.06 0.05 0.08
Corrected response S 0.16 0.17 0.03 ∑ 0.36
Realized heritability=0.36/0.78= 0.46
Table 2. Least square means and standard error for Weight Gain in F and C lines Variation Source Mean Hatch 1 2 Generation 1 2 3 4 1
FBW28 1
FTWG
2
FTFCR
3
F 182.4±0.65
C 166.2±0.71
F 173.8±0.64
C 158.1±0.71
F 2.38±0.01
C 2.59±0.01
181.3±0.94 183.6±0.90
164.8±0.99 167.6±0.95
172.7±0.92 174.9±0.88
156.7±0.98 159.5±0.95
2.40±0.02 2.35±0.02
2.60±0.03 2.57±0.08
167.4±1.2 178.1±1.27 190.8±1.43 193.2±1.32
165.3±1.5 164.9±1.38 168.6±1.59 166±1.41
159.3±1.17 169.7±1.24 181.9±1.39 184.2±1.29
157.3±1.28 156.8±1.41 160.5±1.45 157.9±1.46
2.68±0.03 2.46±0.03 2.24±0.03 2.13±0.03
2.64±0.04 2.58±0.04 2.53±0.04 2.61±0.04
Family body weight 28 day of age; conversion ratio in 28 days of age
2
Family total weight gain between 1-28 days of age;
3
Familiy total feed
a)F=22.5;P=0.009; R-square=96.7%;
b) F=28.4; P=0.006;R-Square=96.2%
Feed Conversion Ratio
Body weight28 (g)
200 190 180 170 160 1
2
3
Generation
4
2.8 2.6 2.4 2.2 2 1
2
3
Generation
4 F line C line
Figure 1: The trend of changes in WG and FCR between 1-28 days of age Conclusion These results clearly show that FCR improves after 4 generation selection and selection for FCR is effective on BW. With decreasing in FCR in per generation, BW28 increases. Much of the historical improvement in the feed conversion can be attributed to increases in growth potential and the association between body weight and feed conversion continues to complicate selection for improved efficiency industrial breeding programs References Buyes, J., Leenstra, F. R., and Decuypere, E. (1999). Poult. Avi. Biolog. Revi. 10:121-142. Crawford, R. D. (1990). Develop. Anim. Veter. Sci., 22: 847- 876. Emmerson, D. A. (1997). J. Poult. Sci. 76: 1121-1125. Gill, R. A., and Washburn. K. W. 1974. J. Poult. Sci. 53: 1146- 1154. Koerhuis, A. N. M., and Hill, W. G. (1995). Br. Poult. Sci. 37: 317-327. Marks, H. L. (1980). J. Poult. Sci. 59: 6-10. Pym, R. A. E. and Nicholls, P. J .1979. Br. Poult .Sci. 20: 73-86.