RHA: A Robust Hybrid Architecture for Information Processing in Wireless Sensor Networks Thanh Dang #
#1
, Nirupama Bulusu #2 , Wu-chi Feng #3 , Wen Hu ∗4
Department of Computer Science, Portland State University 1,2,3
dangtx, nbulusu,
[email protected] ∗
CSIRO ICT Centre, Australia 4
[email protected]
Abstract—The paradox of wireless sensor networks (WSNs) is that the low-power, miniaturized sensors that can be deeply embedded in the physical world, are too resource-constrained to capture high frequency phenomena. In this paper, we propose RHA, a robust hybrid architecture for information processing to extend sensing capacity while conserving energy, storage and bandwidth. We evaluate RHA with two real world applications, bio-acoustic monitoring and spatial monitoring. RHA provides accurate signal reconstruction with significant down sampling compared to traditional multi-rate sampling, is robust to noise, enables fast triggering and load balancing across sensors.
I. I NTRODUCTION In the past decade, low-power sensor networks have been deployed to monitor buildings, bridges, and vineyards. Current WSNs can not adequately capture high frequency signals (eg. acoustic) or large-scale spatial phenomena with high fidelity (eg. city wide temperature). It is challenging to capture high frequency signals with low-power sensors or motes, because classically sensors need to sample at twice the signal frequency to accurately reconstruct a signal. Resource-limited sensors can neither store nor transmit large data volumes. Prior work has explored leveraging heterogeneous hardware platforms [1], [2]. Tenet [2] argues that WSNs should be asymmetrical in their task allocation, but do not consider how to minimize samples taken by motes. Lance [3] reduces transmissions by data prioritization, but does not reduce the sampled data. We propose RHA, a Robust Hybrid Architecture for WSNs. RHA reduces the samples taken, stored and transmitted by sensors. The key idea in RHA is concurrent random sampling based on compressive sensing theory, allowing most natural signals to be reconstructed from a few measurements. RHA is robust, adaptive, and simple. The paper’s contributions are: A. A hybrid information processing architecture including: (i) A concurrent random sampling scheme (CRS) for WSNs that applies compressive sensing to extend the network sensing capability. Unlike previous compressive sensing methods, CRS does not require specialized hardware or cross-sensor collaboration. (ii) An adaptive compressive sampling algorithm (ACS) that is simple to compute and addresses a key practical problem in compressive sensing, that of dynamically determining the minimum required samples without prior signal knowledge.
(iii) A hierarchical feature analysis scheme leveraging the information in the samples and the devices’ computational capabilities, to make decisions based on available features. (iv) A hierarchical decision making scheme based on CRS to adjust the sensor sampling state (active, inactive) or rate adaptively, reducing data transmitted. B. Evaluation on two canonical case studies: (i) Bio-acoustic monitoring: Cane-toad vocalizations can be reconstructed using 10% of the measurements compared to classical sampling. RHA can detect cane toads with high accuracy even with unreconstructed signals. (ii) Spatial monitoring: Even with only 10% of sensors reporting, RHA can reconstruct a spatial field with low error.
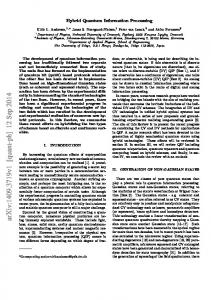
Fig. 1.
RHA Architecture
II. RHA The information processing architecture has three tiers mapping to the three hardware tiers, illustrated in Figure I. Tier 1: Low power sensors (e.g. MicaZ, Telos [4]). Tier 2: Micro-servers to bridge the WSNs with the Internet. Tier 3: Servers for complex operations and data archival.
A. Concurrent random sampling (CRS) CRS (Section III) allows each mote to independently and randomly sample a signal at a low rate while still preserving signal information. However, there is a restriction on signal representation. CRS can be applied at tier 1 at a low sampling rate and at tier 2 at a high sampling rate. Let x(t) be the continuous analog signal being sampled from the physical world. With CRS, motes randomly sample this signal to rs produce a discrete-time digital signal xrs l [n] or xh [n]. The subscripts l and h indicate a low sampling rate at the motes and a higher sampling rate at the micro-servers respectively. The superscript rs indicates random sampling.
Complex Feature Analysis (CFA) at tier 2: Micro-servers can sample a signal at a higher rate than sensors. Using their greater computation power, they can extract simple features (e.g. histogram) accurately, implement signal transforms and perform complex classification using machine learning. CFA rs rs analyzes the input xrs h [n] and produces f (xh [n]). f (xh [n]) can be the estimated histogram, envelope, frequency representation of the signal, or the detection and classification results. Micro-servers can also reconstruct the signal from random samples. For a high frequency signal (e.g. 20 kHz), the reconstruction is best done at a high end server. D. Decision Making
B. Adaptive Compressive Sampling (ACS) ACS (Section IV) allows each mote to calculate while sampling data, the measurement normalized norm residual, mnnr. We have studied mnnr empirically and found that if mnnr < 0.001, the signal is reconstructed exactly with a high probability. Based on mnnr, sensors can determine how many measurements are enough for reconstruction and avoid redundant measurements. C. Feature analysis From the random samples obtained with CRS, the sensors can perform simple analysis. Simple Feature Analysis (SFA) at tier 1: The sensors can calculate simple features, such as the histogram and the signal envelope. SFA analyzes the input xrs l [n] and produces the feature f (xrs l [n]), which can be the estimated histogram or the envelope of x(t). Although the random samples are collected at a low rate, these features are still representative of the original signal and useful for simple decisions. Besides max, min and average, the simple features discussed below can be computed efficiently while sampling. Histogram: The random samples of a signal estimate its histogram well. Machine learning techniques often use the histogram as a feature to classify signals. The algorithm to estimate the histogram is very simple. Let (Smin , Smax ) be the range of the sample values xrs l (n) and k be the number of bins of the histogram y. Each sample value is checked to determine the bin it lies in and the corresponding counter is increased by 1 as follows. Let w = (Smax − Smin )/k, if Smin + (i − 1) × w ≤ xrs l (n) < Smin + i × w, i = 1...k, then y(i) = y(i) + 1. Signal Envelope: The signal envelope is generally estimated by applying a low-pass filter or smoothing the signal. A simple computation windows the signal, taking the maximum sample value in each non-overlapping window by subdividing the recorded samples (x(n), 0 ≤ n ≤ N − 1) into K nonoverlapping smaller segments by xi (n) = x(iD + n)w(n) 0 ≤ n ≤ L − 1, 0 ≤ i ≤ K − 1, where w(n) is basically a rectangular window of duration L, and D is an offset distance. The envelope is estimated as: K−1 xi (n). y(i) = maxi=0
Decisions about event occurrences are made at different tiers depending on the available signal features. 1) Low Level Decision at tier 1: : Each sensor makes its own decision independently, or by exchanging features with its neighbors. The decision can be thought of as a function dt of the extracted features f . We use the subscript t to indicate that it is from tier 1 and it is responsible for triggering the microservers. The decisions dt (f ) can be detection, classification or measurement adjustment. The detection at this tier can have a high false positive rate but should have a low false negative rate. The idea is that the mote should not miss an event, i.e., it is alright to detect a false event and trigger the micro-server in tier 2 to verify the decision. Detection Sensors can make decisions based on simple features such as maximum or average readings. If there is a bird call, the maximum reading should be high. Classification Using features such as histograms and signal envelopes, sensors can classify events (e.g. what bird types are present). Applications may tolerate high false positives (but not false negatives) that lead motes to needlessly trigger microservers. For simplicity, and to minimize energy usage, each sensor should make decisions independently. Adjusting number of measurements To capture the original signal using random sampling, the sensor can adjust the sampling rate based on the calculated mnnr, as will be discussed in Section IV-C. 2) High Level Decision at tier 2: Micro-servers make decisions using as input, tier 1 decisions dt (f ), features extracted from random samples they have acquired f (rhrs [n]), and information from other micro-servers. We represent this decision as ds (f ) with the same notation as in a low level decision except that the subscript s indicates that it is a sampling decision, whether or not to start random sampling at micro-servers. From the motes’ decisions, they can (i) perform voting to ensure consistency across decisions, (ii) decide to sample the signal using their own sensors and adapt the sampling rate for events, (iii) decide whether they should use uniform Nyquist rate sampling with simpler reconstruction instead of random sampling. From raw data from motes and their conditions, microservers can (i) decide how to optimize data collection, considering data utility (eg. important features), and resource
usage, (ii) decide how to forward the samples to high end servers for further analysis and storage. E. Signal Reconstruction, Analysis and Archival With CRS, the signal reconstruction requires a different approach from uniform sampling. In brief, the reconstruction requires solving an optimization problem to find the best matched signal x[n] that produces the random samples xrs h [n]. Currently, this optimization is computationally expensive and can be solved effectively only at a high end server. The signal can be reconstructed using one of several optimization techniques, known to be robust to noise [5]. Scientists are often interested in replaying certain signal segments, comparing current and past events. The reconstructed signal is a discretetime digital signal x[n], that can be analyzed with standard signal processing techniques and stored for further use. III. C ONCURRENT R ANDOM S AMPLING A. Compressive Sensing Overview Our approach builds on compressive sensing, itself based on an underlying sampling theory to enable signal reconstruction from a few measurements [6]. Consider a signal f represented in the standard basis as a vector of length n, where f ∈ Rn . f can also be represented in another bases such as Fast Fourier Transform (FFT) using a coefficient vector fˆ ∈ Rn . The basis function can be characterized by an invertible matrix Ψ ∈ Rn×n and the relation between f and fˆ can be stated as: f = Ψfˆ and fˆ = Ψ−1 f The key idea is that if a signal f is sparse, i.e. it can be expressed in some domain as fˆ in a few linear combinations of basis functions (non-zero coefficients in fˆ), then we can reconstruct the signal from a few measurements obtained from either: random projection and random sampling. Random projection: Let f be the original signal represented Notation T Ω f g(t) gˆ fˆ gˆ(ω) M m N s
Meaning Support set, indicating which A Set of all frequencies in f Original signal of length n An estimate of f in time domain Fourier representation of g and f Fourier coefficient of g at frequency ω down sampling factor total number of measurements number of sensors jitter scaling factor TABLE I
Notation used in the paper.
as a vector of length n. The m random measurements can be obtained as a vector h ∈ Rm by projecting f to a projection matrix P of m by n random entries, i.e., h = P f . Projection can be obtained by special hardware [7]. Or by sampling the signal first to compute a projection. Random sampling: Random sampling takes m random entries in f as a vector of random measurements h ∈ Rm .
It does not explicitly do a random projection on the signal. It is used in [8]. We apply random sampling to WSNs, an aspect that hasn’t received much prior attention. We restate Theorem 3.1[9] that presents compressive sensing for time and frequency domains. Theorem 3.1: [9] Suppose that f ∈ Rn and is supported on a set |T |. If we sample at m randomly selected frequency locations ω1 , ..., ωm , m ≥ C × |T | × log n, where C is a constant.PSolving the optimization problem n−1 ming t=0 |g(t)| such that gˆ(ω) = fˆ(ω) for all ω ∈ Ω will give f exactly with overwhelming probability. This theorem states that if we have a sparse signal in the time domain such as a spike train, we do not need to sample it at the Nyquist rate. Instead, we need to collect only a few random samples in the frequency domain. This number is proportional to k log(n) where n is the signal length and k, the number of non zero coefficients in the time domain. In the past, to capture spike train signals, we needed to sample at a very high frequency and collect a large number of samples in the time domain. This theorem tells us that a few samples in the frequency domain are enough to reconstruct the signal. Although there may be measurement noise in an application, another theoretical result states that the reconstruction error is bounded and proportional to the noise level in most cases [9]. In general, the theory is applicable for any two incoherent domains, i.e., one domain’s basis can not be sparsely represented in the other domain, and for compressible and noisy signals. We also apply this theory to the spatial domain. 1) Sampling a High-Frequency Phenomena: Sensors randomly sample a source and transmit data back to a sink. Based on compressive sensing theory, we can reconstruct the signal using these samples. The sampling time sequence is determined by the following equation: sampleT ime = M × randsample(n/M, m/N ) + s × round(randn(m/N, 1)), where n is the signal length, M is the down sampling factor, m is the total number of measurements, N is the number of sensors, and s is the scaling factor that controls how large the jitter (discussed shortly) is. M controls the minimum time interval between each sample. Function randsample(a, b) picks b arbitrary numbers with an independent and identical distribution (i.i.d) from 1 to a. Function randn(a, b) generates an a × b matrix with random entries, chosen from a normal distribution with zero mean and variance one. We use N sensors to collect m random samples totally, so each sensor must collect m/N random samples. It is possible that a sensor must collect two random samples that are extremely close in time (near Nyquist rate). We overcome this requirement by generating a random sequence in a short time period τ and dilating it to the full time scale Γ. We select m/N sample times randomly from the time scale τ , [1, n/M ] and dilate the sample time to the time scale Γ, [1, n] by multiplying the sampling time by M . The sampling times are now at least M time units apart, ensuring that we sample
IV. A DAPTIVE C OMPRESSIVE S AMPLING In Theorem 3.1, if the total number of measurements m > C × |T | × log n, we can reconstruct the signal exactly. Empirically from [9], if m > 4|T | we can reconstruct the signal exactly. |T | can be obtained from prior signal knowledge (e.g. Magnetic Resonance Imaging (MRI) images are known to be sparse in the wavelet domain). In practice, prior signal knowledge is unavailable, necessitating capture of the whole signal to analyze its sparsity. For example, when collecting acoustic signals in a forest, animal calls may be superimposed. Even if we understand the acoustic signatures of individual species, their combination is complex. Resource-limited sensors can not sample at the Nyquist-rate or reconstruct the signal. Therefore, determining the minimum required measurements dynamically from the compressive measurements is challenging in practice. A. Measurement Normalized Norm Residual (MNNR) We observe that the measurement normalized norm residual - mnnr is a good indicator of successful reconstruction rate. mnnr =
rs ||xrs [1..m+1]||2 2 − ||x [1..m]|| m+1 n ||xrs [1..m + 1]||2
(1)
1 This assumption is reasonable because we can have several sensors stacked together as an array to record a signal. We believe that even with minor variations in signal attenuation from a source to sensors, this algorithm may still work because only the signal energy changes, the signal sparsity or frequencies do not change. A complete analysis of the impact of varying signal attenuation is beyond the scope of this paper.
p where ||x[1..m]||2 = x[1]2 + x[2]2 + ... + x[m]2 is the norm 2 of vector ||x|| and xrs is the random sample. There is a strong relation between the mnnr and the successful reconstruction rate. As we increase the number of rs 2 measurements, the normalized norm ||x [1..m]|| will decrease m and reach the signal normalized norm when n approaches the Nyquist-rate (see Figure 2). The normalized norm stabilizes as m increases and the reconstruction error approaches zero. Hence, the normalized norm residual may be used to indicate successful reconstruction rate. The normalized norm residual is again divided by the measurement norm ||xrs [1..m]||2 to make it unit-less and applicable to all signals. Figure 3(a) shows that 8 measurement norms 6
norm 2
at a rate M times lower than the Nyquist rate. To increase the sampling time randomness, we introduce the time jitter, which has a normal distribution at the sampling time. We generate jitter using s × round(randn(m/N, 1)). RandSam assumes that the WSN is dense and the signal attenuation from the source to all adjacent sensors is the same. 1 Noise sources include analog to digital conversion noise and inaccurate sampling time. However, they can be considered as one and the Dantzig selector can reconstruct the signal with bounded error. 2) Sampling a Spatially Correlated Phenomena: Consider a phenomenon (e.g. monitoring building temperature) where sensor readings are spatially correlated, implying that the data is sparse in some domain (e.g. frequency domain). RandSense algorithm works as follows. Within each sampling period, a sensor generates a random number from 1 to n. If the number < k log(n), the sensor takes a measurement and transmits it to the sink. Otherwise, it does nothing. The k log(n) threshold ensures that statistically we have enough measurements to reconstruct the phenomena. The network collects only the minimum required measurements. In each period, only a random subset of sensors, acting independently, take and transmit measurements. Compressive sensing is very robust to noise in individual sensor measurements, sensor failures, or packet loss; losing some measurements does not adversely affect the phenomenon reconstruction.
(measurement norm)/m (signal norm)/n (signal norm)/m
4
2
0 0
100 200 number of measurements
300
Fig. 2. Measurement norm and signal norms versus number of measurements. Signal length = 1024 and 50 random non-zero coefficients. Measurement norm ||x|| ||x|| is bounded between N 2 and m 2
when mnnr < 0.001, the signal is reconstructed exactly with high probability. B. Calculating MNNR We propose a simple, iterative algorithm to compute mnnr during sampling. It requires only 3 variables and 3 steps. nrm ← x[1] m←1 mnnr ← 0 while T RU E do m←m+1 x[m] ← next √ sample nrm2 +x[m]2
− nrm
m mnnr ← √m+1 2 2 p nrm +x[m] nrm ← nrm2 + x[m]2 if mnnr ≤ 0.001 then break end if end while
C. Adaptive Sampling Based on mnnr, sensors can dynamically update the minimum required random measurements. They can start with a low sampling rate and increase it as needed. Once mmnr < 0.001, the sensor should fix the number of measurements collected in a period. However, it should vary the sampling rate slightly to detect any signal changes (eg. new bird calls). Depending on the application, we can tailor the threshold to increase the probability of exact reconstruction. V. C ASE S TUDIES We evaluate RHA for two applications: cane toad monitoring and spatial monitoring of light intensity.
A. Cane-toad Monitoring The main goal of this experiment is to investigate 1) how well CRS can capture a high frequency signal and 2) how the reconstruction error affects the classification results. 1) Experimental Setup: We use a laptop microphone to randomly sample frog calls and reconstruct the signal using the Dantzig selector, available in l1magic [10]. We use the reconstructed frog vocalizations to classify the frog species. 2) Results: Figure 3(b) shows that the mean squared error (MSE) of the reconstructed signals using CRS is approximately 50 % lower than those using multi-rate sub sampling at the same rate. In multi-rate sub sampling, we assume the sensors are perfectly synchronized in time, which is not always feasible. Hence, CRS has the potential to further outperform multi-rate sub sampling. Table II shows the detection rates for the signal collected using CRS with a different number of sensors sampling at 1 Khz. The frog classification accuracy appears to peak with more than 2 sensors. The maximum number of detections (18), matching the performance sampling at 10 kHz, is achieved when 4 sensors are sampling simultaneously. Number of Sensors Original Signal (10 Khz) 1 2 3 4 5
Number of Detections (Cane toad) 18 10 15 15 18 15
TABLE II
Classification performance using signal collected using CRS. Different number of sensors sample at 1 Khz.
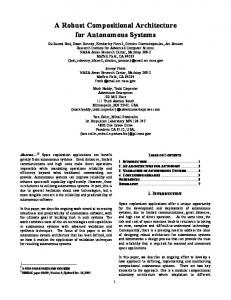
Figure 3(c) shows the detection latency distribution at motes at Tier 1 with a simple matching algorithm [11] using signal envelopes in Section II-C. 80% of the time, Tier 1 sensors can detect a cane toad within one second. The stargates in Tier 2 can be triggered within one second of detection of a cane toad. A cane toad often sings for about 30 seconds. Hence, the stargates can capture major part of the cane toad song at a higher frequency for classification. Figure 4(a) compares the performance of Tier 1 and Tier 2. Both tiers return a similar true positive rate ( correct toad classification ) but Tier 1 returns a higher false positive rate and about an 18% false negative rate. This is a tradeoff with using motes for detection. B. Sampling a Spatial Phenomenon Our second case study considers a spatial light field. We choose light because it is easy to manipulate light sources for controlled experimentation. The main goal of this experiment is to investigate: 1) how RHA performance varies with the number of sensors reporting data, 2) whether RHA is robust to packet losses and node failures. Since it is difficult to know the ground truth, we simulate it based on collected sensor data. We deployed a network of
20 MicaZ sensors, collecting light measurements over a time period. We then created a light intensity map by interpolating the sensor data and consider it as the ground truth for the next two experiments. 1) Experiment Setup: Each sensor has its own random seed. Data sampling and transmission is controlled by the RandSense algorithm. A threshold value controls how many sensors report data within a sampling period. We simulate a dense WSN with 75,000 sensors, corresponding to a 250x300 pixel image of the light map. We vary the threshold such that the percentage of sensors reporting data varies from 2.5%, 5%, 10%, 20% to 33% of the total sensors. We used standard reconstruction techniques discussed in [10]. 2) Results: Figure 4(b) shows that the normalized mean squared error (NMSE) of the reconstructed light map degrades slowly when the percentage of measurements is between 10% and 20%. This mean that RandSense is very robust to failures such as node failures or link failures. To understand the network load distribution, we observe the number of transmitted messages per sensor for 2000 epochs. Only 10% of random sensors sense and report data within each epoch. Figure 4(c) shows the distribution of transmitted messages per sensor node. It is concentrated at 2000 messages and the standard deviation is only 40 messages. This means all sensors expend similar amounts of energy, i.e., the network is load balanced and can have a longer lifetime. VI. R ELATED W ORK In-network data processing approaches collect raw data, but compress, aggregate or prioritize the data transmitted to the sink. Distributed Wavelet Transform[12] addresses data compression rather than information processing, with the goal of minimizing communication costs. Junction Tree[13] ensures robust packet delivery for distributed inference, but does not use hybrid hardware. [14], a compressive sensing based approach, simultaneously computes random projections of the sensor data and disseminates them using gossiping. The goal is to reduce communication of Nyquist rate sampled data, as opposed to facilitating subNyquist rate signal sampling for low-power devices. [15] proposes a distributed compressed sensing approach, wherein each sensor independently collects random Gaussian measurements. This work relies on a random projection of the signal source, which can be generated by specialized hardware. Our approach is implementable on existing hardware (eg. motes). Our work is closely related to [16], a hardware platform that enables random sampling of a signal source. [8] also considers sampling a signal at a sub Nyquist rate but non-uniformly in time. Both works focus either on extending the analog-to-digital conversion or enabling direct analog-to-information conversion. Unlike our work, these techniques are not intended for a distributed environment. VII. C ONCLUSION We have proposed RHA, a robust hybrid sensor information processing architecture to extend the network-wide sensing
Mean Square Error of CRS versus Multi−rate Subsampling 0.025 CRS Multi−rate subsampling
reconstruction error versus MNNR
Detection latency distribution (s) 0.8
0.02
40 20
0.6
frequency
60
Mean Square Error
reconstruction error
80
0.015
0.01
0.2
0.005
0 0 0.005 0.01 0.015 0.02 measurement normalized norm residual
0.4
0 1
2
(a)
3 4 Number of Sensors
5
0 0
5
(b)
10 latency (ms)
15
(c)
Fig. 3. a) Reconstruction error vs. MNNR. Signal length = 1024 and 50 random non-zero coefficients. When mnnr < 0.001, the reconstruction error is nearly 0. b) Mean squared error vs. number of sensors for the reconstructed cane toad signals using CRS and multi-rate sub sampling. c) Detection latency distribution at tier 1. c) lassification performance for Tier 1 and Tier 2 sensors. Performance at different tiers
Reconstruction error versus number of measurements
60 50 40 30 20 10 true positive
false positive false negative classification criteria
percentage of network (%)
percentage (%)
70
0
Distribution of transmitted messages per node 0.12
25 tier 1 tier 2
80
normalized mean squared error (%)
90
20
15
10
5 0
0.05 0.1 0.15 0.2 0.25 0.3 0.35 number of measurements / total number of sensors
(a)
(b)
0.1 0.08 0.06 0.04 0.02 0 0
500 1000 1500 2000 2500 number of transmitted messages
(c)
a) Classification performance for Tier 1 and Tier 2 sensors. b) Reconstruction error vs. number of measurements. c) Distribution of transmitted messages.
Fig. 4.
capacity and evaluated it on two canonical applications, bioacoustic monitoring and and spatial monitoring. Its key features include: (i) concurrent random sampling, enabling high frequency signal capture and reconstruction with a down sampling factor of nearly 10; (ii) hierarchical feature analysis, enabling bioacoustic detection with less than 1 second latency even with a down sampling factor of 100; (iii) hierarchical decision making to significantly reduce false positives by triggering higher capability sensors for verification; and (iv) efficient load balancing across sensors with minimal crosscoordination. To the best of our knowledge, this is the first hybrid architecture based on compressive sensing for WSNs. R EFERENCES [1] T. He, J. A. Stankovic, R. Stoleru, Y. Gu, and Y. Wu, “Essentia: Architecting Wireless Sensor Networks Asymmetrically,” in Proceedings of INFOCOM ’08, Phoenix, AZ, April 2008. [2] O. Gnawali, K.-Y. Jang, J. Paek, M. Vieira, R. Govindan, B. Greenstein, A. Joki, D. Estrin, and E. Kohler, “The tenet architecture for tiered sensor networks,” in Proceedings of the 4th international conference on Embedded networked sensor systems (SenSys ’06). New York, NY, USA: ACM, 2006, pp. 153–166. [3] G. Werner-Allen, S. Dawson-Haggerty, and M. Welsh, “Lance: Optimizing high-resolution signal collection in wireless sensor networks,” in Proceedings of SenSys’08, Raleigh, NC, November 2008. [4] Crossbow, Wireless Crossbow Technology. http://www.xbow.com/Home/wHomePage.aspx, May 2008. [5] D. Needell and J. A. Tropp, “Cosamp: Iterative signal recovery from incomplete and inaccurate samples,” Applied and Computational Harmonic Analysis, vol. 26, no. 3, pp. 301–321, November 2008. [6] R. Baraniuk, “A lecture on compressive sensing,” IEEE Signal Processing Magazine, July 2007. [Online]. Available: http://www.dsp.ece. rice.edu/cs/compressiveSensing-IEEE-SPMag-LectureNotes-15web.pdf
[7] M. Wakin, J. Laska, M. Duarte, D. Baron, S. Sarvotham, D. Takhar, K. Kelly, , and R. Baraniuk, “An architecture for compressive imaging,” in Proceedings of ICIP 2006, Atlanta, Georgia,USA, October 8–11 2006, pp. 1273–1276. [Online]. Available: http: //portal.acm.org/citation.cfm?id=1182807.1182834 [8] E. Candes, “Topics and applications of compressive sampling,” in Short course in compressive sampling and frontiers in signal processing, Minneapolis, Minnesota, USA, June 4-15 2007, pp. 21–22. [9] E. Candes and T. Tao, “Stable signal recovery from incomplete and inaccurate measurements,” Communications On Pure and Applied Mathematics, vol. 59, pp. 1207–1223, 2006. [10] E. Candes and J. Romberg, “1-magic : Recovery of sparse signals via convex programming,” in http://www.acm.caltech.edu/l1magic/, October 2005. [11] T. Dang, N. Bulusu, and W. Hu, “Lightweight acoustic classification for cane-toad monitoring,” in Proceedings of the Asilomar Conference on Signals, Systems and Computers, 2008. [12] R. S. Wagner, R. G. Baraniuk, S. Du, D. B. Johnson, and A. Cohen, “An architecture for distributed wavelet analysis and processing in sensor networks,” in Proceedings of IPSN ’06. New York, NY, USA: ACM, 2006, pp. 243–250. [13] C. Guestrin, P. Bodik, R. Thibaux, M. Paskin, and S. Madden, “Distributed regression: an efficient framework for modeling sensor network data,” in Proceedings of IPSN ’04. New York, NY, USA: ACM, 2004, pp. 1–10. [14] M. Rabbat, J. Haupt, A. Singh, and R. D. Nowak, “Decentralized compression and predistribution via randomized gossiping,” in Proceedings of the Fifth International Conference on Information Processing in Sensor Networks (IPSN 2006), Nashville, Tennessee,USA, April 19-21 2006, pp. 51–59. [15] M. F. Duarte, M. B. Wakin, D. Baron, and R. G. Baraniuk, “Universal distributed sensing via random projections,” in Proceedings of IPSN 2006, Nashville, Tennessee,USA, April 19-21 2006, pp. 177–185. [16] J. Ragheb, S. Kirolos, J. Laska, A. Gilbert, M. Strauss, R. Baraniuk, and Y. Massoud, “Implementation models for analog-to-information conversion via random sampling,” in Proceedings of MWSCAS 07, Montreal, Canada, August 5-8 2007, pp. 119–122.