Robust Model Based Methods for Speech Enhancement Gary A. Einicke' and Langford B. White2
* CSIRO - Exploration and Mining, PO Box 883, Kenmore QLD 4069, AUSTRALIA
DSTO - CommunicationsDivision, PO Box 1500, Salisbury SA 5108, AUSTRALIA g.einicke @dem.csiro.au
[email protected]
ABSTRACT The paper compares the performance of Kalman filter and hidden Markov model approaches for the recovery of speech from FM signals within impulsive noise environments. Two applications of speech recovery are investigated, namely within demodulation and post demodulation. Simulation studies are presented which illustrate the best case and worst case performance trends. 1. INTRODUCTION
Frequency modulation (FM)is widely employed in personal communicationssystems. Our objective is to compare two model based methods for the enhancing the demodulated audio outputs of FM receivers in impulsive noise environments. Opportunities for improvement exist either within the demodulation process or post demodulation.
OZ = -n1
(xk+i
-
and p =
k =1
1c
XkXk+l
rE=l
jc
x~
k l
1
respec-
tively. These MLEs and the filtkred stateccan de calculated iterativelyin an Expectation Maximisation (EM) algorithm [2]. In a HMM approach, the speech amplitude range is discretised into N disjoint subintervals centred around points qi, i = 0, ...,N. The model (1) allows the determinationof the transition probabilities Aij = P d x k + i = qj I x k = qi} and the calculation used is Aij =
exp { - OS(%
- pqi)20;2 } (3)
exp { - OS(%
- pqi)20;2]
i=o
As described by Moore and Krishnamurthy [3], let
The contribution of this paper is the description of Kalman filters and hidden Markov model (HMM) applicationsthat provide some robustness in the presence of impulsive noise, The results of simulation studiesare presented, which illustratethe best case and worst case performance, of Kalman filter and HMM techniques, for baseband filtering and demodulation applications.
=Xk
+vk,
(11, (2)
where 0 < p < 1, Uk and v k are zero-mean, white, gaussian processes of variance 0: and d respectively. The application of the Kalman filter [11 for the system (l), (2) requires estimates of p, 02 and 0:. Suppose a Kalman filter has produced the state estimatesx k . It follows from the model (1) that xk+% - N ( x k , 0;). It is straightforward to show that the maximum likelihood estin
C (Zk - Xk)2 ,
1 mates (MLES)of CY:, o? and p are d = ;
k =1
w&A(i)qi.
2.2. Impulsive Measurement Noise
Noisy speech measurements may be modelled as a first order system, W
N- 1
&= i=o
2.1. Gaussian Measurement Noise
= p Xk + Uk.
lag. These quantitiesmay be calculatedusing standard recursions (see [3]) which make use of the conditional likelihoods b;(zk) = exp {- O S ( a - qi)20;2}. The conditional mean estimate is then calculated as
2. BASEBAND SPEECH
Xk+l
ak(i)= Pdzo ,..., Zk,Zk = si), ykji) = P d X k = qi Iz o , ...,z k }, and Pg+A(i) = pr(Vc+i ,...,zk+A I z k = q; }, where A > o is a smoothing
Estimation methods for impulsive noise environments fall into two categories: those which are robust or less sensitive to the impulses [4]and those which explicitly model the impulses [5]. Some robustness to impulsive noise can be obtained via the use of a nonlinearity to censure the prediction error in an adaptive filter. The use of a piecewise nonlinearity is described in [4], where a "filtered error", a "median absolute deviation" and a "blanking rate" are used to scale the nonlinearityin order to obtain acceptable performance. Instead of censuring the error, a sequence indicating the amplitudes and locations of impulses may be estimated. A block-adaptive method for the calculation of a MLE of such an indicator sequence is detailed in [5]. Error censuring may be applied in a Kalman filter viz.
1997 IEEE TENCON - Speech and Image Technologies for Computing and Telecommunications
471
hi= P%LI + KkQ(Ek),
(4)
where K k is the Kalman gain and Ek = zk - %L-l is the prediction error. The Q is anonlinearity such that Q(&k) + &k as &k -+ 0 and Q ( & k ) + 0 as c k -+ -. During the presence of large impulses, there is less reliance on the corrytion KkQ(&k) component and more reliance on the prediction p ~ component + ~ in (4).Altematively the measurement data may be described by
where p k is an unknown deterministic sequence. Consider the following on-line estimate for the indicator sequence: i k = &k - Q(&k).
(6)
When the measurement a n i hence the residuals are low powered gaussian sequences, then p k = 0. Conversely, the occurence of large impulses in the measurement, which propagate through to the residuals, will be indicated by a noyero pk. In p w of (5) and (6), a prediction error estimate is &k = a - x k - p~k= Q(&k). Thus the two approaches (4) and ( 5 )- (6) are the same. The robust Kalman filter (4) may also be used to remove large impulses from the measurement data. Consider the sequence
.& = zkQ(Ek)/Ek + x k ( 1 - Q(Ek)/Ek).
(7)
This is a mixture of the measurement data and filtered estimates, according to whether large impulses are either absent or present iespectively. It also can be advantageous to use the mixture data Zk to evaluate the conditional likelihoods bi(Zk) in a subsequent HMM. The piecewise nonlinearity described in [4]consists of a straight line near the origin and gaussian tails descending to zero elsewhere. One smooth function may be used instead, such as
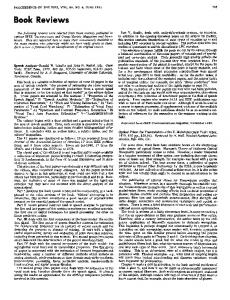
tributed interarrival times and gaussian distributed amplitudes using the approach of [6] in which h = 0.01, Td = 0.1 and impulsive to gaussian white noise power ratios (INR) of f 10 dB. Simulations were conducted in which gaussian white noise and impulsive noise were added to the speech data. Let the "nominal noise variance" refer to the sum of the gaussian white noise variance and the impulsive noise variance. The signal to noise ratio (SNR), defined as the ratio of the variance of the speech signal to the nominal noise variance, was varied in 3 dB steps. The measurement noise variance estimate was initialised with the nominal value and re-estimated via the MLE of Section 2.1 and the conventional Kalman filter within an EM algorithm. The robust Kalman filter (4)with m = 5 in (9) was subsequently employed to re-estimate the measurement noise variance after error censuring. The mean square error (MSE) of various estimates at INR = - 10dB and 10 dB are shown in Fig. I(a) and l(b) respectively. The measurement datazk, the Kalman filter estimate and the robust Kalman filter estimate are indicated by dashed, dot-dashed and dash-crossed lines respectively. The top, middle and bottom solid lines indicate the conventional HMM estimates using a smoothing lag of 2, employing 16,32 and 64 input levels respectively. The top, middle and bottom dotted lines indicate robust HMM estimates using a lag of 2, the mixture data (7), employing 16,32 and 64 input levels respectively. Figure 1(a) demonstrates that the Kalman filter and HMM exhibit best case performance when the gaussian measurement noise assumption is in fact correct. Conversely when the problem is dominated by impulsive noise, it can be seen from Fig. l(b), that the robust methods can provide performance benefits. At 0 db SNR, the robust Kalman filter reduces the MSE by about 5 dB over the Kalman filter; the use of the mixture data (7) and a 64 input level HMM offers a further reduction of about I&. Fig. 1 illustrates that the number of input quantisation levels in HMMs becomes increasingly important at higher SNRs. For example in the region of 3 dB to 9 dB SNR,it is evident that the signal fidelity decreases with a reduced number of input levels. 3. FMSIGNALS
where a > 0 is a scaling constant which needs to be chosen to obtain acceptable performance. An approach that has been found to be satisfactory involves setting the stationary point of Q equal to m times the asymptotic prediction error standard deviation where m is a positive real. That is,
a =m E , where SZ, = p-
+ c$,
3.1. Gaussian Measurement Noise FM signals can be modelled via the cumulative sum of the speech message
(9)
and the complex measurements in which
pw=0.5((ou-(12 p 2 ) o ~ ) + . \ 1 ( ( 1 - p 2 ) ~ - ~ ) * + 4 0 ~(lo) o~).
is the solution to the algebraic Ricatti equation corresponding to
wherea is the signal amplitude. A FM discriminator, which only makes use of the measurements (12-13), is given by
(1) and (2).
23. Example
The phrase "Matlab is number one" was spoken by a male and recorded at an 8 kHz sampling rate. At low measurement noise, an EM algorithm yielded p = 0.77 and = 0.005. Impulses were generated having an exponential impulse response, Poisson dis-
472
a'.
where the sequence&' is the differential of the sequence An EKF demodulator can be constructed by a straightforward application of the standard recursions [l]to the model (I), (1 1) - (13). In a HMM approach, the interval {0,2n} is discretised into n
1997 IEEE TENCON - Speech and Image Technologies for Computing and Telecommunications
disjoint subintervalscenteredaroundpointsqi, i = 0, ..., n-1. The discretised phase is thus modelled as a first order Markov process on the unit circle. The quantities ~ ( i P) k,( i ) andyk(i)of [3]require conditional likelihoods which are calculated as
LJLUV
3.2. Impulsive Measurement Noise The Kalman filter is the best filter among the set of all filters when the signal model is known, the second order noise statistics are known and the noise processes are gaussian [l]. For nonlinear problems, the EKFis an optimal solutionprovided that these same assumptions are valid. However in the case of FM speech signals, the speech model and noise statistics are unknown, and, in urban environments the measurements are typically contaminated with impulsive noise. Even when the measurement noise is gaussian, EKF demodulators are prone to fault behaviour at low SNRs [7].
When impulsive noise is negligible, it can be seen from Fig. 2(a) that the combination of discriminator followed by a Kalman filter is far superior to a discriminator on its own. Under best case conditions,when the noise is gaussian,evidently it is better to use a speech model within demodulationrather than post demodulation. At 3 dB SNR, it can be seen that the HMM is the most beneficial, providing greater than 5 dB of benefit compared to the discriminator-filter combination. However when impulsive noise dominates the problem, it is seen from Fig. 2(b) that filteringthe discriminatoroutput provides good performance. The impulsive noise causes the EKF demodulator to lose phase lock, resulting in large frequency tracking errors. Although the use of error censuring within a robust EKF significantly reduced the occurence of phase lock problems, the MSE performance remained poor. Post-discriminatorfilteringis a good solution here because the joint problems of phase recovery and filtering are decoupled. Clearly a HMM demodulator having 64 input quantisation levels is the best of the demodulation approaches compared here.
4. CONCLUSIONS The method of Section 2.2 can also be employed within a so-called robust EKF. That is, the asymptotic error covariance can be precalculated, which similarly requires estimates of the measurement noise variances. The approximate MLE for the noise variance is
A two step procedure is once again advocated for the impulsive noise case. An initial estimate can be obtained within an EM algorithm making use of (16) and an EKF basedon (l), (11)- (13). A revised estimate can then be obtained via subsequent iterations with a robust EKF.
33. Example The instantaneous phase of an FM signal is the integral of the underlying frequency message. The cummulative sum (11) approximates the integral of the speech message when the sample rate is sufficientlyhigh. Clearly it is prudent to perform the phase reconstruction at the highest practicable sample rate. The spoken phrase “Matlab is number one“ was recorded at 96 kHz sample rate and a unity amplitude FM signal was synthesized via (1 1) (13). Complex impulsive noise was generated, again using the approach of [6], in which Td = 0.1 and h = 0.01. Simulations were conducted in which the demodulations were carried out at 48 kHz sampling rate. Since the quality of the baseband speech estimate is of interest, the MSE was calculated after decimation to 8 kHz. The performance of various approaches are shown in Fig. 2. The MSE exhibited by the FM discriminator (14) is indicated by a dotted line. The dot-dashed line indicates the performance of a Kalman filter in which & = 0.005 and p = 0.99; the & was determined via an EM algorithm at each SNR. The EKF and robust EKF are indicated by dashed and solid lines respectively. The performance of a 64 input level HMM is indicated by the cross-dotted line.
In respect of enhancing noisy baseband speech, if the measurement noise is gaussian then a Kalman filter is a good choice. While a HMM can provide a reduced MSE, the benefit is small and an insufficient number of input quantisation levels affects signal fidelity. An adaptive nonlinearity can be used in a robust Kalman filter to censure outliers in the innovations. This has been demonstrated to be significantly advantageous when impulsive noise is present. A further performance advantage can be realised by employing the robust Kalman filter to generate a mixture sequence,consistingof the original data when impulses are absent and filtered estimates in lieu of any large impulses.
In respect of demodulating FM signals in gaussian noise, compared to an FM discriminator, an EKF demodulator can provide a considerable improvement and a HMM demodulator can provide a further benefit. However trials are required to arrive at optimum values for the model parameters. The presence of impulsive noise can cause an EKF demodulator to lose phase lock, resulting in large frequency tracking errors. The use of error censuring within a robust EKF was found to reduce the occurence of phase lock problems. Better performance was obtained by filtering the output of a discriminator because the joint problems of phase reconstruction and filtering are decoupled. The use of a conventional HMM was found to provide the best demodulation performance. There is a significantcomputation cost, particularly since the demodulationrequires to be performed at a high sample rate. REFERENCES. [l]
[2]
B. D. 0. Anderson and J. B. Moore, Optimaljiltering, Prentice-Hall, Englewood Cliffs, New Jersey, pp. 194 195,1979. S . M. Kay, Fundamentals of Statistical Signal Processing: Estimation Theory,Prentice-Hall,Englewood Cliffs, New Jersey, pp. 157 - 214, 1993.
1997 IEEE TENCON - Speech and Image Technologies for Computing and Telecommunications
473
V. Krishnamurthy and J. B. Moore, "On-Line Estimation of Hidden Markov Model Parameters Based on the Kullback-Leibler Information Measure", IEEE Trans. Signal Processing, vol. 41, no. 8, pp. 2557 - 2573, 1993. S. R. Kim and A. Efron, "Adaptive Robust Impulse Noise Filtering", IEEE Trans. Signal Processing, vol. 43, no. 8, pp. 1855 - 1866, 1995. K. J. Kerpez, "Minimum Mean Square Error Impulse Noise Estimation and Cancellation", IEEE Trans. Signal Processing, vol. 43, no. 7, pp. 1651 - 1662,1995.
I
[6]
[7]
J. W. Modestino and M. V. Eyuboglu, "Simulated Performance of an Adaptive Multielement Integrated Receiver Structure in Impulsive or Burst Noise", IEEE Trans. Commun., vol. 35, no. 8, pp. 835 - 845, 1987. B. James, B. D. 0. Anderson and R. C. Williamson, "Characterisation of Thresold for Single Tone Maximum Likelihood Frequency Estimation", IEEE Trans. Signal Processing, vol. 43, no. 4, pp. 817 - 821, 1985.
-15
\' \
-20
B
d -25
s
y
-3c
',x,
-30 - INR=-10 dB
HMM -10
-5
0 SNR, dB
5
10
-35
REKF ....
0
5 FMSNR, dB
0
Fig. l(a). Performance of baseband speech revovery in gaussian noise -15INR=10 dB
-20
- '-. .-EKF ..-...- . ":. -
:
REKF
.\,
c.
KF
',\,
\.
-30 -
'.
'X..
\.
x .. . , HMM -10
-5
0 SNR, dB
5
10
" X
-35
Fig. l@). Performance of baseband speech revovery in impulsive noise
474
1997 IEEE TENCON - Speech and Image Technologies for Computing and Telecommunications