index (MPRI). We propose a novel, robust motion correction method that suppresses motion artifacts in the frequency domain. The method is validated using rest ...
Robust motion correction in the frequency domain of cardiac MR stress perfusion sequences Vikas Gupta*1,2 , Martijn van de Giessen*1,2 , Hortense Kiri¸sli3 , Sharon W. Kirschbaum4 , Wiro J. Niessen3,5 , and Boudewijn P.F. Lelieveldt1,2 1 2 3
Division of Image Processing, Leiden University Medical Center, The Netherlands Department of Intelligent Systems, Delft University of Technology, The Netherlands Biomedical Imaging Group Rotterdam, Erasmus MC Rotterdam, The Netherlands 4 Dept. of Radiology and Cardiology, Erasmus MC Rotterdam, The Netherlands 5 Quantitative Imaging Group, Delft University of Technology, The Netherlands
Abstract. First-pass cardiac MR perfusion (CMRP) imaging allows identification of hypo-perfused areas in the myocardium and therefore helps in early detection of coronary artery disease (CAD). However, its efficacy is often limited by respiratory motion artifacts, especially in stress-induced sequences. These distortions lead to unreliable estimates of perfusion linked parameters, such as the myocardial perfusion reserve index (MPRI). We propose a novel, robust motion correction method that suppresses motion artifacts in the frequency domain. The method is validated using rest and stress perfusion datasets of 10 patients and is compared to a state-of-the-art independent component analysis based method. Contrary to the latter, the proposed method reduces the remaining motion to less than the pixel size and allows the reliable computation of the MPRI. The strong agreement between perfusion parameters based on expert contours and after applying the proposed method enables the near-automated quantitative analyses of stress MR perfusion sequences in a clinical setting.
1
Introduction
Coronary artery disease (CAD) often entails a cascade of events [1] that lead to the deterioration of myocardial tissue. To detect perfusion abnormalities at an early stage of CAD, myocardial perfusion is assessed by analyzing cardiac MR perfusion (CMRP) images. Clinical interest is moving towards a combination of both rest and stress-induced perfusion [2, 3] to quantify parameters such as the myocardial perfusion reserve index (MPRI), a measure for the ability of the heart to adapt to physical exercise. However, in many cases, especially in stress MR acquisitions, the inability of a patient to breath-hold adequately during the image acquisition leads to misalignments between subsequent frames of an image acquisition [4] and MPRI, *These authors contributed equally to this work.
which is based on dynamic contrast uptake (upslope), cannot be measured reliably. In this paper, we propose a novel motion correction method which is especially aimed at robustness. Many methods have been proposed to eliminate CMRP motion artifacts, but predominantly in rest sequences. An in-depth overview of these algorithms is given in [5]. A group of algorithms that was shown to outperform most other approaches was based on independent component analysis ICA [6, 7]. The efficacy of this method, however, is constrained by its dependence on the correct identification of component images and their corresponding weights to generate a reference image. A similar approach, which adds robustness to motion in a free breathing acquisition, was used by [8] but its applicability is limited by an inherent assumption of quasi-periodicity in these sequences. Although the existing strategies succeed in achieving desired results for rest image sequences, their efficacy on stress images from patients suspected of CAD has not been proven yet. As the motion in stress images differs considerably from motion in rest images both in its extent and variability, we found that methods based on estimates of global components, such as [6, 7] are likely to fail because initial component estimates are too unreliable. Instead of explicitly estimating the time-intensity curves for different regions, our approach aims to minimize the sudden changes in intensity that are characteristic for motion artifacts. To this end we iteratively minimize the high frequency content in the time-intensity curves by concurrently realigning the frames in the cardiac sequence. The proposed frequency domain approach is aimed to be robust against large and irregular patient motion and therefore makes very few assumptions on the expected scan data. Furthermore the algorithm is computationally inexpensive and inherently robust to time-shifts in the acquisition. The proposed algorithm is validated on rest and stress sequences of 10 patients and compared to an ICA based method [6] that was shown to be more robust in comparison to the other methods in literature, including the standard registration methods.
2
Method
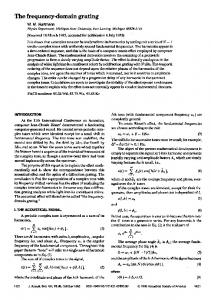
Motion artifacts manifest themselves as sudden intensity changes that typically only last a single frame. Such sudden changes show up as undesired high frequency content (See Figure 1). Using a high pass filter, this content can be separated from the frequencies present in a sequence without motion artifacts. We propose to write the high frequency content as a cost function of the translations of all the frames in the sequence. Minimizing this cost function concurrently over all frames then should remove the motion artifacts. Let us denote the intensity profile of a pixel at coordinates x and y in input image sequence I with N frames as Ix,y (t). The frequency content of this timeintensity curve is then given by the discrete Fourier transform (DFT): Iˆx,y (ω) = F [Ix,y (t)] =
N −1 ∑ t=0
Ix,y (t)e−j2πωt/N
(1)
200
Intensity
150 100 50
Motion No motion (FT) No motion (ICA)
0
10
20
30
40
50
Frame
(a)
(b) 1000
Motion No motion (FT) No motion (ICA)
Magnitude
800 600 400 200 0
−20
−10
(c)
0 ω
10
20
(d)
Fig. 1: Typical frames of cardiac sequences before (a) and after (c) motion correction (with FT). The frames are annotated with epi- and endocardial contours. + (near arrows) indicates the RV insertion point. (b) Example time-intensity curves in the time domain and (d) in the frequency domain. The motion artifacts visible in the time domain show up as additional high-frequency content in the frequency domain.
where t and ω refer to time (in this work frame number) and frequency, respectively. We define a high pass filter H(ω) that passes the high frequency components due to motion artifacts. The filtered signal in the frequency domain is complex, however, and therefore the energy spectral density of the signal is used to form the cost for the intensity profile at Ix,y : Cx,y =
)( )∗ 1 ∑( H(ω)Iˆx,y (ω) H(ω)Iˆx,y (ω) 2π ω
(2)
where ∗ denotes the complex conjugate. The total cost within a region of interest Ω is then given by ∑ Ctotal = Cx,y (3) (x,y)∈Ω
Using Vandermonde matrices F to compute the DFT and vector hω and ix,y for the filter H(ω) and time-intensity profile Ix,y (t), respectively the cost Cx,y can be evaluated inexpensively as Cx,y = iTx,y F ∗ h∗ω hω F ix,y ≡ iTx,y W ix,y
(4)
where W is the same for each intensity profile, as it only depends on the number of frames. Each intensity value in ix,y can be considered as a function of the transformation of the respective slice. For translations sx,t and sy,t for frame t in the x and y directions, respectively, the gradient of the cost to these translations is given by ∂Cx,y ∂Cx,y ∂ix,y ∂ix,y = = 2iTx,y W (5) ∂sx,t ∂ix,y ∂sx,t ∂sx,t ∂i
where ∂sx,y is the negative image intensity derivative in the x direction. A similar x,t equation holds for the y direction. Using a constant high-pass filter H (ω) that blocks the frequencies present in motion-less time intensity curves, the complete motion correction procedure consists of two steps: 1. Select a region of interest (ROI) Ω containing the left and right ventricles. 2. Minimize (3) using a gradient-descent algorithm. To avoid the trivial solution of moving all high frequency content out of the ROI Ω, the sums of all translations in the x direction and all translations in the y direction are kept 0.
3
Data
A dataset comprising rest and stress images from 10 patients with suspected CAD and normal left ventricular ejection fraction was used to validate the proposed method. All the images were acquired using a 1.5 Tesla MRI scanner (Signa CV/i, GE Medical Systems, Milwaukee, Wisconsin, USA), with a cardiac eight-element phased-array receiver coil placed over the thorax. The acquisition was performed using a steady-state free precession technique (FIESTA) and with Gd-DTPA (Magnevist, Schering, Germany) as the contrast agent. The temporal resolution per slice of 120 ms allowed imaging of 3-6 slices per R-R interval. Stress images were acquired 15 minutes after the acquisition of rest images using adenosine as the vasodilator. Both rest and stress images were acquired using the same pulse sequence and orientations.
4
Experiments
The following experiments validate the proposed method in terms of registration accuracy as well as two clinically relevant perfusion parameters: relative upslope and myocardial perfusion reserve index (MPRI). These parameters are widely
accepted as reliable indices [2, 3] These outcomes are compared to the existing ICA based algorithm for motion correction in [6, 7]. From ten patients, the basal slices of both a rest and a stress sequence of approximately 50 frames were used for validation. All frames were annotated by an expert with epi- and endocardial contours as well as a landmark at the inferior RV insertion point (See Figure 1). This landmark is normally used to determine the orientation of the myocardium. The annotated landmarks serve as ground truth for the motion correction, while the ground truth (expert) perfusion parameters are computed based on the annotated contours. All rest and stress sequences were registered using the ICA based algorithm and the proposed Fourier transform (FT) based algorithm. For the evaluation of ICA and FT based algorithms, only one pair of contours was drawn on the first frame, which were propagated to the subsequent frames after motion correction. For all three sets (expert, ICA and FT), the relative upslopes were computed using the MASS software package [9].
5 5.1
Results Motion correction
The means and standard deviations of the annotated RV insertion points in the unregistered and registered sequences (with ICA and FT) from all patients are shown in Table 1, expressed in pixels (Average pixel size 1.52 ± 0.05 mm isotropic). These values describe the Euclidean distances between the landmarks in consecutive frames. The mean motion in the unregistered images was 2.46 ± 7.04 pixels in rest and 4.85 ± 10.71 pixels in stress sequences. After the ICA based registration, these values reduced to 1.76 ± 4.64 and 5.08 ± 10.46 pixels, respectively. However, the motion in images registered using the proposed FT method was 0.15 ± 0.82 pixels (rest) and 0.23 ± 1.06 pixels (stress). The relatively bad performance of the ICA based motion correction, especially in the stress sequences, can be attributed to the incorrect identification of the components on which its correction algorithm relies. These components now mainly captured motion artifacts instead of time-intensity perfusion information. For four patients the FT algorithm had standard deviations higher than a pixel. In these cases single frames, with very low contrast in the myocardial region were misregistered. The large error for ICA in the rest sequence of patient 4 was due to flickering intensity variations between consecutive frames. The FT algorithm is apparently robust against these artifacts. The robustness of the proposed algorithm clearly follows from the sub-pixel mean values in Table 1. 5.2
Perfusion parameters
Based on the registered sequences, the relative upslope is defined as the ratio of the absolute upslopes of the myocardium and the LV blood pool, where the absolute up-slope is given by the maximum value of the first order derivative
Table 1: Comparison of motion in unregistered sequences, in sequences registered using ICA, and in sequences registered using the proposed method (FT). Results for both rest and stress sequences of the same patient are presented. Pat. 1 2 3 4 5 6 7 8 9 10
Unregistered 3.14 ± 9.98 0.39 ± 1.04 1.15 ± 2.91 4.34 ± 12.81 0.75 ± 2.06 0.17 ± 0.67 4.09 ± 9.91 0.04 ± 0.29 4.01 ± 16.87 6.60 ± 13.84
Rest ICA 0.39 ± 1.20 0.06 ± 0.43 1.04 ± 2.70 10.53 ± 26.12 0.47 ± 1.47 0.23 ± 0.66 0.48 ± 1.10 0.00 ± 0.00 1.28 ± 4.67 2.53 ± 8.08
FT 0.06 0.02 0.20 0.14 0.01 0.03 0.17 0.00 0.68 0.19
± ± ± ± ± ± ± ± ± ±
0.43 0.11 0.51 0.60 0.08 0.14 0.67 0.00 4.78 0.88
Unregistered 2.77 ± 5.18 2.48 ± 16.00 1.58 ± 3.42 7.29 ± 18.24 3.37 ± 6.09 5.54 ± 8.69 7.33 ± 12.64 7.62 ± 13.40 3.40 ± 9.48 7.07 ± 13.95
Stress ICA 6.51 ± 13.81 3.05 ± 6.16 5.61 ± 13.65 9.16 ± 12.51 2.39 ± 3.43 2.19 ± 2.37 8.71 ± 15.37 6.31 ± 21.84 1.67 ± 2.46 5.22 ± 13.06
FT 0.22 0.11 0.06 0.11 0.61 0.06 0.36 0.07 0.14 0.57
± ± ± ± ± ± ± ± ± ±
1.00 0.40 0.36 0.43 2.57 0.23 2.22 0.35 0.67 2.46
Table 2: MPRI values for expert annotation and after FT motion correction. Patient 1 2 3 4 5 6 7 8 9 10 Expert 1.11 4.04 3.84 1.72 1.53 1.52 1.39 2.73 1.24 0.62 FT 1.07 3.65 3.31 1.73 1.58 1.58 1.68 2.55 1.15 0.60
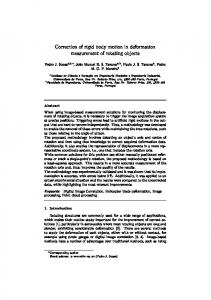
of time-intensity curve within the ROI. Only the initial ascent of the contrast agent’s first pass is considered for this computation. MPRI is computed as the ratio of the relative upslope values obtained under stress and at rest. Figure 2 shows the relative upslopes (for both rest and stress) as estimated after motion correction using ICA and FT and compared to the upslopes based on the contours annotated by the expert. For both ICA and FT, the rest upslopes did not differ statistically significant (P < 0.05) from the expert annotations. However, the stress upslope estimates after ICA motion correction were significantly different (P = 0.0255). Furthermore it can be observed in Figure 2that, using ICA, the relative upslope tends to be overestimated. This is to be expected, due to high first order derivatives caused by motion artifacts. As both the rest and stress upslopes for FT did not differ significantly from the expert values, MPRI values based on these can be considered meaningful and they are compared to the expert values in Table 2.
5.3
Computation time
Our experiments show that sequences of 50 frames can be automatically registered in 20 seconds compared to approximately 1 minute required by ICA and 10 minutes required for manual annotation. This shows the substantial reduction in processing time achievable for registering large CMRP image datasets when using the proposed registration method.
10 5 0 −5 ICA FT
−10 −15 0
10 20 Rest upslope: expert
(a)
Stress upslope error: ICA, FT
Rest upslope error: ICA, FT
15
20 10 0 −10 ICA FT
−20 0
20 40 Stress upslope: expert
(b)
Fig. 2: Bland-Altman plots with ICA and FT estimates of relative upslopes in (a) rest and (b) stress sequences, compared to expert annotations. The means are denoted with a dashed line for ICA and a solid line for FT. For clarity, confidence boundaries have been left out.
6
Discussion and conclusion
We have presented a robust method that eliminates motion artifacts in rest and stress CMRP images by correcting for translations due to respiratory motion, which is particularly apparent in stress sequences. The method was validated on datasets from 10 patients prone to CAD and it compared favorably to a stateof-the-art ICA based method [6, 7], especially in stress sequences. Particularly encouraging were the mean registration errors of less than a pixel in both rest and stress sequences and the agreement between the perfusion parameters based on expert contours and the proposed method. The differences between them were found to be statistically insignificant, which shows that translations alone were sufficient to remove motion artifacts. By minimizing motion artifacts in the frequency domain using a high-pass filter, the motion correction problem became a simple quadratic function of timeintensity profiles that can be solved efficiently. Furthermore, the algorithm is inherently robust to time-shifts in the acquisition. Although not explicitly shown in the results, the method does not suffer from drift, as relative displacements between all frames influence the cost to be minimized. No failure cases were observed in our datasets but large in/through plane motion could, in principle, induce inter-frame shape variations that introduce higher frequency content similar to motion artifacts. Another drawback from the current implementation is that it is semi-automatic as user input is required for the selection of an ROI that encompasses both the RV and the LV. Future work will therefore focus on: a) including a transformation model with more degrees of freedom, and b) detecting the ROI automatically.
However, selecting an ROI in a single frame requires minimal user-interaction, while previously the amount of manual adjustments needed to compensate for large and frequent patient motion were prohibitive. Since the correction of deformations using non-rigid registration only slightly improves the motion compensation when compared to rigid registration [10], the absence of through plane motion correction is also not a significantly limiting factor. To our knowledge, the minimal effort, combined with the robustness of the proposed method make it feasible for the first time to process stress sequences in a clinical setting and using parameters such as MPRI in patient care.
References 1. Kaandorp, T., Lamb, H., Bax, J., van der Wall, E., de Roos, A.: Magnetic resonance imaging of coronary arteries, the ischemic cascade, and myocardial infarction. American heart journal 149(2) (2005) 200–208 2. Al-Saadi, N., Gross, M., Bornstedt, A., Schnackenburg, B., Klein, C., Fleck, E., Nagel, E.: Comparison of various parameters for determining an index of myocardial perfusion reserve in detecting coronary stenosis with cardiovascular magnetic resonance tomography. Zeitschrift f¨ ur Kardiologie 90(11) (2001) 824 3. Jerosch-Herold, M., Seethamraju, R., Swingen, C., Wilke, N., Stillman, A.: Analysis of myocardial perfusion MRI. Journal of Magnetic Resonance Imaging 19(6) (2004) 758–770 4. McLeish, K., Hill, D., Atkinson, D., Blackall, J., Razavi, R.: A study of the motion and deformation of the heart due to respiration. IEEE Transactions on Medical Imaging 21(9) (2002) 1142–1150 5. Gupta, V., Kiri¸sli, H.A., Hendriks, E.A., van der Geest, R.J., van de Giessen, M., Niessen, W., Reiber, J.H.C., Lelieveldt, B.P.F.: Cardiac MR perfusion image processing techniques: A survey. Medical Image Analysis 16(4) 767–785 6. Milles, J., van der Geest, R.J., Jerosch-Herold, M., Reiber, J.H.C., Lelieveldt, B.P.F.: Fully automated motion correction in first-pass myocardial perfusion MR image sequences. IEEE Transactions on Medical Imaging 27(11) (2008) 1611–21 7. Gupta, V., Hendriks, E.A., Milles, J., van der Geest, R.J., Jerosch-Herold, M., Reiber, J.H.C., Lelieveldt, B.P.F.: Fully Automatic Registration and Segmentation of First-Pass Myocardial Perfusion MR Image Sequences. Academic Radiology 17(11) (2010) 1375–1385 8. Wollny, G., Ledesma-Carbayo, M.J., Kellman, P., Santos, A.: Exploiting quasiperiodicity in motion correction of free-breathing myocardial perfusion MRI. IEEE Transactions on Medical Imaging 29(8) (2010) 1516–27 9. Van der Geest, R.J., Lelieveldt, B.P.F., Angelie, E., Danilouchkine, M., Sonka, M., Reiber, J.H.C.: Evaluation of a new method for automated detection of left ventricular contours in time series of Magnetic Resonance Images using an Active Appearance Motion Mode. Journal of Cardiovascular Magnetic Resonance 6(3) (2004) 609–617 10. Xue, H., Guehring, J., Srinivasan, L., Zuehlsdorff, S., Saddi, K., Chefdh´ otel, C., Hajnal, J.V., Rueckert, D.: Evaluation of rigid and non-rigid motion compensation of cardiac perfusion MRI. In Metaxas, D., Axel, L., Fichtinger, G., Szkely, G., eds.: MICCAI. Volume 5242., Springer, Heidelberg (2008) 35–43