IEEE TRANSACTIONS ON IMAGE PROCESSING, VOL. 10, NO. 12, DECEMBER 2001
1873
Motion Estimation in the Frequency Domain Using Fuzzy C-Planes Clustering Çi˘gdem Ero˘glu Erdem, Student Member, IEEE, Günes¸ Z. Karabulut, Evs¸en Yanmaz, and Emin Anarim
Abstract—A recent work explicitly models the discontinuous motion estimation problem in the frequency domain where the motion parameters are estimated using a harmonic retrieval approach [1], [2]. The vertical and horizontal components of the motion are independently estimated from the locations of the peaks of respective periodogram analyses and they are paired to obtain the motion vectors using a procedure proposed in [1]. In this paper, we present a more efficient method that replaces the motion component pairing task and hence eliminates the problems of the pairing method described in [1]. The method described in this paper uses the fuzzy c-planes (FCP) clustering approach [3]–[5] to fit planes to three-dimensional (3-D) frequency domain data obtained from the peaks of the periodograms. Experimental results are provided to demonstrate the effectiveness of the proposed method. Index Terms—Frequency estimation, fuzzy c-planes (FCP), fuzzy clustering, motion estimation.
I. INTRODUCTION
M
OTION estimation is an important problem in video processing that is utilized in many applications such as video coding, object-based video manipulation, object-based segmentation, and dynamic scene analysis. Many studies have been carried out in an effort to estimate the motion of the objects in a scene [2], [6]–[10]. There are a number of approaches based on the correlation methods [6], [8], and the optical flow constraint [6]–[8]. These methods generally use regularization techniques assuming the smoothness of the motion field in order to obtain a unique solution. This smoothness assumption has an unwanted side effect of over-smoothing the motion discontinuities. In a recent work [1], [2], the discontinuous motion estimation problem is handled in a harmonic retrieval framework. In this approach, the motion discontinuities are explicitly modeled and the velocity estimation is carried out independently of
Manuscript received December 8; 2000; revised October 4, 2001. This work was supported by the Scientific and Technical Research Council of Turkey (TÜB˙ITAK-BAYG) and Bo˘gaziçi University Research Fund under Project 99A207. The associate editor coordinating the review of this manuscript and approving it for publication was Dr. Christoph Stiller. Ç. E. Erdem and E. Anarım are with the Department of Electrical and Electronics Engineering, Bo˘gaziçi University, 80815 ˙Istanbul, Turkey (e-mail:
[email protected];
[email protected]). G. Z. Karabulut was with the Department of Electrical and Electronics Engineering, Bo˘gaziçi University, 80815 ˙Istanbul, Turkey. She is now with the School of Information Technology and Engineering, University of Ottawa, Ottawa, ON K1N 6N5, Canada (e-mail:
[email protected]). E. Yanmaz was with the Department of Electrical and Electronics Engineering, Bo˘gaziçi University, 80815 ˙Istanbul, Turkey. She is now with the Department of Electrical Engineering, State University of New York (SUNY) at Buffalo, Amherst, NY 14260 USA (e-mail:
[email protected]). Publisher Item Identifier S 1057-7149(01)10557-9.
the shape of the moving object and the density of motion discontinuities. The moving objects are assumed to have different translational motion parameters and the motion is assumed to be time-invariant in a short time interval. In order to find the motion parameters, first, horizontal and vertical component sets along with their corresponding sums are estimated from the peak locations of periodogram analyses [1]. Periodogram analysis is a nonparametric method for spectrum estimation. A component pairing approach follows this step which is prone to errors. In this work, we present a more robust method for estimation of the motion parameters, which uses the three-dimensional (3-D) frequency domain data and fits planes to them via the fuzzy c-planes (FCP) clustering method [3]–[5]. This approach has been indicated in [1] as future work with no results given. In Section II, the theoretical background for modeling the motion estimation problem in the frequency domain [1] is introduced. In Section III, the motion parameter estimation method using the FCP clustering approach is presented. In Section IV, the experimental results are given and compared with the pairing method of [1]. In Section V, concluding remarks are given. II. THEORETICAL BACKGROUND In this section, the multiple discontinuous motion modeling approach described in [1] is briefly summarized. The reader should refer to [1] for a detailed explanation of notation and equations. Given an image sequence, it is assumed that there exists (including the background) objects (partitions) in the scene at time , i.e. (1) denotes the region of interest of the image at time where and is the support region of object . Let de, if there were note the “ideal” image of object , at time , deno occlusion. Let the parameters note the motion vectors of the objects, which are assumed to be constant in a short time interval . Then, the image sequence , can be represented as [1] (2) denotes the indicator function representing where , which takes the value 1 if and takes the value 0 otherwise.
1057–7149/01$10.00 © 2001 IEEE
1874
IEEE TRANSACTIONS ON IMAGE PROCESSING, VOL. 10, NO. 12, DECEMBER 2001
After some manipulations [1], (2) can be written as
(3) (4) is the ideal image of object and denotes its corwhere responding average support window over frames [1] (5) The term (6) denotes the error, where denotes the difference between the support window of object at time and its shifted average support window. The two-dimensional (2-D) spatial Fourier transform of (3) gives
(7) ) pair is fixed, is a one-dimenWhen the ( harmonics in noise where sional (1-D) signal consisting of the frequency of the th harmonic is (8) Our aim is to estimate the motion parameters . Periodogram analysis is a classical method for estimating the parameters of harmonics in noise [11] and is based on the Fourier transform of the data sequence. Another method for frequency estimation is the MUltiple SIgnal Classification (MUSIC) algorithm [12], which can provide a higher resolu) pair, the perition than the periodogram. For a specific ( which is based on its temporal Fourier odogram of transform is given by (9) the peaks of which give the component frequencies , as a function of the motion param, eters. In [1], the peaks of the periodograms of , and are determined to estimate the motion parameter sets in the and directions and the set consisting of the sum of these two velocity components, respectively. Then the motion parameter sets in the and directions are paired such that (10)
is minimized where , , and are members of the sets consisting of the motion parameters in the and directions and their sums, respectively [1]. The parameter indicates the number of objects in the scene with distinct motion parameters and is estimated as the maximum of the number of elements of the three velocity sets described above. This approach may give erroneous results in some cases. For example, if we have three objects in our scene moving with mo, , and tion parameters , the above pairing method of [1] will find , since all the number of moving objects in the scene as the velocity sets will contain two elements. To be more specific, the set consisting of the -components of the velocities will be , the set consisting of the -components of the velocities , and the set consisting of the sum will will be . In the next section, we propose another method be based on fuzzy c-means clustering that eliminates the need for pairing the velocity components using (10). III. MOTION PARAMETER ESTIMATION USING FUZZY C-PLANES CLUSTERING In this section, we present another approach for simultaneous motion parameter estimation and pairing which is based on the FCP clustering algorithm [3]–[5]. This approach overcomes the difficulties of the pairing method of [1]. ) pairs, the peaks of the periodogram For different ( of (9) are estimated and the 3-D data are formed as (11) denotes the location of a peak. There may be more where ) pair. than one dominant peak for a specific ( Note that, since these 3-D points satisfy the equation (12) planes in 3-D frequency domain. they are expected to form The plane parameters are the negatives of the motion parameters. We estimate the plane parameters via clustering these 3-D data into planes. The estimated plane parameters give us the motion parameters without the need for a pairing step. In order to cluster the above 3-D frequency domain points into planes, we use the FCP algorithm [3]–[5]. The FCP algorithm uses all of the sampled 3-D data vectors as given in (11), for ), instead of some specific values of different values of ( ). The FCP is a probabilistic clustering method which ( minimizes the following cost function: (13) where is the total number of 3-D data points, is the number is the membership value of the th data vector to of planes, is the distance between the th data vector, and the th plane, the th plane and is the fuzzifier which is a weight parameter. The FCP method is “fuzzy” in the sense that at each iteration, a data vector belongs to each of the classes to a certain degree. The above cost function denotes the weighted average of the distance between the data points and their assigned planes. The
ERDEM et al.: MOTION ESTIMATION IN THE FREQUENCY DOMAIN
1875
distance is calculated as given in (18), where is a point which characterizes normalized centroid of the th plane. The membership parameter is subject to the constraints given in (14) and (15). In order to minimize the cost function (13), the derivatives with respect to and are calculated, which give us of the expressions (16) and (19) (for details, see [5]). The steps of the alternating optimization algorithm that minimizes the cost function (13) are given below. Step 1) Initialize each membership value , randomly such that the constraints (a)
(14)
(b)
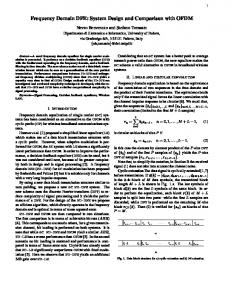
Fig. 1. (a) First and (b) 20th frames of the sequence containing three moving blocks.
and
(15) are satisfied. Inspecting the 3-D plot of the data vectors ( ’s) visually to set simple thresholds may also be helpful in initializing the algorithm close to the desired local minimum when the data is noisy. Step 2) Estimate each normalized cluster centroid, using the equation (16) Here, denotes the data vectors as defined in (11) and is a parameter that represents the amount of fuzziness of the clustering. The larger the is, the fuzzier the clustering becomes, since the weighting will become closer to zero faster. For exfactor and , then the weight ample, if will be 0.3487. If is chosen to be large, this may cause the (local) minima of the cost function to be less clearly distinguishable. However, choosing a large value for may help to reduce the effect of noisy data by minimizing its weight [3]. A frequently chosen value for is 2 [5]. Step 3) Estimate the covariance matrix of each cluster (plane), , as follows: (17) Step 4) Find the distance of each data point to each of the current clusters (planes). These distances will be used in the next step to update the membership values. Since the data points of each cluster are expected to lie on a plane, which is spanned by two ( and vectors, the largest two eigenvectors of ) are found and the squared distance between the data point and the plane is estimated as follows:
Fig. 2. Theoretical motion planes for the sequence containing three moving blocks.
The above equation calculates the perpendicular disto the estimated plane tance from the data point . The first term is the squared of the distance beand the cluster centroid . tween the data point The second term finds the projection of the vector to onto each of the eigenvectors of the from plane and subtracts them from the first term to find the perpendicular distance. Step 5) Update the membership values of the data points as follows:
(19) Step 6) Repeat the steps 2–5 until the change in the membership values between two successive iterations is below a certain error threshold , i.e., (20)
(18) where
denotes the iteration number.
1876
IEEE TRANSACTIONS ON IMAGE PROCESSING, VOL. 10, NO. 12, DECEMBER 2001
Fig. 3.
Periodogram plots for different (w
(w
) = (0:508; 0).
;w
;w
) pairs: (a) (w
;w
) = (0:127; 0:698); (b) (w
Step 7) Estimate motion parameters of each object using the eigenvectors of each plane. When the number of planes is not known a priori, the numercan be used to estimate it. ical value of the cost function decreases for increasing values of . The cost function However, the decrease occurs in larger steps until the correct number of planes is reached and the cost function decreases in smaller steps afterwards. This property is used to estimate the number of planes as described in the next section.
IV. EXPERIMENTAL RESULTS The proposed method is first tested using a synthetically generated sequence, which contains three moving blocks on a stationary background. Two frames of this sequence are shown in Fig. 1. The motion vectors for the three blocks are , , and in the northwest direction. The theoretical motion planes in the 3-D frequency domain are shown in Fig. 2. The top plane correand the other sponds to the motion vector
;w
) = (0:508; 0:508); (c) (w
;w
) = (0; 0:508); and (d)
planes correspond to the motion vectors and . In Fig. 3, several periodogram plots pairs. Note that three peaks are are given for different clearly visible in Fig. 3(a), whereas only two peaks exist when , as shown in Fig. 3(b) and when or is close to zero as shown in Fig. 3(c) and (d). The peaks of the periodogram are estimated using the pickpeak function of MATLAB which simply uses the derivatives of the periodogram. Some spurious peaks are eliminated afterwards if the magnitude of the peak is smaller than a certain fraction (0.3) of the maximum peak. The 3-D data extracted from the peak locations of the periodograms are shown in Fig. 4. In order to estimate the number of objects, we plotted the cost function (13) for different number of planes as shown in Fig. 6. The cost function decreases sharply until and the remaining part of the plot is almost flat. This shows that the number of objects in the scene is three. The estimated velocities are close to the true values, as tabulated in Table I, and as demonstrated in Fig. 5. Using FCP clustering, the velocities of the three moving objects are correctly estimated, whereas this is not possible with the pairing approach of [1], as discussed in Section II.
ERDEM et al.: MOTION ESTIMATION IN THE FREQUENCY DOMAIN
Fig. 4. Data points obtained from the peak points of the periodogram for the synthetic sequence. The symbols ‘o,’ ‘3,’ and ‘ ’ represent data points belonging to different planes estimated by the FCP clustering algorithm.
+
Fig. 5.
Motion planes estimated using the clustered data shown in Fig. 4.
1877
Fig. 6. Cost function versus number of planes. The solid line marked with ‘o’ signs is for the sequence with three moving blocks and the dashed line marked with ‘3’ signs is for the “Hamburg Taxi” sequence. The magnitudes have been scaled so that the maximum cost value is mapped to one. TABLE I THE ORIGINAL AND ESTIMATED MOTION VECTORS FOR THE SEQUENCE CONTAINING THREE MOVING BLOCKS
(a)
(b)
Fig. 7. The (a) 1st and (b) 20th frames of the “Taxi in Garden” sequence.
Another sequence that we used for testing the plane-fitting approach is the “Taxi in Garden” sequence, which is shown in Fig. 7. In this sequence, the white taxi moves with a ve) in the northeast direction. As a preprolocity vector of ( cessing step, we applied histogram equalization in order to enhance the contrast. Although the background is cluttered, the plane fitting approach was able to estimate the velocity vector ). as ( We also used two natural sequences to test the algorithm. The first one is the “Hamburg Taxi” sequence which is shown in Fig. 8. The spectrum analyses are done using the MUSIC algorithm [12]. The true velocity values are determined by manual feature point tracking [1]. As seen in Table II, the estimated motion parameters are quite close to the actual values. The first three rows of Table II give the motion parameters of the three
vehicles and the last row gives the parameters of the stationary background. The walking person in the upper left corner is not detected since it is too small. The cost function (13) for different number of planes is shown in Fig. 6. The cost function decreases increases up to four, and the rest of the plot is sharply until almost flat indicating that the number of objects in the scene is four. The second natural sequence used for testing the algorithm is the “Coast Guard” sequence, which is shown in Fig. 9. Between the 130th and the 140th frames, the boat moves toward right and the background translates toward left due to the motion of the camera. The true values of the motion vectors are estimated by manual feature point tracking. Table III shows the true and estimated values of the motion vectors. The first row of Table III
1878
Fig. 8.
IEEE TRANSACTIONS ON IMAGE PROCESSING, VOL. 10, NO. 12, DECEMBER 2001
(a)
(a)
(b)
(b)
The (a) 1st and (b) 20th frames of the “Hamburg Taxi” sequence.
TABLE II THE ORIGINAL AND ESTIMATED MOTION VECTORS FOR THE “HAMBURG TAXI” SEQUENCE
Fig. 9.
The (a) 130th and (b) 140th frames of the “Coast Guard” sequence.
THE ORIGINAL
AND
TABLE III ESTIMATED MOTION VECTORS GUARD” SEQUENCE
FOR THE
“COAST
gives the motion parameters of the boat and the second row gives the parameters of the background. Note that although the motion in the scene is not purely translational due to the waves in front of the boat, the flag, and the person on the boat, the estimated motion vectors are reasonably close to the true values.
presented method is based on fitting planes to the 3-D data in the frequency domain using FCP algorithm. The parameters of these planes correspond to the horizontal and vertical motion parameters of the objects in the scene. This approach eliminates the need to pair the velocity components of the objects [1]. The experiments on synthetic and natural image sequences demonstrate the effectiveness of the proposed method.
V. CONCLUSIONS
REFERENCES
In this paper, we presented an alternative approach for the pairing and motion parameter estimation problem of [1]. The
[1] W.-G. Chen, G. B. Giannakis, and N. Nandhakumar, “A harmonic retrieval framework for discontinuous motion estimation,” IEEE Trans. Image Processing, vol. 7, pp. 1242–1256, Sept. 1998.
ERDEM et al.: MOTION ESTIMATION IN THE FREQUENCY DOMAIN
[2] [3] [4] [5] [6] [7] [8] [9] [10] [11] [12]
, “Spatio-temporal approach for time-varying image motion estimation,” in Proc. IEEE ICIP, vol. 2, 1994, pp. 232–236. J. C. Bezdek, C. Coray, R. Gunderson, and J. Watson, “Detection and characterization of cluster substructure—Part I: Linear structure: Fuzzy c-lines,” SIAM J. Appl. Math., vol. 40, no. 2, pp. 339–357, 1981. , “Detection and characterization of cluster substructure—Part II: Fuzzy c-varieties and convex combinations thereof,” SIAM J. Appl. Math., vol. 40, no. 2, pp. 358–372, 1981. F. Hoppner, F. Klawonn, R. Kruse, and T. Runkler, Fuzzy Cluster Analysis: Methods for Classification, Data Anlaysis and Image Recognition. New York: Wiley, 1999. J. L. Barron, D. J. Fleet, and S. S. Beauchemin, “Performance of optical flow techniques,” Int. J. Comput. Vis., vol. 12, no. 1, pp. 43–77, 1994. B. K. P. Horn and B. G. Schunk, “Determining optical flow,” Artif. Intell., vol. 17, pp. 185–203, 1981. A. M. Tekalp, Digital Video Processing. Englewood Cliffs, NJ: Prentice-Hall, 1995. R. W. Young and N. G. Kingsbury, “Frequency-domain motion estimation using a complex lapped transform,” IEEE Trans. Image Processing, vol. 2, no. 1, pp. 2–17, 1993. C. Demiroglu and E. Anarim, SIU-Signal Processing and Applications Ankara, Turkey, 1999, pp. 336–339. P. Stoica and R. Moses, Introduction to Spectral Analysis. Englewood Cliffs, NJ: Prentice-Hall, 1997. S. Haykin, Adaptive Filter Theory. Englewood Cliffs, NJ: PrenticeHall, 1991.
Çi˘gdem Ero˘glu Erdem (S’93) was born in Ankara, Turkey. She received the B.S. and M.S. degrees from the Department of Electrical and Electronics Engineering, Bilkent University, Ankara, in 1995 and 1997, respectively. She is currently pursuing the Ph.D. degree in the Department of Electrical and Electronics Engineering, Bo˘gaziçi University, ˙Istanbul, Turkey. From 1995 to 1998, she was a Research and Teaching Assistant in the Department of Electrical and Electronics Engineering, Bilkent University. Since 1998, she has been with the Bo˘gaziçi University Signal and Image Processing Laboratory (BUSIM), where she is working on video processing, motion estimation, video segmentation, and object tracking. From September 2000 to June 2001, she was a Visiting Research Associate in the Department Electrical and Computer Engineering, University of Rochester, Rochester, NY.
1879
Günes¸ Z. Karabulut was born in ˙Istanbul, Turkey, in 1979. She received the B.S. degree in electrical and electronics engineering from Bo˘gaziçi University, ˙Istanbul, in 2000. Currently she is pursuing the M.Sc. degree at the University of Ottawa, Ottawa, ON, Canada. From 1999 to 2000, she was with the Signal and Image Processing Laboratory, Bo˘gaziçi University, where she worked on motion estimation algorithms. She is presently a Research Assistant at CASP Group, University of Ottawa. Her research interests include coding theory, coded modulation schemes, and image coding.
Evs¸en Yanmaz was born in Ankara, Turkey, in 1979. She received the B.S. degree in electrical and electronics engineering from Bo˘gaziçi University, ˙Istanbul, Turkey, in 2000, and is presently pursuing the M.S. degree in electrical engineering at State University of New York (SUNY) at Buffalo, Amherst, NY. From 1999 to 2000, she was with the Signal and Image Processing Laboratory, Bo˘gaziçi University, where she worked on motion detection and estimation algorithms. Since May 2001, she has been a Research Assistant at the Personal Communications Research Group (PCRG) at SUNY at Buffalo. She has been working on congestion in cellular systems and dynamic load balancing schemes. Her current research interests are in channel allocation in integrated cellular systems and mobile ad hoc networks.
Emin Anarim was born in Izmir, Turkey, in 1955. He received the B.S. degree from the Turkish Air Force Academy, ˙Istanbul, Turkey, in 1976, and the B.S., M.S., and Ph.D. degrees in electrical engineering from Bo˘gaziçi University, ˙Istanbul, in 1981, 1983, and 1985, respectively. Between 1985 and 1993, he was a part-time Associate Professor at Bo˘gaziçi University. In 1993, he joined the Department of Electrical and Electronics Engineering at the same university, where he is currently a full-time Professor. His general interests lie in the areas of signal processing and communications, detection and estimation theory, video coding, and compression. Specific areas of expertise have included wavelets, motion estimation and subband filter design, and low bit rate video coding. His current research focuses on applications of signal processing to CDMA and spread spectrum communication systems and computer security.