is sufficiently robust. Figure 5. Performance index (I) for some performances. I : Transversal Slope (ptrans). Highway loads. Railway loads. 10 kN/m. 20 kN/m.
Robust Reliability-based Design Optimization of Suspension Bridges Luciano Catallo and Franco Bontempi University of Rome “La Sapienza”, Rome, Italy Fabio Biondini Technical University of Milan, Milan, Italy Dan M. Frangopol University of Colorado, Boulder, Colorado, USA
Abstract Design rules for modern cable suspension bridges are developed using reliability theories inside a general risk management based framework. In this context, optimal structural design must be considered under the presence of uncertainties in loading, geometry and material properties, whereas the deterministic approaches of optimization neglect the effects of uncertainties associated with design variables. This paper is based on the theory of finite element reliability analysis of geometrically nonlinear elastic structures. It provides computer implementation considerations and developments. For the assessment of overall reliability of suspension bridges, in this paper only static load effects are examined. The sensitivity of the reliability judgments with respect to different loading combinations is also studied.
1 Introduction The subject of this study is a complex structure like a long span suspension bridge, illustrated in Figure 1. The main span of the bridge is 3300 m, while the total length of the 60 m wide deck is 3666 m. The deck is formed by three box sections, outer ones for the roadway and the central one for the railway [2; 5].
960 777
3300 m 3300
183 +383.00
+54.00
+52.00
183
810 627
+383.00 +77.00 m
+63.00
+118.00
Figure 1. Longitudinal view of the long span suspension bridge.
2 Conceptual aspects for the definition of the structural behavior in the analysis framework The complexity of the structure considered is very high. In fact, it is possible that secondary effects arise to jeopardize the design. The development of these mechanisms must be identified by robust modeling. The inherent complexity in planning and designing modern exceptional structures leads to the necessity of a new design philosophy in the framework of the so-called Performance-Based Design (PBD) [2;5]. The definition of the structural behavior in the analysis framework for a complex structure needs to consider the nonlinearities and the uncertainties, and also to control the interactions between them. To this aim, modern structural design has shown a trend to deal with the uncertainties by applying the results of reliability theory, providing a way of quantifying those uncertainties and handling them consistently [3; 4]. In this analysis, analytical tools are employed to predict the behavior of various components of the system: this often involves detailed modeling, evaluation of design alternatives and sensitivity studies. Working in the framework of risk management, it is possible to compare different alternatives with respect to feasibility, cost, safety and other aspects.
3 The decomposition strategy Because of complexity of the system, in order to take into consideration all aspects, it is necessary to perform decomposition. In this manner, with which the problem is hierarchical organized in several levels that can be singularly dealt with. The decomposition can be performed for different aspects: Performance, Structural Organism and Load. Figure 2 shows the Performance breakdown. It is clear that the decomposition is made for several aspects of the whole system, such as design quality, product quality and serviceability. In the flowchart of Figure 3 the whole system is firstly divided into substructures (macro-level), then into components (meso-level), and finally into elements (micro-level). Consequently, it is possible to modify each variable and optimize the structural behavior in order to achieve a specified performance objective [2].
CONCEPTION CONTENTS
UNDERSTANDABILITY
SPECIFICS CONFORMITY
QUALITY
DESIGN QUALITY
FORMAL
REACHED QUALITY
PERCEIVED COMPETITIVE QUALITY
ORGANIZATION PROCESS AND PRODUCT CONFORMITY PRACTICABILITY INTEGRITY EFFICIENCY
QUALITY
PRODUCT QUALITY
CORRECTENESS RELIABILITY MANUTENIBILITY DEMONSTRABILITY
STRESS STATES
FLEXIBILITY
MANMADE LOADS
DEAD LOADS LIVE LOAD THERMAL ACTIONS
GLOBAL STRENGTHENING
ENVIRONMENTAL LOADS
WIND ACTIONS SEISMIC ACTIONS
BRIDGE
MANMADE ACTIONS
STRENGTHENING
EXCEPTIONAL ACTIONS
ENVIRONMENTAL ACTIONS
MAX STRESS
LOCAL STRENGTHENING
FATIGUE STRNGTHENING CONNECTIONS STABILITY
STRUCTURAL RELIABILITY
LONGITUDINAL DISPLACEMENT
GLOBAL DEFORMABILITY
VERTICAL DISPLACEMENT TRANSVERSAL DISPLACEMENT ROTATION
DEFORMABILITY
WARPING BUCKLING
LOCAL DEFORMABILITY
RUNNABILITY
ROTATION WARPING
SHIP INTERACTION DURABILITY
SERVICEABILITY
INSPECTION MANUTENIBILTY MONITORING REPAIRED AESTHETIC
Figure 2. Partial performance decomposition of a complex structure.
4 Modeling robustness and exploration A specific aspect which arises from critical considerations concerns the validation of the solution obtained by modeling process. In fact, the error sources in the finite element analysis are traceable back to several aspects, like the nature of the adopted solution, the errors given by a rough geometric representation, and the errors given by the numerical procedure adopted, among others.
Figure 3. Structural decomposition of a long span suspension bridge [2].
MODELING
CHECK VALUES Reaction Sum [KN]
Solutor #1 (ADINA)
Solutor #2 (ANSYS)
Solutor #3 (SAP2000)
4785430
4994087
4873380
µ
σ
Mean value
St. dev.
4884299 104756
VOTING SYSTEM
(2% µ)
Cable Force [KN] 736355
748675
741115
742048
6213 (0.8% µ)
Vertical Displacement [m]
-2.06
-2.37
-2.18
-2.20
-0.156
30.96
29.78
30.05
30.26
0.618
(7% µ)
First period T [s]
(2% µ)
Figure 4. Validation matrix of the bridge.
In the modeling, specifically in the case of complex structures, one needs a robust formulation, defined as an analysis procedure which gives wide guarantees of convergence to the mechanically correct solution. In this conceptual context, Figure 4 shows the validation matrix of the bridge model. This can be considered as a useful tool in order to validate the obtained results from several codes (i.e. ADINA, ANSYS, and SAP2000). In this figure, as an example there are several check values obtained from several commercial codes that must be compared. By this comparison one can conclude that the representation is sufficiently robust. I / Imax 1.749
I / Imax
1.279
1.477 1.322
1
1.211
1.372 1
0.984
1.089
20 kN/m n r ai 20 kN/m 2 t
n r ai 1t
Highway loads
Railway loads
10 kN/m
Railway loads
10 kN/m
n r ai 1t
n r ai 2t
Highway loads
I : Vertical Displacement (f)
I : Longitudinal Slope (plong)
I / Imax
Structural Decomposition
1.375
1 Limit Surface 0.752
0.746
20 kN/m 10 kN/m
QUALITY
2t
n r ai
QUALITY
n r ai 1t
BRIDGE
Performance Decomposition
1.355
DESIGN QU ALITY
PRODU CT QUALITY
C ONCE PT IO N CONTENTS
FORMAL
Railway loads
I
COMPETITI VE QUALITY
Element
INTE GRITY E FFICIE NCY CORRECTENES S RELIA BI LI TY MANUTENIBILITY DEMONSTRA BI LI TY FLEXI BI LI TY
ST RESS STATES DEAD LOAD S MANMADE LOADS LIVE LOAD
GLOB AL STREN GTHEN ING
f [m]
17,49
plong [%]
2,38
ptransv[%]
10,84
THERMAL ACT IONS ENVIR ONMENTAL LOADS
WIND ACTI ONS SEI SMIC ACT IONS MANMAD E ACT IONS
EXCEPTIONAL ACTI ONS MAX ST RESS
LOCAL STREN GTHEN ING
FATIGUE ST RN GT HEN ING
EN VIRONM ENTAL ACTI ON S
CONNEC TIONS STABILI TY
GLOB AL DEFORMAB ILITY
LONGITUDINAL D ISPLACEMENT VER TICAL D ISPLACEMENT TRANSVERSAL D ISPLACEMENT ROT ATION
D EFORMABILITY
RUNNABILITY
REACHED QUALITY
PERCEI VE D PROCE SS A ND P RODUCT CONFORMI TY
STRE NGTHENIN G
STRUCTURAL RELIABIL ITY
UNDER STANDABILITY
SP ECI FICS CONFORMI TY
ORGANIZATION
PRACTICAB ILITY
WARPING BUCKLING
LOCAL DEFORMAB ILITY
ROT ATION WARPING
SHIP INTERA CTION DURABILITY
SERVICEABILITY
INSPEC TION
MANUTENIBILTY
Highway loads I : Transversal Slope (ptrans)
MONITOR ING REPAIRED
AESTHETIC
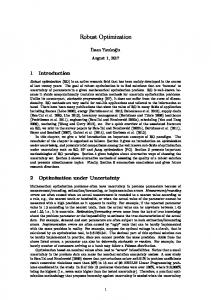
Figure 5. Performance index (I) for some performances.
n itio pos m eco dD a o L
5 Performance assessment and synthesis Starting from the problem decomposition and the modeling of the structure, it is possible to evaluate the performance index (I) for each element. Figure 5 synthesizes the normalized performance index values for vertical displacement, longitudinal slope and transversal slope of bridge deck, with respect to two variables, highway and railway loads. Two levels for each load variable have been considered: for the highway the load intensities considered are 20 kN/m and 10 kN/m; for the railway load one has considered the presence of two and one train on the railway box girder, (each train being 600 m long with a uniform load of 104 kN/m). In Figure 5, the three axes summarize the Performance, Structural and Load Decomposition respectively, with reference to the admissible limit surface. Furthermore, an ideal sketch of the Performance Matrix is also provided. The robust design in the present study has been developed to obtain an optimum value insensitive to variations of design variables within a feasible region. Using this approach, general damage scenarios can be finally considered to assess the effects of failure of various elements on the reliability of undamaged components and on the robustness of the whole complex system. Acknowledgements The financial support of Stretto di Messina S.p.A. and of COFIN2002 is acknowledged. The opinions and conclusions presented is this paper are those of the writers and do not necessarily reflect the views of the sponsoring organizations. References 1. Biondini F., Bontempi F., Malerba P.G. Fuzzy Theory and Genetically-Driven Simulation in the Reliability Assessment of Concrete Structures. Proceedings of 8-th Conference on Probabilistic Mechanics and Structural Reliability. July 2426, Notre Dame, USA 2000. 2. Catallo L., Sgambi L., Silvestri M. General aspects of the structural behavior in the Messina Strait Bridge design. Proceedings of Second International Structural Engineering and Construction Conference (ISEC’02). September 23-26, Rome, Italy 2003. 3. Frangopol D.M. Reliability-based optimum structural design. Probabilistic Structural Mechanics Handbook. Edited by C. (Raj) Sundararajan, Chapman & Hall, New York, 1995, 352-387. 4. Imai K., and Frangopol D.M. Reliability-Based Assessment of Suspension Bridges: Application to the Innoshima Bridge. Journal of Bridge Engineering 2001; November-December: 398-411. 5. Silvestri M., Bontempi F. Strategy and formulation levels of the structural performance analysis of advanced systems. Proceedings of Second International Structural Engineering and Construction Conference (ISEC’02). September 2326, Rome, Italy 2003.