Role of mask pattern in intelligibility of ideal binary-masked noisy speech Ulrik Kjems,a兲 Jesper B. Boldt, and Michael S. Pedersen Oticon A/S, Kongebakken 9, DK-2765 Smørum, Denmark
Thomas Lunner Oticon Research Centre Eriksholm, Kongevejen 243, DK-3070 Snekkersten, Denmark and Department of Clinical and Experimental Medicine, and Technical Audiology, Linköping University, S-58183 Linköping, Sweden
DeLiang Wang Department of Computer Science and Engineering and Center for Cognitive Science, The Ohio State University, Columbus, Ohio 43210
共Received 11 September 2008; revised 9 May 2009; accepted 22 June 2009兲 Intelligibility of ideal binary masked noisy speech was measured on a group of normal hearing individuals across mixture signal to noise ratio 共SNR兲 levels, masker types, and local criteria for forming the binary mask. The binary mask is computed from time-frequency decompositions of target and masker signals using two different schemes: an ideal binary mask computed by thresholding the local SNR within time-frequency units and a target binary mask computed by comparing the local target energy against the long-term average speech spectrum. By depicting intelligibility scores as a function of the difference between mixture SNR and local SNR threshold, alignment of the performance curves is obtained for a large range of mixture SNR levels. Large intelligibility benefits are obtained for both sparse and dense binary masks. When an ideal mask is dense with many ones, the effect of changing mixture SNR level while fixing the mask is significant, whereas for more sparse masks the effect is small or insignificant. © 2009 Acoustical Society of America. 关DOI: 10.1121/1.3179673兴 PACS number共s兲: 43.71.An, 43.71.Gv, 43.66.Ba, 43.66.Dc 关MSS兴 I. INTRODUCTION
The human ability to understand speech in a variety of adverse conditions is remarkable, and the underlying processes are not well understood. According to Bregman’s auditory scene analysis account, the auditory system processes the acoustic input in two stages: an analysis and segmentation stage where the sound is decomposed into distinct timefrequency 共T-F兲 segments followed by a grouping stage 共Bregman, 1990; Wang and Brown, 2006兲. The grouping stage is divided into primitive grouping and schema driven grouping that represent bottom-up and top-down processes, respectively. Hence, in order to recognize speech in background noise, the auditory system would employ a combination of bottom-up processing of available cues, and top-down application of schemas, which represent learned patterns. In this paper these processes are studied using the technique of ideal T-F segregation 共ITFS兲, which was proposed by Brungart et al. 共2006兲 to induce idealized grouping when listening to a mixture of target speech and noise. ITFS is based on the use of ideal binary mask 共IBM兲, which was originally proposed as a benchmark for measuring the segregation performance of computational auditory scene analysis systems 共Wang, 2005兲. The ITFS technique applies an IBM to the mixture, and several recent studies have utilized the
a兲
Author to whom correspondence should be addressed. Electronic mail:
[email protected]
J. Acoust. Soc. Am. 126 共3兲, September 2009
Pages: 1415–1426
technique for revealing important factors for speech intelligibility in noise 共Brungart et al., 2006; Anzalone et al., 2006; Li and Loizou, 2008; Wang et al., 2009兲. A binary mask is defined in the T-F domain as a matrix of binary numbers. We refer to the basic elements of the T-F representation of a signal as T-F units. A frequency decomposition similar to the human ear can be achieved using a bank of gammatone filters 共Patterson et al., 1988兲, and signal energies are computed in time frames 共Wang and Brown, 2006兲. The IBM is defined by comparing the signal-to-noise ratio within each T-F unit against a local criterion 共LC兲 or threshold measured in units of decibels. Only the T-F units with local signal to noise ratio 共SNR兲 exceeding LC are assigned 1 in the binary mask. Let T共t , f兲 and M共t , f兲 denote target and masker signal power measured in decibels, at time t and frequency f, respectively, the IBM is defined as IBM共t, f兲 =
再
1 if T共t, f兲 − M共t, f兲 ⬎ LC, 0 otherwise.
冎
共1兲
An IBM segregated signal can be synthesized from the mixture by deriving a gain from the binary mask, and applying it to the mixture before recombination in a synthesis filter bank. However, not all studies follow the same procedure— sometimes the short-time Fourier transform is used 共for instance Li and Loizou, 2008兲 which typically yields lower frequency resolution at low frequencies, but much higher resolution at high frequencies. In Brungart et al., 2006, the IBM was used as a means to retain the effect of energetic masking, thereby separating the
0001-4966/2009/126共3兲/1415/12/$25.00
© 2009 Acoustical Society of America
1415
energetic masking and informational masking effects. They argued that since the IBM removes those T-F units dominated by the masker, ITFS can be said to retain the effect of energetic masking, while removing informational masking caused by the excluded units with relatively significant masker energy. Informational masking refers to the inability to correctly segregate audible target information from the mixture. Their study showed a plateau of nearly perfect intelligibility of ITFS processed mixtures when varying the value of LC from −12 to 0 dB. Meanwhile, the IBM with 0 dB LC is considered to be the theoretically optimal mask out of all possible binary masks in terms of SNR gain 共Li and Wang, 2009兲. Brungart et al. 共2006兲 noted that lowering the mixture SNR by 1 dB while fixing LC causes the exact same T-F units to be left out as increasing the LC by 1 dB while fixing the mixture SNR; in other words, the IBM remains the same in these two scenarios. They demonstrated remarkably similar performance curves by altering the test conditions in the two ways described, which they interpret as rough equivalence in the effect of energetic masking. Anzalone et al. 共2006兲 showed large intelligibility benefits of IBM segregation and reported positive results on hearing impaired subjects, although their IBM definition is different from the previously outlined ITFS procedure. They computed the IBM by comparing the target signal to a fixed threshold adjusted to retain a certain percentage of the total target energy. Furthermore they attenuated the T-F units designated as non-target by 14 dB, in contrast to the total elimination described above. Their results showed more than 7 dB improvement in speech reception threshold 共SRT兲 for normal hearing and more than 9 dB improvement for hearing impaired subjects. In a study comparing impaired and normal-hearing subjects, Wang et al. 共2009兲 demonstrated large improvements in SRT for both normal-hearing and hearing impaired groups due to ITFS processing of speech mixtures. Their study of the normal-hearing group shows an 11 dB improvement in SRT with a cafeteria noise masker containing conversational speech and an improvement of 7 dB for speech-shaped noise 共SSN兲. For the hearing impaired group, the SRT improvement was 16 dB in cafeteria noise and 9 dB in SSN. As a surprising result, the SRTs obtained from the normal-hearing and hearing impaired groups on the ITFS processed mixtures were comparable. Li and Loizou 共2008兲 used short time Fourier transforms to apply ideal binary masking to mixtures with a two-talker masker, as well as modulated and unmodulated SSN maskers. They found large intelligibility benefits similar to Brungart et al. 共2006兲 when varying the LC parameter, although they reported wider plateaus of LC values with almost perfect intelligibility 共−20 to + 5 dB compared to −12 to 0 dB in Brungart et al., 2006兲, which they attributed to differences in speech material and filterbank setup. They further suggested that it may be the pattern of the binary mask itself that matters for intelligibility, rather than the local SNR of each T-F unit. Wang et al. 共2008兲 demonstrated that applying a binary pattern of gains obtained from an IBM with a SSN masker to the masker signal alone produces high intelligibility scores, a 1416
J. Acoust. Soc. Am., Vol. 126, No. 3, September 2009
type of process related to noise vocoding 共Dudley, 1939; Shannon et al., 1995兲. Using different numbers of filterbank bands, they showed that intelligibility is lost when the number of channels is 8 or smaller, a result which differs from that reported by Shannon et al. 共1995兲 who used continuous, rather than binary, values for envelope manipulation. There, high intelligibility was reported using noise vocoded in just four channels. A. Motivation
The large benefits in intelligibility outlined previously could make the IBM a candidate for applications such as hearing aids, provided that the IBM can be approximated sufficiently well. In this paper we will not consider how such estimation might be done. However, to devise such applications it is important to understand the mechanisms by which the IBM enhances intelligibility. In the above described literature, much attention has been given to explaining intelligibility of IBM segregated mixtures by considering audibility of the target signal. By focusing on absolute regions of LC 共Brungart et al., 2006兲, emphasis is put on the interpretation that the IBM reduces informational masking by directing listeners’ attention to the T-F units containing target information 共Li and Loizou, 2008兲. This view is basically related to models of intelligibility based on target audibility in additive noise, such as the speech intelligibility index 共ANSI, 1997兲, where intelligibility is described as a function of the proportion of target signal that is audible in different frequency bands. Cooke 共2006兲 and Srinivasan and Wang 共2008兲 proposed related computational models that operate on mixture input directly and produce recognition results from automatic speech recognition that are compatible with human intelligibility performance. However, some of the previous published results seem inconsistent with this view. In particular, the observation of Wang et al. 共2008兲 that IBM-processed noise is intelligible suggests that the resulting temporal envelope of the processed mixture is important. The speech transmission index 共Houtgast and Steeneken, 1971兲 considers how distortions to the envelope affect speech intelligibility. Recent extensions have been made to improve the model predictions of nonlinearly processed speech 共Goldsworthy and Greenberg, 2004兲. While the speech intelligibility index model cannot explain the noise gating results of Wang et al. 共2008兲, a model based on speech transmission index described by Goldsworthy and Greenberg 共2004兲 may perform better. This means that the target modulation carried by the IBM may play a key role in intelligibility of processed mixtures. Based on the observation that the IBM is insensitive to the covariation of LC and mixture SNR, we propose to focus on the difference between the LC and the mixture SNR levels when comparing performance across mixture SNR levels. We therefore introduce a relative criterion 共RC兲, defined as RC= LC− SNR in units of decibels. By focusing on RC and varying the mixture SNR, it is possible to vary the effects of the target component of the IBM processed mixture relative to that of the masker. For example, by taking the mixture SNR to a large negative Kjems et al.: Pattern role in ideally segregated speech
Target
Mixture
7500
7500
5000
5000
2500
2500
Center frequency [Hz]
75dB
50dB
1000
1000
500
500
250
250
100
25dB
100 0
0.5
1
1.5
2
0
0.5
Center frequency [Hz]
Target binary mask
1
1.5
2
1.5
2
0dB
Ideal binary mask
7500
7500
5000
5000
2500
2500
1000
1000
500
500
250
250
100
100 0
0.5
1 Time [s]
1.5
2
0
0.5
1 Time [s]
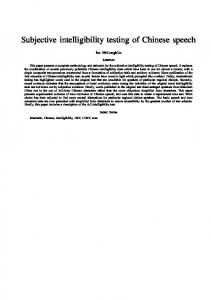
FIG. 1. 共Color online兲 Illustration of IBM and TBM. Upper row shows waveform signal for a clean target sentence 共left兲 and the sentence corrupted with cafeteria noise 共right兲. Middle row shows the cochleagram representation of the two signals. Bottom left and right show the TBM and IBM, respectively, with white indicating the value of 1.
value, we can measure intelligibility of IBM-gated noise similar to Wang et al. 共2008兲. On the other hand, by taking the mixture SNR to a level near the SRT we may measure how processing with the exact same binary mask affects intelligibility near the SRT. B. Aims of the experiments
The change in focus from LC to RC brings up several research questions, which we will address in this paper. One aim is to investigate how the range of RC for optimal intelligibility depends on mixture SNR. Are there regions of RC where mixture SNR level has little or no effect on intelligibility? This question is directly addressed by the experiments in this paper. If under some circumstances mixture SNR level plays a minor role, the masker signal type may play a major role. So the second aim is to investigate the effects of masker type. We know that the plateau of optimal LC values is narrower for same-talker speech maskers 共Brungart et al., 2006兲 compared to a SSN masker. So far, intelligibility of IBM-processed noise has only been reported for stationary noise 共Wang et al., 2008兲. J. Acoust. Soc. Am., Vol. 126, No. 3, September 2009
Third, we wanted to compare the effects of alternative ideal mask definitions. The mask used by Anzalone et al. 共2006兲 was computed based on the target signal alone; yet large intelligibility improvements were obtained. They define the target binary mask 共TBM兲 as the one obtained by comparing, in each T-F unit, the target energy to that of a SSN reference signal matching the long-term spectrum of the target speaker. This comparison still uses the LC parameter as a SNR threshold. The binary mask that results from this process can then be applied to a mixture of the target and a different masker. Figure 1 illustrates an example TBM and IBM computed from a target sentence in cafeteria noise, and shows the differences between the resulting masks. The top row shows the time domain waveforms of the clean and noisy target sentences. The middle row shows cochleagrams of the clean and noisy target sentence using a filterbank of 1 ERB 共equivalent rectangular bandwidth兲 wide gammatone filters with center frequencies from 55 Hz to 7.7 kHz. The bottom row shows the TBM 共left兲 and IBM 共right兲. The two masks are noticeably different. The TBM pattern resembles the target sentence and is unaffected by the specific masker. Kjems et al.: Pattern role in ideally segregated speech
1417
On the other hand, the IBM pattern depends on the masker signal as well. The TBM has several useful properties. The mask is, by this definition, identical to the IBM when SSN is the masker, so the TBM can be used as a measure of how general the IBM generated with the SSN masker is. Furthermore, relating to schema-based auditory scene analysis, the TBM could be interpreted as a simplified template of a learned pattern, indicating where in time and frequency to expect target energy. We therefore expect that the TBM leads to comparable benefits in intelligibility compared to the IBM. In some speech enhancement applications, it may be easier to estimate a TBM rather than an IBM, and it is therefore useful to know the extent to which the TBM results in intelligibility improvements. The remainder of this paper is organized as follows. A listening experiment is described in Sec. II, and the results are reported and discussed in Sec. III. Section IV concludes the paper.
TABLE I. Seven combinations of masker type and mask type. Note that TBM and IBM with SSN masker are identical. Speech shaped noise IBM TBM
1
Cafeteria noise
Car interior
Bottling noise
2 5
3 6
4 7
A listening experiment was conducted to measure speech intelligibility of ITFS processed mixtures. The aim was to measure the influence of mixture SNR level, RC value, masker type, and to compare mask construction schemes: IBM and TBM.
long-term average spectrum. The car interior noise was a recording during highway driving and was chosen to represent a quasi-stationary noise with strong low-frequency content. The fourth noise used was a recording of bottles rattling on a conveyor belt in a bottling hall 共Vestergaard, 1998兲, and was chosen to represent a signal with strong high-frequency content. All stimuli were diotically presented through headphones. For each masker type, three mixture SNR levels were selected along with eight values of RC. Given that the IBM and the TBM are identical with the SSN masker, there were seven combinations of masker type and mask type, as shown in Table I. Mixture SNR levels were set to match measured 20% and 50% SRTs for each masker type. The third SNR level was fixed at −60 dB to create IBM-gated noise similar to Wang et al. 共2008兲.
A. Stimuli
B. Sessions
The target phrases were from the Dantale II corpus 共Wagener et al., 2003兲 which is the Danish version of the Swedish Hagerman sentence 共Hagerman, 1982兲 test and the German Oldenburg sentence test 共Kollmeier and Wesselkamp, 1997兲. The corpus consists of 150 sentences designed to have low redundancy. The phrases were all spoken by the same female Danish speaker. The sentences were five words long following the same grammatical structure: nameverb-numeral-adjective-noun. An English translated example is “Michael had five new plants.” Each word was randomly selected out of ten possibilities in each position of a sentence, taking coarticulation into account 共Wagener et al., 2003兲. Since long-term spectral characteristics are quite similar among different languages 共Byrne et al., 1994兲, the main observations of the present experiment could hold for English and other languages, though there are likely some language effects. The target sentences were presented in nine second intervals, allowing the subjects time to repeat the words they recognize as well as guess. An operator recorded the number of correctly recognized words for each sentence. Four masker signals were used: SSN, cafeteria noise, car interior noise, and noise from a bottling hall. We use the SSN included with the Dantale II corpus, which is produced by superimposing the speech material in the corpus. The cafeteria masker was a recording of an uninterrupted conversation between a male and a female Danish speaker in a cafeteria background 共Vestergaard, 1998兲. The signal was equalized to match the long-term spectrum of the target sentences. This was done to isolate the effects of masker modulation and
The experiment was divided into two sessions. In Session I, the slope and SRT of each subject’s psychometric curve of the unprocessed mixtures and each of the four maskers were measured using the adaptive Dantale II procedure, and the mixture SNR levels for 20% and 80% correct word identification were derived 共Brand and Kollmeier, 2002; Wagener et al., 2003兲. In Session II, intelligibility was measured on a grid of three different mixture SNR levels and eight different RC values 共including an “unprocessed” condition, see later兲 for each of the seven conditions in Table I. This generated a total of 3 SNR levels, 8 RC values, and 7 conditions of Table I, resulting in 3 ⫻ 8 ⫻ 7 = 168 points, where intelligibility was measured. Each combination was tested on each subject using two sentences. Hence, each subject listened to a total of 2 ⫻ 168= 336 sentences, which required reuse of sentences. To prevent memorization, order of the sentences was balanced as much as possible within and across subjects, and appeared random to the subjects. From Session I measurements, logistic functions
II. EXPERIMENTAL SETUP
1418
J. Acoust. Soc. Am., Vol. 126, No. 3, September 2009
P共SNR兲 = 共1 + exp共4s50共L50 − SNR兲兲兲−1
共2兲
were fitted by means of the maximum likelihood method, assuming a binomial distribution of individual sentence scores 共Brand and Kollmeier, 2002兲 yielding the 50% SRT 共L50兲 and slope 共s50兲 parameters for each subject and each masker type. The two initial sentences of each adaptation were discarded, and to reduce the effects of outliers, the data from the three best and three worst performing subjects were left out before averaging in order to derive the 20% and 50% SRT values. Pilot experiments revealed an effect of a princiKjems et al.: Pattern role in ideally segregated speech
TABLE II. SRT at 50% correct L50 and slope s50 parameters of the logistic function, Eq. 共2兲, estimated from Session I measurements, using maximum likelihood with correction for gated noise 共see text, Sec. II B兲. The next column shows the derived 20% SRT for average subject performance. The last two columns show the upper and lower RC values for the four masker types. Offline simulations were used to determine the RC values for obtaining IBM sparseness of 1.5% and 80% ones in the mask. The three TBM conditions 5–7 of Table I all used RC values corresponding to IBM/SSN with mixture SNR corresponding to masker type.
Masker type Speech shaped noise Cafeteria Car interior Bottling noise
50% SRT mixture SNR 共L50兲 共dB兲
Slope at SRT 共s50兲 共%/dB兲
20% SRT mixture SNR 共dB兲
RC for 1.5% ones in mask 共dB兲
RC for 80% ones in mask 共dB兲
−7.3 −8.8 −20.3 −12.2
15.1 7.5 12.7 5.7
−9.8 −13.8 −23.0 −18.4
12.7 24.6 27.5 23.1
−30.3 −27.4 −25.2 −34.9
pal difference between the continuous masker used in Session I, and the binary gated masker used with the ITFS signals in Session II. The effect caused a slightly decreased performance in the latter case. This effect has previously been described by Wagener 共2003, Chap. 5兲 where a comparison of continuous versus gated noise indicated a 1.4 dB increase in SRT 共L50兲 and a decrease in slope 共s50兲 from 21% / dB to 18% / dB. Accordingly, we adjusted the measured SRT from Session I by adding 1.4 dB and slope by multiplying 18/ 21, resulting in the values listed in the first two columns of Table II. The third column shows 20% SRT derived from the adjusted parameters. The measured SRTs and slopes for speech-shaped and cafeteria noise all agree with previous results on the same material 共Wagener, 2003; Wang et al., 2009兲. In order to determine the range of RC values to use, offline simulations were carried out to identify the RC values that yielded mask densities of 1.5% and 80% measured as percent ones in the mask within speech intervals 共see Sec. II D for signal processing details兲. For each masker type seven RC values were then identified by equidistant sampling 共in decibels兲 between these two points. For the three TBM conditions, the set of RC values equaled the set for IBM/SSN 共condition 1 in Table I兲 since the binary masks are identical by definition. An eighth additional unprocessed condition was added, where the mask was set to 1 in all frequency bands within the speech intervals, and 0 outside these intervals, creating essentially a gated masker. Speech intervals were derived from the target sentences alone and were used for all mixture SNR computations by averaging target and masker energy within speech intervals only. A speech interval was defined by low-pass filtering the absolute target sample values using a first-order IIR low-pass filter with the time constant of 1 ms 共for 20 kHz sample rate the transfer function was H共z兲 = / 共1 − 共1 − 兲z−1兲, = 0.04877兲, thresholding the result at 60 dB below the maximum value, and further designating all non-speech intervals less than 2 s as speech to include inter-word intervals in all sentences. All detected speech onsets were shifted 100 ms backward to account for forward masking effects 共Wang et al., 2009兲. C. Subjects
A total of 15 normal-hearing, native Danish speaking subjects participated in the experiment. The subjects volunJ. Acoust. Soc. Am., Vol. 126, No. 3, September 2009
teered for the experiment and were not paid for their participation. Their age ranged from 25 to 52 with a mean age of 35. The audiograms of all subjects indicated normal hearing with hearing thresholds below 20 dB HL in the measured range of 250 Hz– 8 kHz.
D. Signal processing
All target and masker signals were resampled from 44.1 to 20 kHz sampling rate. Gain factors for target and masker were computed in order to achieve a given mixture SNR and fixed mixture power. This was done by computing the signal energies of target and masker within the speech intervals previously defined. The target and masker signals were processed separately by means of a gammatone filterbank, consisting of 64 channels of 2048-tap FIR filters; each channel has the bandwidth of 1 ERB and channel center frequencies range from 2 to 33 ERBs 共corresponding to 55– 7743 Hz兲 linearly distributed on the ERB-rate scale 共Patterson et al., 1988; see also Wang and Brown, 2006兲. The filterbank response was divided into 20 ms frames with 10 ms overlap, and the total signal energy was computed within each T-F unit. For IBM processing, a binary mask was formed by comparing the local SNR within a T-F unit against LC, assigning 1 if the local SNR was greater than LC and 0 otherwise. For TBM processing, the reference masker 共i.e. the SSN masker兲 was processed through the filterbank, with a gain set to achieve a 0 dB mixture SNR. The TBM was formed by comparing the local SNR within a T-F unit using the reference masker against the RC threshold, assigning 1 if the local SNR was greater than RC. The binary mask signal was then upsampled to the full 20 kHz sampling rate by means of a sample-hold scheme followed by low-pass FIR filtering using a 10 ms Hanning filter. In each band, the target-masker mixture was delayed 20 ms in time, accounting for the total delay from the T-F unit energy summation, sample-hold, and low-pass filtering, before the upsampled mask was multiplied with the mixture. Finally, the ITFS processed waveform was synthesized using time reversed gammatone filters. The target and masker stimuli for Session I were processed through the filterbank analysis and synthesis proceKjems et al.: Pattern role in ideally segregated speech
1419
dure 共no binary mask was applied兲, reducing the signal bandwidth to 55 Hz– 7.74 kHz in order to match processed signals in Session II.
IBM using SSN masker 100 90 80 70
1. Session I: SRT and slope measurements
The first session consisted of an adaptive Dantale procedure for each of the four masker types. Prior to this the subjects were given a short training session consisting of 30 randomly chosen sentences using speech-shaped and cafeteria noise maskers. These maskers were chosen to let listeners familiarize themselves with the task under stationary and non-stationary noise conditions. In the adaptive Dantale procedure, the mixture SNR was varied after each sentence according to the number of correctly identified words, and the 20% and 80% SRTs were tracked in an interleaved manner 共Brand and Kollmeier, 2002兲. The 20% and 80% points were chosen since they were proposed by Brand and Kollmeier 共2002兲 to be optimal for the simultaneous measurement of the logistic function parameters L50 and s50 of Eq. 共2兲. A total of 30 sentences were presented for each masker type in the adaptive procedure. To account for learning effects, the order of masker types was balanced across subjects 共Beck and Zacharov, 2006兲. 2. Session II: ITFS mixtures
In the second session, each subject listened to 336 offline computed ITFS sentences. The stimuli alone lasted approximately 51 min so the subjects were allowed two breaks in the middle. Prior to the main experiment, subjects were exposed to 60 sentences of training using all four noise types. First, for each masker type ten sentences corresponded to the unprocessed condition with increasingly lower mixture SNRs. The remaining 20 training sentences corresponded to various ITFS conditions, randomly selected but increasing difficulty. We found from pilot experiments that an extended training procedure was required to reduce learning effects and subject variability. Learning and other temporal effects were accounted for by using a balanced design: for each subject the ordering of the seven conditions was changed and for each condition the ordering of SNR levels and RC values were balanced as much as possible. Subjects were seated in a sound treated room where sounds were presented using Sennheiser HD280 Pro headphones connected to a SoundBlaster SB0300 sound card, using a PC running MATLAB. 3. Level of presentation
All mixtures were normalized to have same broadband long-term signal power before ITFS processing, both across mixture SNR and across noise types. The SSN condition was used to calibrate the presentation level to 65 dB共A兲 sound pressure level, and the volume control settings were then held fixed. The calibration was done using a sound level meter coupled to an earpiece of the headphones. The result1420
J. Acoust. Soc. Am., Vol. 126, No. 3, September 2009
% Correct
E. Procedure
60
UN
50 40 30
UN
20
SNR -7.3dB (50%SRT) SNR -9.8dB (20%SRT) SNR -60dB
10 0 -100
-80
-60
-40 LC [dB]
-20
0
FIG. 2. Percentage of correctly identified words for IBM-processed mixtures with SSN masker as function of LC used for generating the IBM. Three mixture SNR levels are shown. The unprocessed conditions do not correspond to a particular LC value, but are inserted to the left of the respective curves, marked as “UN” and connected with dotted lines. Chance performance level is 10%.
ing presentation levels were measured to 62 dB共A兲 for cafeteria noise, 60 dB共A兲 for car interior noise, and 68 dB共A兲 for bottling hall noise. III. RESULTS AND DISCUSSION
Figure 2 shows the percentage of correctly identified words as a function of LC for IBM segregated mixtures with the SSN masker in the three mixture SNR settings, averaged over all subjects. The unprocessed conditions do not correspond to a particular LC value, and are inserted as the leftmost points of the respective curves 共marked as “UN”兲 and connected with dotted lines to the curves. The unprocessed data points resulted in higher performance than expected; across conditions the average scores are 25.7% and 59.5% out of 600 answers, which are larger than the 20% and 50% expected scores. This could be explained by the training that was encountered during Session I and during the training session introduced between Session I and Session II, as described in Sec. II E 2. Each of the three curves shows a plateau or peak of very high intelligibility; for the 50% SRT 共SNR of −7.3 dB兲, the interpolated average performance was above 95% in the interval −25 dB⬍ LC⬍ −2 dB, a 23 dB wide region. For 20% SRT 共SNR of −9.8 dB兲 the interval was −22 dB⬍ LC⬍ −6 dB and 16 dB wide, while for the −60 dB case the interval was −69 dB⬍ LC⬍ −59 dB and 10 dB wide. The results for 20% and 50% SRT have similar profiles as those reported by Brungart et al. 共2006兲 and Li and Loizou 共2008兲. In Brungart et al., 2006, the range is −12 dB⬍ LC⬍ 0 dB using a multi-talker task and similar ITFS processing. The plateaus in the present study are wider than those of Brungart et al. 共2006兲, due to higher scores at lower LC values, while plateau upper bounds are similar. Li and Loizou 共2008兲 reported plateaus from −20 to + 5 dB at −5 dB SNR and −20 to 0 dB at −10 dB SNR using a sentence test with a SSN masker and a T-F representation with linear frequency. The observed differences are probably due to differences in sentence material and mixture SNR. Kjems et al.: Pattern role in ideally segregated speech
IBM using SSN masker REGION III
100
A. Performance versus RC
REGION II
REGION I
** *
90 80
** *
% Correct
70 60
** *
UN
50
***
40 30
UN
** *
** * ** * SNR -7.3dB (50% SRT)
20
SNR -9.8dB (20% SRT) 10
SNR -60dB
0 -40
-30
-20 -10 RC = LC-SNR [dB]
0
10
FIG. 3. Percentage of correctly identified words for IBM-processed mixtures with SSN masker as function of RC= LC− SNR. This figure gives a different plot of the same data in Fig. 3. Asterisks 共 *兲 indicate significant differences between intelligibility scores at adjacent mixture SNR levels, or when placed to the left of a diamond, between the scores at the lowest and highest mixture SNR levels, according to a Tukey HSD test. In the figure, * corresponds to p ⬍ 0.05, ** to p ⬍ 0.01, and *** to p ⬍ 0.001.
The −60 dB SNR curve, however, is different. First of all, since the mask here was applied to essentially pure noise, this is consistent with the results of Wang et al. 共2008兲 who demonstrated that listeners achieve nearly perfect recognition from IBM-gated noise where the mask is obtained from speech and SSN. This process of producing intelligible speech from noise may be viewed as a form of noise gating. Our results extend their findings by showing that the vocoding ability of the IBM applies to a range of LC values. This range is not much smaller than those of the performance plateaus at much higher mixture SNR levels, a finding that has not previously been reported. Secondly, the shape of the −60 dB curve is similar to but narrower than the curves at higher SNR levels, but its position on the LC axis is very much shifted. As pointed out by Brungart et al., 共2006兲, the IBM is insensitive to covariations of LC and mixture SNR. This means that the mask pattern is a function of the difference LC-SNR, which was termed RC in Sec. I A.
Depicting the performance curves versus RC rather than LC brings the curves together, as shown in Fig. 3. Most notably the decline in performance at high RC values seems to be aligned well. Recall that the IBMs for the three SNR levels are equal for a fixed RC regardless of mixture SNR. A two-way analysis of variance 共ANOVA兲 with repeated measures was performed on the rationalized arcsine transformed subject mean percentage scores 共Studebaker, 1985兲. The ANOVA revealed significant effect of mixture SNR, RC, and of interaction terms, as indicated in Table III. To further investigate the interaction effect, a post hoc Tukey HSD test was performed comparing all pairwise differences across SNR. In Fig. 3, asterisks are used to indicate significant pairwise differences, where the significance level is indicated by their number: * indicates p ⬍ 0.05, ** indicates p ⬍ 0.01, and *** indicates p ⬍ 0.001. In this case, all pairwise comparisons that were significant were at the level of p ⬍ 0.001. The significance of the difference between the upper and lower SNR performance is indicated to the left of the corresponding data point of the middle SNR curve 共diamond兲. In Fig. 4, plots similar to Fig. 3 are shown for the remaining conditions tested. The two rows of the plots show IBM and TBM processing, respectively. The three columns correspond to the three remaining masker types: cafeteria, car interior, and bottle noise. As shown in Table III, a twoway ANOVA in all conditions revealed significant effects of mixture SNR, RC, and of interaction terms. The results in Fig. 4 show patterns similar to that of Fig. 3. Tukey HSD tests revealed significant differences across mixture SNR for low RC values just as was the case for the IBM/SSN condition. 1. Interpretation using regions in RC
In a manner similar to Brungart et al. 共2006兲 we divide the performance curves into three distinct regions. The main difference in our analysis is that our regions are defined in terms of RC instead of LC. The purpose is to interpret the intelligibility improvement in terms of RC 共Fig. 3兲, instead of LC 共Fig. 2兲. While the aim of the analysis by Brungart et al. 共2006兲 was to separate effects of informational and energetic masking, our analysis highlights the importance of the binary mask pattern.
TABLE III. Two way ANOVA test results using rationalized arcsine transformed mean subject scores 共Studebaker, 1985兲 revealed significance of effects of mixture SNR, RC, and interaction terms for the measurement data shown in Figs. 3 and 4.
Test statistic IBM/SSN 共Fig. 3兲 IBM/cafeteria IBM/car noise IBM/bottling noise TBM/cafeteria TBM/car noise TBM/bottling noise
Effect of mixture SNR
Effect of RC
Effect of interaction
F共2 , 28兲 136.1, p ⬍ 0.000 01 340.5, p ⬍ 0.000 01 172.4, p ⬍ 0.000 01 173.0, p ⬍ 0.000 01 253.1, p ⬍ 0.000 01 133.1, p ⬍ 0.000 01 234.3, p ⬍ 0.000 01
F共7 , 98兲 153.1, p ⬍ 0.000 01 149.7, p ⬍ 0.000 01 295.5, p ⬍ 0.000 01 126.0, p ⬍ 0.000 01 95.1, p ⬍ 0.000 01 156.8, p ⬍ 0.000 01 146.7, p ⬍ 0.000 01
F共14, 196兲 13.8, p ⬍ 0.000 01 17.4, p ⬍ 0.000 01 12.0, p ⬍ 0.000 01 12.2, p ⬍ 0.000 01 11.8, p ⬍ 0.000 01 12.3, p ⬍ 0.000 01 15.2, p ⬍ 0.000 01
J. Acoust. Soc. Am., Vol. 126, No. 3, September 2009
Kjems et al.: Pattern role in ideally segregated speech
1421
Cafeteria noise 100
** *
90
Car noise
*
**
80
** *
UN
UN
UN
SNR -60dB
SNR -23.0dB 20%SRT SNR -60dB
** *
** *
*
80
*** ** *
UN
40 UN
** *
UN
10 0 -40
-20
0
** *
** *
** ** * *
** * ** *
20
** *** *
UN
** * *
** *
**
UN
TBM Processing
** *
*
60
** *
**
** *
***
70
% Correct
SNR -18.4dB 20%SRT
SNR -60dB
90
30
SNR -12.2dB 50%SRT
** *
SNR -20.3dB 50%SRT
SNR -13.8dB 20%SRT
0 100
50
* *
** *
UN
** *
SNR -8.8dB 50%SRT
10
** * ** *
***
** *
** *
20
***
** *
***
UN
** *
UN
** *
40 30
** *
** *
** *
60
IBM Processing
% Correct
70
50
Bottle noise
**
** *
UN
** *
*** ** *
SNR -8.8dB 50%SRT
SNR -20.3dB 50%SRT
SNR -12.2dB 50%SRT
SNR -13.8dB 20%SRT
SNR -23.0dB 20%SRT
SNR -18.4dB 20%SRT
SNR -60dB
SNR -60dB
20
-40
-20 0 RC = LC-SNR [dB]
SNR -60dB
20
-40
-20
0
20
FIG. 4. Percentage of correctly identified words versus RC for IBM-processed mixtures 共upper row兲 and TBM processed mixtures 共lower row兲. Each column corresponds to a masker type. The three curves in each plot correspond to the mixture SNR levels 共squares: 50% SRT, diamonds: 20% SRT, and triangles: −60 dB mixture SNR兲. Asterisks 共 *兲 indicate significant difference between adjacent mixture SNR levels, or when placed to the left of a diamond, between the lowest and highest mixture SNR levels 共 * corresponds to p ⬍ 0.05, ** to p ⬍ 0.01, and *** to p ⬍ 0.001兲, according to Tukey HSD tests.
Region I corresponds to large RC values, where intelligibility decreases with increasing RC due to increasing sparseness of the ideal mask. In our results from the IBM/ SSN condition, performance decreased for RC⬎ −2 dB. Region II corresponds to an intermediate range of RC values, with nearly perfect performance. For the IBM/SSN condition this occurred as a plateau at RC values between −8.8 and −1.6 dB, where intelligibility was above 95%. Region III ranges below approximately RC= −10 dB in the IBM/SSN case. In this region performance decreases as RC decreases and the number of T-F units included in the IBM increases, until the performance of the unprocessed mixture is reached. A general pattern in our data is that the influence of mixture SNR on the recognition performance decreases with increasing RC: In Regions I and II the effect was small or insignificant, while in Region III there was significant influence. The fact that the performance in Region I 共high RC values兲 showed only a negligible or small effect of mixture SNR level suggests that the target component of the processed mixture plays a relatively small role. Our results seem to indicate that some of the traditional cues for speech perception, such as F0, periodicity, and other temporal fine structure cues, are less important in Region II than in Region III and 1422
J. Acoust. Soc. Am., Vol. 126, No. 3, September 2009
of even smaller importance in Region I. Otherwise one would have expected a difference in performance across mixture SNRs. So the application of the IBM seems, on the one hand, to improve the intelligibility relative to the unprocessed condition and, on the other hand, to reduce or eliminate the listener’s ability to make use of speech cues other than what is carried in the binary mask. This result is of particular interest for the design of hearing aids, since reports suggest that the ability of hearing impaired subjects to make use of temporal fine structure cues is limited compared to normal listeners 共Lorenzi et al. 2006; Hopkins et al. 2008兲, making the trade-off more favorable for the hearing impaired. In Region III, there was an overall significant effect of mixture SNR 共indicated with asterisks in Figs. 3 and 4兲. We further note that across all seven mask scheme/masker conditions, the increase in performance at the mixture SNR corresponding to 20% SRT from Region III to Region II is accompanied by an increasing vocoding ability at −60 dB mixture SNR. 2. Influence of masker type
The results in Fig. 4 show that the RC values beneficial to intelligibility varied across the seven mask scheme/masker Kjems et al.: Pattern role in ideally segregated speech
TABLE IV. Measured peak intelligibility score 共in percentage兲 for noise gating data 共at a mixture SNR of −60 dB兲 together with average width 共in RC兲 of performance plateau where the interpolated performance was within 95% of the peak value, for the four masker types and two mask computation schemes. Speech shaped noise IBM TBM
98.7%
23.6 dB
Cafeteria 85.3% 88.0%
20.7 dB 16.9 dB
conditions. While the plateau became narrower at lower mixture SNR levels, its position shifts across the seven conditions tested. As already described, mixture SNR, which factors in the definition of RC, is not a good indicator of intelligibility across masker types. For instance, in the IBM/ bottle noise curve at the mixture SNR corresponding to 50% SRT, the performance plateau—the region of RC values where intelligibility is within 95% of the maximum score— ranged from −22 to − 3 dB 共measured on interpolated mean data兲, while in the IBM/car noise curve the corresponding plateau occurs in the RC range of −4 to 19 dB. Table IV shows the average plateau width for the three mixture SNR levels for each of the seven mask scheme/ masker conditions. The IBM/SSN condition produced the broadest plateau, 23.6 dB on average, and the TBM/cafeteria the narrowest plateau of 16.9 dB. Comparing mask schemes within masker signals, the IBM showed slightly wider average plateaus for all masker types. The table also gives the peak intelligibility scores of various noise gating curves.
B. Discussion of binary noise gating results
The noise gating performance curves 共SNR −60 dB兲 form a performance lower bound for each masker type: in no case was the noise gating performance significantly greater than that for any other mixture SNR level. The measured peak value of the noise gating performance curves varied across masker type and mask computation scheme as indicated in Table IV. The effect of masker type was greater than the effect of mask computation scheme 共from 85.3% for IBM/cafeteria to 99.3% for IBM/car noise兲. The cafeteria noise was a relatively poor signal for vocoding, yielding maximum scores of 85% correct using IBM and 88% using TBMs, a result which may be explained by the sparse energy distribution in retained T-F units: The presence of 1 in the binary mask may coincide with a dip in the noise signal. In our data, the performance in the TBM/ cafeteria condition with the −60 dB SNR was significantly lower at RC= 15 dB than those with higher SNR levels. The modulation dips of the cafeteria masker made the distribution of T-F energy in the processed signal relatively sparse, a likely reason for reduced intelligibility performance. Figure 5 shows the density of the binary mask measured as percentage ones in the mask averaged over all speech intervals 共see Sec. II B兲 as function of channel center frequency for different masker types. The bold lines correspond to the RC value with the highest noise gating intelligibility 共at mixture SNR of −60 dB兲. The figure shows that when the target and masker signal spectra are matched 共speech-shaped J. Acoust. Soc. Am., Vol. 126, No. 3, September 2009
Car interior 99.3% 98.7%
23.0 dB 21.5 dB
Bottling noise 90.0% 95.3%
19.0 dB 18.4 dB
and cafeteria noise兲 the result is a more uniform mask density compared to when the signals are not matched 共bottle noise and car noise兲. It should be noted that, for stationary maskers, the TBM is similar to the IBM with a LC parameter made frequency dependent in such a way that the resulting distribution of mask sparseness resembles that of the TBM 共i.e. IBM with SSN masker兲. Since the TBM in the bottle noise case brings some intelligibility benefits over the IBM, it is possible that speech separation algorithms that estimate the IBM would also benefit from making the LC parameter frequency dependent, to ensure that enough ones are present in frequency bands relevant for speech. C. Results from TBM
In Fig. 6, the results of applying the TBM to mixtures of the four masker types are compared. From left to right the mixture SNR level corresponds to 50% SRT, 20% SRT, and −60 dB. The curves corresponding to the four different maskers appear to align well. This is further reflected in Table V, showing the results from a two-way ANOVA with repeated measures performed on the rationalized arcsine mean subject scores, for each of the three mixture SNR levels. Compared to the previous analysis, the effects are not as strong; in fact, the noise type influence was not above the standard 5% significance level for the 20% SRT data and the interaction term for the 50% SRT data was also not significant. Tukey HSD tests revealed significance in the pairwise differences across masker type only for cafeteria noise in −60 dB SNR against all three other noise types, and only for RC values of −23.1, −15.9, and −8.7 dB as indicated with asterisks in Fig. 6. D. Performance versus mask density
Given the importance of mask density for resulting intelligibility, the performance scores versus resulting overall mask density are plotted in Fig. 7. The mask density was measured as resulting percentage of ones in all frequency bands within speech intervals. The unprocessed condition is indicated as having 100% ones in the mask. The IBM results are connected with solid lines, and the TBM results are connected with dashed lines. Note that a nonlinear abscissa is used to better illustrate the performance differences at low percentages. All curves show maximum performance between 15% and 60% ones in the masks. The curves all show a sharp decline toward zero at low percentages, a plateau in the middle which is wider for higher mixture SNRs and a gradual drop to the level of unprocessed mixtures, from 40% Kjems et al.: Pattern role in ideally segregated speech
1423
IBM/SSN and TBM
IBM/Cafe
100
100 RC -30dB
Mask density in percent
80
RC -27dB
80
-23dB
60
-16dB
-19dB
60 -10dB
40
40 -9dB -1dB
20
0
20 -2dB + 6dB +13dB 2
3
10
4
10 Frequency - Hz
+ 7dB
0
10
+16dB +25dB 2
3
10
IBM/Bottle noise
10
IBM/Car
100
100 RC -35dB
80
Mask density in percent
4
10 Frequency - Hz
RC -25dB -16dB -8dB
80
+ 1dB
-25dB
60
60
40
-16dB
+10dB
40 +19dB
20
20 -6dB
0
+ 4dB +13dB
+23dB 2
3
10
4
10 Frequency - Hz
+28dB
0
10
2
3
10
4
10 Frequency - Hz
10
FIG. 5. Mask density 共in percentage of mask value 1兲 as function of channel center frequency averaged over entire sentence material. The corresponding RC value used for computing the mask is indicated to the right of each curve. The bold line corresponds to the RC value with the highest intelligibility for IBM-gated noise 共at mixture SNR of −60 dB兲. The mask densities of the TBM masks equals that of the IBM/SSN by definition.
to 100% ones in mask. The TBM and IBM curves are generally similar, with slightly larger scores for the target binary mask except for the cafeteria masker at high percentage of ones. Below 5%–10% ones, the TBM scores were higher than for the IBM for all masker types. For the exceptional case of the cafeteria noise, the IBM strategy based on mixture SNR was apparently better than the TBM scheme acTBM performance for SNR 50%SRT
cording to the target energy. Overall, it is rather remarkable how well the TBM and IBM results are aligned, considering their differences with respect to RC in Fig. 4. IV. CONCLUSION
By measuring intelligibility of ideal binary-masked noisy speech, we have shown that intelligibility performance
TBM performance for 20%SRT
TBM performance for -60dB mixture SNR
100 90 80
** *
% Correct
70 60 UN 50
** *
40 30 UN
SSN Cafe Car Bottle
20 10 0 -40
-30
-20
-10
0
10
-40
-30
-20 -10 RC [dB]
** *
0
10
-40
-30
-20
-10
0
10
FIG. 6. Percentage of correctly identified words versus RC for TBM processed mixtures comparing the effect of noise types. Note that all curves use the same mask for a given RC. The three plots correspond to the three mixture SNR levels. The individual curves correspond to masker types. Asterisks 共 *兲 indicate significant difference between adjacent noise types 共 * corresponds to p ⬍ 0.05, ** to p ⬍ 0.01, and *** to p ⬍ 0.001兲, according to a Tukey HSD test. 1424
J. Acoust. Soc. Am., Vol. 126, No. 3, September 2009
Kjems et al.: Pattern role in ideally segregated speech
TABLE V. Two way ANOVA test was performed on rationalized arcsine transformed mean subject scores revealing significance of effects of noise type, RC, and interaction terms for the measurement data shown in Fig. 6.
Test statistic 50% SRT data 20% SRT data −60 dB SNR data
Effect of noise type
Effect of RC
Effect of interaction
F共3 , 42兲 3.80, p ⬍ 0.017 2.78, p ⬍ 0.053 87.9, p ⬍ 0.000 01
F共7 , 98兲 92.3, p ⬍ 0.000 01 147.4, p ⬍ 0.000 01 297.1, p ⬍ 0.000 01
F共21, 294兲 1.54, p ⬍ 0.063 2.25, p ⬍ 0.001 7 6.19, p ⬍ 0.000 01
curves became aligned across a large range of mixture SNR levels when using the RC defined as the difference of LC and SNR. This alignment was demonstrated for four masker types, using the IBM as well as the proposed TBM. By fixing RC and varying the mixture SNR level, we identified three regions in RC, differentiated by intelligibility and influence of the mixture SNR level. In Regions I and II, weak or insignificant influence was found, whereas in Region III the influence was large and significant. The size and location of the regions varied with masker type.
By applying IBM processing to mixtures of low negative SNR levels, we have extended the findings of Wang et al. 共2008兲 showing that the processing acts as binary noise gating and produces intelligible speech at a range of sparseness configurations parametrized by RC. We further showed that the proposed TBM based on the target signal alone was comparable to the IBM in terms of intelligibility improvements. For a given level of mask sparseness, the mean measured TBM intelligibility scores were even slightly higher than those of the IBM in some conditions.
Percent words correct
SSN
Cafe
100
100
80
80
60
60
40
40 IBM/SNR -8.8dB TBM/SNR -8.8dB
20
20
TBM/SNR -13.8dB
IBM/SNR -9.8dB
IBM/SNR -60.0dB
IBM/SNR -60.0dB
0 1 2
5
10
IBM/SNR -13.8dB
IBM/SNR -7.3dB
20
40
TBM/SNR -60.0dB
0 60
80
100
1 2
5
10
Percent words correct
Car 100
80
80
60
60
40
40 IBM/SNR -20.3dB
10
100
20 40 60 Percent ones in mask
80
100
IBM/SNR -18.4dB
TBM/SNR -23.0dB
TBM/SNR -18.4dB
IBM/SNR -60.0dB
IBM/SNR -60.0dB
TBM/SNR -60.0dB
5
80
TBM/SNR -12.2dB
20
IBM/SNR -23.0dB
1 2
60
IBM/SNR -12.2dB
TBM/SNR -20.3dB
0
40
Bottle noise
100
20
20
20 40 60 Percent ones in mask
TBM/SNR -60.0dB
0 80
100
1 2
5
10
FIG. 7. Percentage of correctly identified words as function of mask density. The four plots show the four masker types: SSN, cafeteria, car noise, and bottle noise. Each plot corresponds and the three mixture SNR levels and the two mask computation schemes. The IBM results are connected with solid lines, and the TBM results with dotted lines. The unprocessed condition is marked as 100% ones in mask. J. Acoust. Soc. Am., Vol. 126, No. 3, September 2009
Kjems et al.: Pattern role in ideally segregated speech
1425
ACKNOWLEDGMENTS
The authors would like to thank Tayyib Arshad for assistance in performing the experiments, volunteering subjects for participating, and colleagues for discussions and proofreading. The research of D.W. was supported in part by an AFOSR grant 共FA9550-08-1-0155兲 and a NSF grant 共IIS0534707兲. ANSI S3.5-1997 共1997兲. “American National Standard: Methods for the calculation of the speech intelligibility index” 共American National Standards Institute, New York兲. Anzalone, M. C., Calandruccio, L., Doherty, K. A., and Carney, L. H. 共2006兲. “Determination of the potential benefit of time-frequency gain manipulation,” Ear Hear. 27, 480–492. Beck, S., and Zacharov, N. 共2006兲. Perceptual Audio Evaluation: Theory, Method and Application 共Wiley, Chichester, UK兲. Brand, T., and Kollmeier, B. 共2002兲. “Efficient adaptive procedures for threshold and concurrent slope estimates for psychophysics and speech intelligibility tests,” J. Acoust. Soc. Am. 111, 2801–2810. Bregman, A. S. 共1990兲. Auditory Scene Analysis 共MIT, Cambridge MA兲. Brungart, D., Chang, P. S., Simpson, B. D., and Wang, D. L. 共2006兲. “Isolating the energetic component of speech-on-speech masking with ideal time-frequency segregation,” J. Acoust. Soc. Am. 120, 4007–4018. Byrne, D., Dillon, H., and Tran, K. 共1994兲. “An international comparison of long-term average speech spectra,” J. Acoust. Soc. Am. 96, 2108–2120. Cooke, M. 共2006兲. “A glimpsing model of speech perception in noise,” J. Acoust. Soc. Am. 119, 1562–1573. Dudley, H. 共1939兲. “Remaking speech,” J. Acoust. Soc. Am. 11, 169–177. Goldsworthy, R. L., and Greenberg, J. E. 共2004兲. “Analysis of speech-based speech transmission index methods with implications for nonlinear operations,” J. Acoust. Soc. Am. 116, 3679–3689. Hagerman, B. 共1982兲. “Sentences for testing speech intelligibility in noise,” Scand. Audiol. 11, 79–87. Hopkins, K., Moore, B. C. J., and Stone, M. A. 共2008兲. “Effects of moderate cochlear hearing loss on the ability to benefit from temporal fine structure information in speech,” J. Acoust. Soc. Am. 123, 1140–1153. Houtgast, T., and Steeneken, H. J. M. 共1971兲. “Evaluation of speech transmission channels by using artificial signals,” Acustica 25, 355–367. Kollmeier, B., and Wesselkamp, M. 共1997兲. “Development and evaluation
1426
J. Acoust. Soc. Am., Vol. 126, No. 3, September 2009
of a German sentence test for objective and subjective speech intelligibility assessment,” J. Acoust. Soc. Am. 102, 2412–2421. Li, N., and Loizou, P. C. 共2008兲. “Factors influencing intelligibility of ideal binary-masked speech: Implications for noise reduction,” J. Acoust. Soc. Am. 123, 1673–1682. Li, Y., and Wang, D. L. 共2009兲. “On the optimality of ideal binary timefrequency masks,” Speech Commun. 51, 230–239. Lorenzi, C., Gilbert, G., Carn, H., Garnier, S., and Moore, B. 共2006兲. “Speech perception problems of the hearing impaired reflect inability to use temporal fine structure,” Proc. Natl. Acad. Sci. U.S.A. 103, 18866– 18869. Patterson, R. D., Nimmo-Smith, I., Holdsworth, J., and Rice, P. 共1988兲. “An efficient auditory filterbank based on the gammatone function,” Report No. 2341, MRC Applied Psychology Unit, Cambridge. Shannon, R. V., Zeng, F.-G., Kamath, V., Wygonski, J., and Ekelid, M. 共1995兲. “Speech recognition with primarily temporal cues,” Science 270, 303–304. Srinivasan, S., and Wang, D. L. 共2008兲. “A model for multitalker speech perception,” J. Acoust. Soc. Am. 124, 3213–3224. Studebaker, G. A. 共1985兲. “A ‘rationalized’ arcsine transform,” J. Speech Hear. Res. 28, 455–462. Vestergaard, M. 共1998兲. “The Eriksholm CD 01: Speech signals in various acoustical environments,” Report No. 050-08-01, Oticon Research Centre Eriksholm, Snekkersten. Wagener, K. 共2003兲. “Factors Influencing Sentence Intelligibility in Noise,” Ph.D. thesis, Oldenburg University, Oldenburg, Germany. Wagener, K., Josvassen, J. L., and Ardenkjær, R. 共2003兲. “Design, optimization and evaluation of a Danish sentence test in noise,” Int. J. Audiol. 42, 10–17. Wang, D. L. 共2005兲. “On ideal binary mask as the computational goal of auditory scene analysis,” in Speech Separation by Humans and Machines, edited by P. Divenyi 共Kluwer Academic, Norwell, MA兲, pp. 181–197. Wang, D. L., and Brown, G. J. 共2006兲. Computational Auditory Scene Analysis: Principles, Algorithms, and Applications 共Wiley, Hoboken NJ兲. Wang, D. L., Kjems, U., Pedersen, M. S., Boldt, J. B., and Lunner, T. 共2008兲. “Speech perception of noise with binary gains,” J. Acoust. Soc. Am. 124, 2303–2307. Wang, D. L., Kjems, U., Pedersen, M. S., Boldt, J. B., and Lunner, T. 共2009兲. “Speech intelligibility in background noise with ideal binary timefrequency masking,” J. Acoust. Soc. Am. 125, 2336–2347.
Kjems et al.: Pattern role in ideally segregated speech