Apr 1, 2015 - sources to examine TBI-related deaths, hospitaliza- tions, and ... of death was identified as an injury and the primary .... Published June 2014.
Running the Numbers A Periodic Feature to Inform North Carolina Health Care Professionals About Current Topics in Health Statistics
Traumatic Brain Injuries in North Carolina Traumatic brain injury (TBI) is often referred to as a “silent epidemic” because, although it is a major cause of death and disability, many of the signs, symptoms, and sequelae of TBI—such as memory loss or changes in language and emotion—are not easily recognized [1]. TBIs vary in severity, from mild injuries that require minimal medical attention to severe injuries that may cause lifelong disability or death [2]. Both nationally and in North Carolina, TBI is a contributing factor to more than 30% of all injury deaths [1, 3]. Having population-based data regarding fatal and nonfatal TBIs among North Carolina residents is important both for understanding the overall burden of these injuries in the state and for identifying potential risk factors.
Methods This analysis used data from 3 statewide data sources to examine TBI-related deaths, hospitalizations, and emergency department (ED) admissions among North Carolina residents in 2012. Death certificate data for 2012 were obtained from the North Carolina State Center for Health Statistics (SCHS). We only included events in which the primary cause of death was identified as an injury and the primary or underlying cause(s) of death was identified as TBI-related using the International Classification of Diseases, 10th Revision (ICD-10) codes [4]. Hospital discharge data for every hospital discharge of a North Carolina resident in 2012 were also obtained from the SCHS. TBI-related hospital discharges were identified using the International Classification of Diseases, 9th Revision, Clinical Modification (ICD-9-CM) external cause of injury codes [4]. ED admissions for 2012 were obtained from the North Carolina Disease Event Tracking and Epidemiologic Collection Tool (NC DETECT). NC DETECT receives data on a daily basis from hospital-affiliated EDs statewide. As of 2014, there were 123 North Carolina hospital-affiliated EDs
that submitted data on a daily basis to NC DETECT, as well as 4 Veterans Affairs medical center–affiliated EDs. TBI-related ED admissions were identified using ICD-9-CM external cause of injury codes [4]. Specific causes of TBI-related deaths, hospitalizations, and ED visits were identified using ICD-10 and ICD-9-CM codes. Counts and rates of TBIrelated deaths, hospitalizations, and ED visits per 100,000 North Carolina residents were calculated by age, sex, and cause. Rates by sex and cause were age-adjusted.
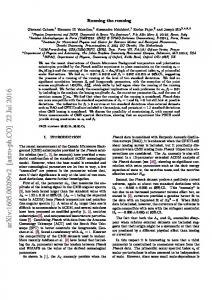
Results Burden of TBI in North Carolina The overall burden of TBI among North Carolina residents in 2012 is presented in an “injury iceberg” diagram (see Figure 1). This figure illustrates the fact that deaths represent only the tip of the iceberg
figure 1.
Injury Iceberg for Traumatic Brain Injury (TBI), North Carolina Residents, 2012 1,871 Deaths
6,249 Hospitalizations 68,588 Emergency department admissions ? Outpatient visits ? Medically unattended TBIs (Home, Work, School)
Electronically published April 1, 2015. Address correspondence to Mr. Scott Proescholdbell, 5505 Six Forks Rd, Raleigh, NC 27609 (scott.proescholdbell @dhhs.nc.gov). N C Med J. 2015;76(2):119-122. ©2015 by the North Carolina Institute of Medicine and The Duke Endowment. All rights reserved. 0029-2259/2015/76215
NCMJ vol. 76, no. 2 ncmedicaljournal.com
119
with regard to the burden of TBI in North Carolina. In 2012, for every 1 TBI-related death, there were more than 3 TBI-related hospitalizations and 36 TBI-related ED visits among North Carolinians. These data do not reflect the number of individuals who sought outpatient care or did not seek medical attention in the event of a TBI, which is likely much higher than the number of TBI-related ED visits. Unfortunately, surveillance data are not available for these events.
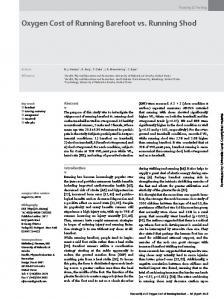
Leading Causes of TBI-related Deaths, Hospitalizations, and ED Admissions Overall, TBI-related deaths, hospitalizations, and ED admissions in 2012 were more common among males than females. In 2012, the leading causes of fatal and nonfatal TBIs in North Carolina were firearms, motor vehicle traffic crashes, and unintentional falls; among these causes, there were differing trends by age and sex. The leading cause of TBI-related death among North Carolina residents in 2012 was firearms, with a rate of 7.0 deaths per 100,000 residents. Approximately 70% of these firearm-related TBI deaths were self-inflicted, and an additional 20% were homicides. Firearm-related TBI deaths disproportionately affected older males. Across all age groups, males were more likely than females to die as a result of a firearm-related TBI (see Figure 2). In addition, the highest rate of firearm-related TBI death was among males aged 85 years and older (36.2 deaths per 100,000 population) followed by
males aged 75–84 years (23.8 deaths per 100,000 population). The leading cause of TBI-related hospitalizations among North Carolina residents in 2012 was unintentional falls, with a rate of 24.8 hospitalizations per 100,000 residents. Across all age groups, males were more likely than females to be hospitalized for an unintentional fall–related TBI (see Figure 3). In addition, unintentional fall–related hospitalizations were more common among the youngest and the oldest age groups for both males and females. The highest rate of unintentional fall–related TBI hospitalizations was among adults aged 75 years and older; the second-highest rate was among children less than 1 year old. The leading causes of TBI-related ED admissions among North Carolina residents in 2012 included unintentional falls (316.8 ED admissions per 100,000 population) and motor vehicle traffic crashes (109.0 ED admissions per 100,000 population). The age trends for unintentional fall–related TBI ED admissions were similar to those of unintentional fall–related TBI hospitalizations; however, rates were generally higher among females than males (data not shown). Motor vehicle traffic– related ED admissions were more common among females aged 5–24 years compared to males of the same age (see Figure 4). Across all remaining age groups, males were more likely than females to be admitted to an ED for a motor vehicle traffic– related TBI. The highest rate of motor vehicle traffic–related TBI ED admissions was among females
figure 2.
Age group (years)
Firearm-Related TBI Deaths, North Carolina Residents, 2012 85+ 75-84 65-74 55-64 45-54 34-44 25-34 15-24 5-14 1-4