Scalable Visualizations and Query-Based Debugging Demian Lessa
Bharat Jayaraman
CSE Department SUNY at Buffalo
CSE Department SUNY at Buffalo
[email protected]
[email protected]
Interactive run-time visualization of object-oriented software requires views of the current state as well as the execution history. However, as software complexity grows, runtime visualizations become unwieldy and their effectiveness quickly degrades, necessitating techniques to scale the them gracefully without compromising their meaning. The main contribution of this paper is showing that declarative queries and (run-time) object/sequence diagrams work in a symbiotic manner to achieve scalable visualizations: queries help the user to focus on specific regions of the diagrams, while the diagrams provide a framework for reporting the answers to queries. We propose two broad classes of techniques to achieve compact sequence diagrams: folding operations, for nested calls and also a sequence of calls; and filtering operations, to remove unnecessary or irrelevant calls relative to a debugging task. We introduce a refinement of the sequence diagram to account for missing calls, and regular-expression labels for compacted execution sequences. Together, these techniques have proven to be effective, and they have been implemented and tested as part of the dynamic analysis tool, Jive, Java Interactive Visualization Environment, which is available as a plug-in for Eclipse.
Keywords object-oriented programming, run-time visualization, querybased debugging, sequence diagram, folding and filtering
1.
INTRODUCTION
The object-oriented programming paradigm is pervasive both in academia and industry. Comprehending the structure of object-oriented systems via source code, design time diagrams, or other static analysis tools is significantly easier than understanding their dynamic behavior [2]. This gap is due in large measure to the nature of the object-oriented methodology, which promotes the definition of smaller methods and more complex interactions among them. It also encourages the use of dynamic dispatching and inversion of control patterns, making flow of control very hard to follow
Permission to make digital or hard copies of all or part of this work for personal or classroom use is granted without fee provided that copies are not made or distributed for profit or commercial advantage and that copies bear this notice and the full citation on the first page. To copy otherwise, to republish, to post on servers or to redistribute to lists, requires prior specific permission and/or a fee. Copyright 200X ACM X-XXXXX-XX-X/XX/XX ...$10.00.
∗
Jeffrey K. Czyz
CSE Department SUNY at Buffao
[email protected]
through an inspection of the source code. In visualizing the run-time behavior of object-oriented programs, two types of diagrams are especially useful: object diagrams for the current state, and sequence diagrams for the execution history [6]. Although object and sequence diagrams are traditionally used in UML to document use cases, our proposed visualization system [1] displays these diagrams at run-time, thereby facilitating a comparison of design-time with run-time behavior in a uniform notation and helping close the loop between design-time and runtime. An important property of our proposed approach is that every point on the sequence diagram is associated with the object diagram that would have been in effect at that point in execution. Thus, the sequence diagram serves as an effective temporal navigation tool, allowing a user jump to any point in the execution history and inspect the object diagram at that particular time. A fundamental problem, however, with visualizations is that they tend to be become very large for even modestly sized programs [2]. The length of a run-time sequence diagram, for example, is directly proportional to the number of instructions executed. In order to be useful and effective, a visualization tool must be able to determine how much information to display and how to display it without compromising the meaning of the program execution. The main contribution of this paper lies showing that declarative queries and object/sequence diagrams work in a symbiotic manner to achieve scalable visualizations: queries help the user to focus on specific regions of the diagrams, and the diagrams provide a framework for reporting the answers to queries. While previous research has focused on one or the other of these two topics exclusively, our work shows the benefit of integrating these two techniques. The focus of this paper is on sequence diagrams, as we have explored techniques for compact object diagrams in our earlier paper [5]. In particular, sequence diagrams provide a visual timeline which is especially useful for reporting answers to ‘when’ queries, e.g., “when did variable x first become negative?”, “when did two threads concurrently access x?”, etc. Likewise, such queries help define the points of interest in the sequence diagram. We propose two broad classes of techniques to achieve compact sequence diagrams: folding operations, for nested calls (horizontal folding) as well as for a sequence of calls (vertical folding); and filtering operations, to remove unnecessary or irrelevant calls relative to a debugging task. We introduce a simple regular-expression-like notation, with sequencing and definite interaction, in order to compactly la-
bel execution sequences. We also introduce a refinement of the sequence diagram in order to account for calls from a method that is not filtered (i.e., ‘in-model’) to one that is filtered (i.e., ‘out-of-model’), and vice-versa. Together, these techniques have proven to be effective on a number of examples. They have been implemented and tested as part of the dynamic analysis tool, Jive, Java Interactive Visualization Environment, which is available as a plug-in for Eclipse. The rest of this paper is organized as follows: Section 2 surveys closely related work on run-time visualization and query-based debugging. Section 3 provides an overview of our previous work on JIVE, an interactive visualization environment for Java. Section 4 describes our techniques for scalable visualizations and query-based debugging. Section 5 shows how our proposed techniques can be implemented at a conceptual level within the JIVE architecture. Section 6 presents conclusions and directions for further work.
2.
RELATED WORK
One of the distinguishing aspects of Jive is that it integrates in a single tool techniques from query-based debugging, omniscient debugging, and dynamic visualization of execution. Query-Based Debugging. Query-based debugging was first proposed by Lencevicius et al [13]. In their approach, a query is formulated in the programming language itself and run against the objects in the heap. There is no support for querying past program state and queries are not guaranteed to be side-effect free. Jive’s data is in-memory as well, but it is constructed from program traces. Querying past state is supported and queries are side-effect free. TOD [14] is a scalable omniscient debugger that features query-based debugging and dynamic visualizations. It uses bytecode instrumentation to generate events which are recorded to a specialized database. This contrasts with Jive’s current approach of relying on JPDA to for trace events and storing events in-memory. TOD’s query language is based on two low-level primitives, cursor and count, with higher-level queries being constructed algorithmically. On the other hand, Jive’s query-based debugging features are based on a declarative temporal query language. TOD provides high-level visualizations in the form of murals, which are graphs showing the evolution of event density for a given class of events. These visualizations do not provide the detailed information about execution history that Jive’s sequence diagram does. Whyline [10] is an interrogative debugger supporting ‘why did’ and ‘why did not’ queries about program executions. It works on recorded rather than on live executions, therefore, online debugging is not supported. Whyline does not expose a query language. PTQL [8] is a relational query language with SQL-like syntax designed to query program traces online via instrumented code. PTQL supports conjunctive select-project-join queries against a schema consisting of two relations: method invocations and object allocations. Coca [3] is an automated debugger for C that allows setting event-based breakpoints prior to program execution in the form of Prolog-like queries. When an event matching the query is detected, the program suspends and the developer is allowed to query current and past program state. To the best of our knowledge, none of the query-based debuggers described herein present query results on a sequence diagram. Jive displays query results in both tabular form and on the sequece diagram, providing rich context that fa-
cilitates the user’s interpretation of the results. Dynamic Visualizations Ovation [2] visualizes execution traces using an execution pattern view, a form of interaction diagram that depicts program behavior. Diagrams support a number of operations such as collapsing, expanding, filtering, and execution pattern detection (e.g., repetition). Ovation also supports searches for execution patterns on different criteria. Jive and Ovation both rely on trace data to construct their diagrams, provide search capabilities to explore the program execution via their respective diagrams, and support techniques to help users focus on regions of interest in the diagram. In contrast with Ovation, Jive is an online debugger, uses a declarative temporal query language for querying the underlying data model, and uses an enhanced sequence diagram to represent program execution. Amida [18] extracts sequence diagrams from program traces and applies a dominance algorithm in order to detect and remove local objects contributing to internal behavior of dominator objects. Experimental results show an average removal of 40% of all objects from execution traces. Amida processes traces offline while Jive displays sequence diagrams during program tracing. Jive scales sequence diagrams using folding and filtering and providing visual cues to indicate the existence of additional structure and/or information in the diagram. Amida excludes objects from the sequence diagrams but provides no indication that certain interactions are omitted. Sharp [16] describes interactive exploration of UML sequence diagrams constructed by reverse engineering the source and rely on static analysis. Their filtering techniques include temporal, call depth, and interaction fragment filtering. Filtering may be realized by graying out the filtered out parts of the diagram, or by removing them altogether. Jive’s sequence diagrams provide a dynamic view of an actual program execution. With the exception of their interaction filters, our horizontal folding techniques can scale the sequence diagrams in a manner comparable to their filtering. Our vertical folding is semantically richer in that it reduces the diagram and provides an intuitive and concise description of the hidden substructure. TPTP [4] is primarily concerned with collecting profiling data, but is able to represent the entire execution of a program as a sequence diagram, interactively. It supports filtering and hiding methods and objects, as well as collapsing entire call trees. However, the latter case is not automatic. Program Explorer [12] uses merging and filtering to reduce the size of its object and interaction graphs. Programs are visualized interactively and their execution traces can be viewed as interaction charts which are similar to sequence diagrams. ISVis [9] uses both static and dynamic analyses to construct message flow diagrams similar to sequence diagrams. These diagrams represent interaction patterns in the trace. A global view of the execution is displayed in its execution mural. Homonyms. Two other research projects have adopted the name “Jive” for their tools. In [15] tracing is done over intervals and visualizations consist of box displays containing various statistics relevant to the particular box. This tool is somewhat related to our Jive tool, but our approaches to limiting traces and visualizations are quite different. Further, [15] does not support queries. The tool described in [7] focuses on visualization of algorithms and data structures, so there is no relation with our Jive tool.
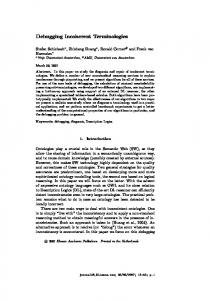
Figure 1: Jive user interface overview.
3.
OVERVIEW OF JIVE
The Java Interactive Visualization Environment [1], Jive, is a versatile dynamic analysis tool suitable for a number of applications including visual and query-based debugging, program comprehension, and teaching programming languages and software engineering at any level. Jive is currently implemented in Java as an Eclipse plugin. Figure 1 illustrates Jive’s user interface during a debug session, with object and sequence diagrams displayed on the top right and bottom right of the workspace, respectively. In many aspects, Jive works much like a traditional debugger, allowing one to define breakpoints, inspect variables, step into and over instructions, etc. Jive also provides features that transcend the abilities of traditional debuggers: dynamic visualizations of the runtime state and execution history, query-based debugging, and interactive forward and reverse stepping.
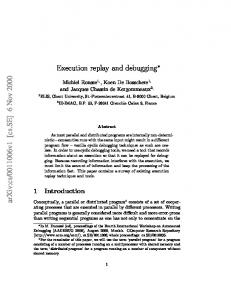
Figure 2: Jive’s architecture.
3.1
Architecture
Jive’s implementation is based on a model-view-controller
architecture, the main components of which are illustrated in Figure 2. JPDA Debugger. The debugger part of Jive is implemented on top of the Java Platform Debugger Architecture (JPDA), an event-based debugging architecture where debugger and debuggee tiers run in separate Java Virtual Machines (JVMs). The debugger front-end and back-end communicate using the Java Debug Wire Protocol (JDWP) and the debugger front-end communicates with Jive using the Java Debug Interface (JDI). The types of event requests supported by JDI are: virtual machine start, death, and disconnect; class prepare and unload; thread start and death; method entry and exit; field access and modification; exception; step. Jive Controller. Jive’s controller has three modules: an event handler, a model manager, and a UI engine. The event handler requests events from JPDA and processes event notifications received from JPDA. The event handler is capable of inferring additional event types not directly supported by JPDA, such as local variable changes. The model manager receives events from the event handler and triggers appropriate model changes. Finally, the UI engine uses data contained in the models to update the object and sequence diagrams. Jive Data Model. Jive’s data model consists of three in-memory submodels: trace, object, and sequence. The trace submodel stores all raw Jive events as received by the controller. The object submodel contains temporal object state information, as well as type information used to render object diagrams. Finally, the sequence submodel contains per-thread call trees. For each call in a call tree, the sequence model maintains references to all events occurring in the context of the call. Debugging an application with Jive proceeds as follows. Early during the debugging bootstrap process, Jive’s event handler module requests a number of debug event types from
the debugger front-end. As debugging progresses, the event handler receives event notifications asynchronously, via the debugger front-end. Handled events are forwarded to the model manager which then updates the trace data model. Updates to the object and sequence models, if necessary, are also triggered at this time by the model manager. Finally, the UI engine updates the object and sequence diagrams displayed to the user, if necessary, using the updated models. Reference Example. We designed a Binary Search Tree (BST) example in order to illustrate Jive’s integrated querybased debugging and scalable visualizations capabilities. The BST application uses a model-view-controller architecture: the model (instance of Model) maintains a binary search tree (instance of BSTNode) of int values; the view displays a BST widget and a “Load...” button that pops up a dialog from which the user can select a data file; the controller coordinates the interaction between the view and the model. A run of the BST application proceeds as follows. First, the controller is created, then it instantiates one view and one model, displays the view, and waits for a file to be loaded. After the user selects a file, the controller loads BST data from the file: for each line, the controller passes the new tree element to the model by calling Model.insertNode(int) and then notifies the view View.udpateUI(). The BST application was originally designed not to support insertion of duplicate data, however, we injected a bug in the BSTNode.insert(int element) method in order to allow duplicate insertion.
3.2
execution by Jive. The color of an activation box uniquely identifies the thread that executed the activation. Method calls and returns are displayed as horizontal arrows connecting activation boxes. The name of the called method along with an invocation number is labeled along the call arrow. The special label is used for constructor calls. A fragment of a sequence diagram is shown at the bottom right of figure 1. An important aspect of the sequence diagram is its dynamic nature. As program execution progresses, the diagram grows in both directions. Horizontal growth occurs at the rightmost end of the diagram as new life lines are appended to the diagram. Vertically, the diagram grows with the size of the trace: the more trace events the sequence diagram must represent, the larger it grows downward. An important consequence of this continuous growth of the sequence diagrams is that they quickly become very large and users must scroll the viewport in order to focus on a particular region of the diagram. The sequence diagram also serves as an effective temporal navigation tool. Figure 3 shows Jive’s support for temporal navigation via the sequence diagram. Figure 5 shows the result of jumping back to a previous point in the execution: the horizontal dashed line indicates the current point in execution and the object diagram has been updated to reflect the program state at that past time, including all outstanding method activations (as indicated by the blue arrows). The navigation bars on top of both diagrams enable stepping and resuming both forward and backward in time.
Visualization
Jive supports two kinds of visualizations: object and sequence diagrams. Jive’s object diagram captures runtime state by showing object states, structural links, and outstanding method activations within their respective object contexts. They provide considerably richer information when compared to UML’s object diagrams. Such additional information augments program comprehension and facilitates debugging. In particular, they help clarify Java’s overriding and shadowing semantics. A detailed discussion of Jive’s object diagrams, including graph drawing algorithms, scalability issues, and implementation challenges has been the subject of previous work [5]. Jive constructs a sequence diagram dynamically at runtime in order to visualize the execution history of a program. Jive’s motivation differs fundamentally from that of UML in that the UML sequence diagram documents design-time considerations while Jive’s diagram captures runtime interactions between objects. In Jive’s sequence diagram, life lines represent either object or class environments. Jive creates an object life line when a new object is instantiated by the program and a class life line when the first static method call on the respective class is made by the program. New life lines are appended to the rightmost end of the diagram, vertically aligned to the top, and their header contains a label indicating the object or class environment the life line represents. Jive does not currently represent object destruction in life lines. Each life line may contain any number of activation boxes. These boxes are opaque rectangles placed along the life line to represent actual method activations in the program. The length of an activation box provides a measure of the duration of the respective method activation in terms of the number of trace event notifications received during its
Figure 3: Temporal navigation in the sequence diagram. Reverse Stepping. In Jive, developers may inspect any past state of the debuggee without having to restart the program by using the reverse stepping feature. As reverse stepping is underway, Jive updates the object diagram so it displays the state of the debuggee at the execution point being visited. The sequence diagram is also updated so it displays the current execution point being visited as a horizontal dashed line cutting across all life lines. For a complete discussion of how Jive implements reverse stepping, we direct the reader to [1].
3.3
Query-Based Debugging
One of the longstanding strategies for debugging involves defining a breakpoint in the program source and running the debuggee until the breakpoint is reached. With the program interrupted, the user alternates between inspecting variables and stepping through program execution. This strategy is both sequential and procedural in nature. Further, if the er-
Figure 4: A template Variable Changed query (left) and a JQL query (right).
ror symptom has already manifested, the current debugging session has to be terminated and a new one must be started. The use of program traces to record a program’s execution history alleviates this problem by enabling reverse stepping and jumping to arbitrary states in the program execution history. While reverse stepping is cheap, reverse jumping requires successive reverse steps, which may be quite inefficient for jumps far into the past. The use of a query-based debugger overcomes a number of problems observed in the scenario just described. Perhaps the most important advantage of a query-based debugger lies in its support for declarative queries. This enables users to debug by formulating queries that state the problem condition, while pushing to the debugger the burden of finding the matching points in execution satisfying the debug query. Even if the user does not know exactly what to query, the use of debug queries enables exploration of the program state in a very clean and efficient manner. The construction of a query-based debugger requires the definition of a number of components: the data model and query language, the query formulation interface, and the query results interface. Data Model and Query Language. Since the program state is a function of time, the underlying data model should support debug queries involving temporal operators such as since, until, before, after, etc. Hence, Jive supports a temporal data model and a temporal query language. Our data model consists of a number of event relations all of which contain an event number field. These fields are the only ones in the schema defined over the temporal domain. Our Jive Query Language, JQL, supports selection, projection, and joins on temporal and non-temporal types. Selection on JQL queries are currently limited to conjunctive predicates. The main benefit of this choice for a query language is that queries have sufficient expressive power for a number of applications and can be implemented efficiently. Query Formulation Interface. Users must be provided with adequate interfaces so they may formulate and execute debug queries. Our approach is to provide two kinds of interfaces: a template query interface and a textual query interface. The template query interface provides the user with a selection of basic select-project template queries for which the user only needs to provide the required parameters, if any. The textual query interface is a simple text area where users can write actual queries. The query syntax is checked before the user can execute the query. Figure 4 illustrates both template and textual query in-
terfaces. The template Variable Changed query requests all assignments of a negative value to the data field of a BSTNode instance. The JQL query (right) performs a temporal join on assignment events. In particular, the query returns all assignment events e1 occurring after some other assignment event e2 such that both events correspond to assigning the same value (rvalue) to the data field (variable) of a BSTNode instance. Query Results Interface. Once a user formulates and executes a query, results must be presented to the user in an adequate form. In a typical database console application, results are presented in tabular form. In a debug application, however, we claim that a tabular output alone is not as effective. In order to make debugging more agile, query results should be presented with adequate context, as provided by the sequence diagram. Jive combines query results presentation as follows: each query result is presented as a row in the search window and also marked on the sequence diagram as a small red box in the appropriate activation box. When the user double-clicks on a row in the search window, the sequence diagram focuses on the activation box containing the result, bringing it into the current viewport if the corresponding portion of the sequence diagram is not visible. Figure 5 shows the results of the Variable Changed query presented in figure 4, with the first result visible on the sequence diagram.
4.
SCALABLE VISUALIZATIONS
Jive supports scalable visualizations of both object and sequence diagrams. Users may easily suppress the display of the internal details of objects and their interactions in the object diagram. This includes suppressing superclass details, hiding field tables, showing only objects involved in the call path, hiding aggregated objects, etc. Further details on scalable object diagrams were considered in our previous work [5]. In the remainder of the paper, we focus exclusively on scalability issues of sequence diagrams. Although queries are effective in reducing the amount of data users must analyze, interpreting such data is not trivial. In particular, the tabular presentation provides very little context while the sequence diagram provides context that is hard to interpret due to the usually large dimensions and complexity of the diagram. In order to help users effectively interpret query results, Jive supports focusing sequence diagrams on regions of interest via diagram folding. Folding aims at reducing sequence diagram size and clut-
Figure 5: Query results in tabular form (top left) and the first result marked as a red box on the sequence diagram (right).
ter by removing uninteresting regions without compromising the meaning of the diagram as a whole. The portions of the diagram containing regions of interest and their relevant contexts are left intact. Because program traces tend to grow extremely large, folding alone may not fully realize scalable visualizations. Hence, Jive allows users to filter out trace events that are unnecessary or irrelevant to the particular debug task at hand, thereby keeping the volume of trace information at a reasonable level. While folding is a dynamic operation in that it may be applied to a sequence diagram at any time, filtering affects the underlying execution trace so it must be defined prior to starting a debug session. With filtering enabled, sequence diagrams must handle missing information gracefully without compromising the meaning of the interactions displayed by the diagram. For example, Jive is capable of inferring out-of-model (i.e., filtered out) calls and returns in order to correctly place “lost” and “found” messages in the diagram.
4.1
Sequence Diagram Folding
We now describe the two main types of folding: horizontal and vertical. Horizontal folding hides all nested activation boxes of a given activation box. This allows users to focus on the high-level meaning of the folded activation rather than on how the its internal behavior is implemented. Vertical folding replaces a group of adjacent sibling activation boxes with a new activation box, which is labeled by a regular expression corresponding to the sequence of folded activation boxes. This type of folding is most effective when collapsing call sequences resulting from loops. Fold operations are defined with respect to one or more activation boxes and their scope is limited to a single thread. They are reversible: for each fold operation, an unfold operation that reverts its effect on the sequence diagram is also defined. Jive supports manual folding through context
menu actions on the sequence diagram and automatic folding via preference settings.
4.1.1
Horizontal Folding
Given an activation box A in the sequence diagram, horizontal folding hides all child activation boxes of A. The folded activation box A is adorned with two ‘+’ (plus) symbols, one on the top and one on the bottom. Structurally, this amounts to flattening the entire subtree rooted at A. Jive implements this horizontal folding as the unary Fold operation. Five additional unary fold operations are defined: FoldAfter folds all activation boxes that started and terminated after A terminated; FoldBefore folds all activation boxes that terminated before A started; FoldChildren folds every child activation box of A; Focus composes FoldBefore and FoldAfter; FocusLifeline applies FoldChildren on all activation boxes of the specified life line and Focus on the activation boxes of all other unrelated life lines. A single binary fold operation is also defined: given activation boxes A1 and A2 , FoldBetween folds all activation boxes that started and terminated after A1 terminated, and before A2 started. FoldBetween may be naturally extended to any arity. To reverse folding, we proceed in an analogous manner and define one inverse unfold operation for each fold operation defined above, using the obvious naming scheme, i.e., Unfold, UnfoldAfter, etc. Figure 6 illustrates horizontal folding in a succession of three snapshots of the sequence diagram: (1) the BST application right before the UI is displayed by the AWT thread; (2) manually folding the diagram before showView:1 is called; (3) partially folded diagram in which the Model:1 life line has been removed– no activation boxes for this life line are visible after folding. Jive supports semi-automatic horizontal folding: when double clicking a query result on the search window, Jive performs a Focus operation on the respective activation box.
Figure 6: Sequence diagram snapshots illustrating horizontal folding.
Figure 5 shows a fragment of a sequence diagram after double clicking on the first result row in the search window. The query result is displayed as a red box within the activation box labeled :3. All activation boxes before and after the subtree containing :3 have been horizontally folded, namely, all insertNode and updateUI activations. When Jive is configured to fold the sequence diagram automatically, it performs a FoldBefore operation after every method return event notification. This results in a sequence diagram that is completely folded, except for the activation boxes corresponding to the outstanding method calls in every active thread call stack.
4.1.2
Vertical Folding
The goal of vertical folding is to collapse repeating patterns of calls within a single activation box in the sequence diagram. It takes an activation box A as input and replaces all child activation boxes with a new activation box F labeled with a regular expression R(A) encoding the sequence of calls made in A. The regular expression R(A) has the form (s1 )i1 ⋯(sn )in , where each (sk )ik consists of a primitive call sequence sk and a repeat count ik ≥ 1. Primitive call sequences are those that cannot be expressed as a smaller call sequence and a repeat count, e.g., (update; update) is not primitive because it can be expressed as (update)2 . As with horizontal folding, the vertically folded activation box A is adorned with two ‘+’ (plus) symbols, one on the top and one on the bottom. Jive implements vertical folding as the unary RegexFold. For every horizontal fold (unfold) operation, Jive implements an analogous vertical fold (unfold) operation, with the expected name, i.e., RegexFocus, RegexUnfoldAfter, etc. Figure 7 shows the sequence diagram of the BST application after applying RegexFocus to the activation box labeled :4 on the life line BSTNode:4. Vertically folded activation boxes are displayed in red: the top one is labeled (insertNode; updateUI)3 and replaces six sibling activation boxes; the bottom one is labeled (updateUI; insertNode)6 and replaces twelve sibling activation boxes. All of these activation boxes are contained in the loadModel:1 activation box, and represent the loop for inserting elements read from file into the tree while updating the tree widget after every insert. It is easy to see from the diagram that exactly 10 nodes were inserted into the tree.
4.2
Filtering
Filtering is motivated by the observation that users may
Figure 7: Sequence diagram illustrating vertically folded activation boxes in red, with regular expression labels (zoomed in). Region (A) shows an out-of-model call (top) and a matching out-of-model return (bottom). Region (B) shows an out-of-model call and return pair.
know beforehand that certain parts of the code are uninteresting. For instance, in a debugging scenario, parts of the code may be trusted to be bug free. In a program comprehension scenario, the user may be interested in the public interactions among objects. Regardless of the actual user motivation, this opens the possibility for reducing the amount of trace information collected by the tracer. As previously noted, a consequence of filtering out trace events is that sequence diagrams must deal with missing information. Regular Expression Filters. Jive supports filtering of types based on their names or the package in which they are defined. A simple regular expression may be given, say, java.*, to filter out all trace events from types defined in any package matching the expression (e.g., java.util.List). Jive provides sensible default package filters for applications, applets, and unit tests. Jive also supports regular expression filters on method names. This allows users to filter out parts behavior considered uniniteresting for the task at hand. For instance, the user may filter out getter and setter methods by defining
the filters: MyClass.get* and MyClass.set*. These filters effectively eliminate from Jive’s trace any getter and setter calls made by instances of MyClass. Visibility Filters. In the object oriented paradigm, visibility scopes help users separate design from implementation concerns. Implementation details are hidden from view by declaring them either as private (or protected), while visible behavior is declared as public. Jive enables users to focus on interactions happening at any visibility scope. For instance, users trying to gain a high-level understanding of a software may choose to view only public interactions involving public classes. On the other hand, users trying to debug the implementation of a particular class may choose to view methods defined with any visibility scope. Jive supports additional filters based on specific attributes of types and methods. For instance, in the default configuration, Jive suppresses trace events for all synthetic (compiler generated) method calls. It is also possible to filter out trace events from nested types. Typical use cases for nested classes in Java include the implementation of public interfaces and the subscription of observers for event notifications. Cases such as these ones may not be interesting for users who wish to gain a high-level understanding of the system. Out-of-Model Calls and Returns. As mentioned earlier, the use of filters causes event traces to be incomplete. This means that every time Jive receives a method call or return event notification, it must determine whether the event originated/terminated in-model (i.e., non-filtered class or method) or out-of-model (i.e., filtered class or method). This is accomplished by inspecting the debuggee’s call stack and comparing it with the corresponding call tree maintained by Jive (call trees are discussed in section 5). Once Jive determines that a method call (return) originates in or out of model, it proceeds to draw the correct call (return) arrow in the sequence diagram. If a method is called from an out-of-model caller, Jive uses a found message arrow. If a method returns to an out-of-model caller, it uses a lost message arrow. Lost and found messages are defined as part of UML’s sequence diagrams. Jive provides a variation on lost and found messages as follows: if a method m2 is the first one called from an out-of-model caller within the execution of an in-model method m, then Jive draws an ‘in/out+/in’ call arrow connecting the activation boxes corresponding to m and m′ . Likewise, if m′ returns to outof-model and no other in-model method is called before an out-of-model caller returns to m, then Jive draws an ‘in/out+/in’ return arrow connecting the activation boxes corresponding to m′ and m. Figure 8 shows the styles used for all call and return arrows used by Jive. Figure 7 contains two out-of-model call/return pairs: actionPerformed, called by the (filtered) AWT thread, and getController, called by a synthetic method of the anonymous TreeGUI$1 class (an ActionListener object which listens to the “Load...” button click). The former corresponds to a ‘out/in’ call and a ‘in/out’ return; the latter to a ‘in/out+/in’ call/return pair.
5.
IMPLEMENTATION
In order to realize the scalable visualizations described in the previous section, we make use of a call tree data structure containing complete information about method calls and returns. We later relax this restriction in order to handle out-of-model calls and returns caused by filtering. We also define operations on call trees that formalize the hori-
Figure 8: Sequence diagram arrow types.
zontal and vertical fold operations.
5.1
Call Trees
We use a directed tree data structure to capture the sequence of calls and returns occurring within a single thread of execution of a program. Each call tree represents call information from a single thread, and Jive maintains one call tree per each debuggee thread. A call tree is a directed tree where nodes correspond to method activations and directed edges capture the caller/callee relationship between method activations. Every node n has an associated tuple τ (n) = ⟨m, e, c, r⟩, where m is the called method, e is the method’s execution environment (e.g., an object or a class), c is the method’s call time, and r is the method’s return time, with the convention that r is undefined if n represents an outstanding method activation (i.e., one that has not returned yet). Every edge (n1 , n2 ) encodes a method call made from the method represented by n1 (caller) to the method represented by n2 (callee). Method call times are used as a unique identifiers, or ids, for call tree nodes. Within a single thread of execution, method call times form a strict total order, that is, given call times c1 ≠ c2 , either c1 < c2 or c2 < c1 . This induces a total order on call tree nodes: given nodes n1 and n2 with call times c1 and c2 , respectively, n1 < n2 ⇔ c1 < c2 . This means that the root of a call tree is its smallest node. All other nodes represent method activations occurring as part of the execution of their respective callers. For sibling nodes n1 < n2 , the method activation represented by n1 returns before the one represented by n2 starts. If a node n represents an outstanding method activation, then so does its parent node. Jive updates call trees continuously as new call and return event notifications arrive from the debugger back-end. First, it creates a tuple T = ⟨m, e, c, r⟩ using event information. If the event is a call, then T.r is undefined, otherwise T.c is undefined. Jive then retrieves the call tree for the corresponding debuggee thread and updates it with the event information. Call trees maintained by Jive contain all information necessary to draw the various elements of the sequence diagram: life lines, activation boxes, and call/return arrows. Further, Jive colors activation boxes based on the thread in which their corresponding method activations occur. This is an important visual property of Jive’s sequence diagrams, as it provides a natural thread-based grouping of activation of boxes.
5.2
Operations
Call trees support three basic operations: insertion, removal, and substitution of subtrees. The first two operations return the modified call trees, while substitution returns the modified call tree and the substituted subtree. These primi-
Figure 9: Two call tree labeled with call times. The left tree highlights potentially uninteresting regions based on two nodes of interest; the one on the right shows the result of folding these regions.
tive operations are the building blocks for the more advanced operations such as folding and merging discussed later in this section. Diagram Folding. Consider the call tree illustrated on the left of figure 9 and assume the user is only interested in the method activations identified by nodes 35 and 76 (e.g., query results on the sequence diagram). Intuitively, the subtrees rooted at nodes 35 and 76 are relevant since they contain information about all method activations nested within the activations of the methods represented by nodes 35 and 76. The paths from the root to nodes 35 and 76 are also relevant, as they represent the call stacks at the time these method activations occurred in the program. On the other hand, the red (before), green (between), and blue (after) regions in the call tree are potentially uninteresting. The before region identifies all method activations that returned before the method represented by node 35 was called. The after region identifies all methods that were called after the method represented by node 76 returned. Finally, the between region identifies all methods that were called after the method represented by node 35 returned and returned before the method represented by node 76 was called. The fold operation uses substitution to replace a designated subtree t′ of a call tree t with a new leaf node `, returning the modified call tree. The unfold operation reverts the call tree to its state prior to folding by simply replacing ` with t′ in t. We assume all nodes inserted in a call tree via folding are marked so they can be distinguished from ordinary call tree nodes. Jive implements horizontal folding and unfolding on sequence diagrams using these call tree operations. Recall that in the left of figure 9 we identified three potential regions for folding based on two nodes of interest. The right side of the figure shows the call tree obtained after folding these potentially uninteresting regions. While the call tree fold operation replaces a single subtree with a new leaf node, vertical folding requires the definition of an operation that replaces sibling nodes in the call tree. The merge operation accomplishes this task. Given a call tree t and a list of adjacent sibling nodes N , merge uses substitution to replace all subtrees rooted in the nodes in N with a new leaf node µ, returning the modified call tree. The node µ is annotated with a regular expression that compactly encodes the sequence of calls represented by the nodes in N . This regular expression is obtained as follows: (i) we compute all (primitive) tandem repeats in the string representing the sequence of calls in N using the algorithm described in [17], in time O(∣N ∣ log ∣N ∣);
(ii) we construct a directed weighted graph G with ∣N ∣ nodes and O(∣N ∣ log ∣N ∣) edges using the results of (i); (iii) finally, we run Dijkstra’s algorithm on G to obtain the best regular expression representing N in time O(∣N ∣ log ∣N ∣). The split operation reverts the call tree to its state prior to merging by simply inserting all subtrees rooted in the nodes of N as children of the parent of µ, and then removing µ from t. As with folding, we assume nodes inserted via merge can be identified in the call tree. Jive implements vertical folding and unfolding using merge and split. Note that merge requires that the nodes in N be adjacent siblings. Intuitively, this avoids merging nodes that do not represent a contiguous sequence of method calls made from the same method activation. Out-of-Model Nodes. Call trees can be extended to handle out-of-model calls and returns. The main idea is to introduce an out-of-model node to represent all out-of-model calls made in the context of a particular method call. Consider a call tree node n1 with no child nodes. Assume a new method call event is notified and Jive detects that it is an out-of-model call. Jive adds two nodes to the call tree: one out-of-model node o as a child of n1 , and one node n2 as a child of o to represent the method call event just received. Assume now that n2 returns and Jive detects another outof-model call. Since n1 has not returned yet, Jive only adds one node to the call tree: a node n3 as a sibling of n2 (i.e., as a child of o). This means that Jive represents an arbitrarily complex out-of-model interaction occurring in the context of n1 as a single out-of-model node in the call tree, possibly with many in-model child nodes. All operations introduced earlier in this section are easily extended to handle out-of-model nodes.
5.3
Empirical Results
We now return to the example introduced in section 3 and use it to show the effectiveness of combining query-based debugging with scalable visualizations. For this exercise, we assume that Jive is configured with the default filters and that the user loaded BST data from a file containing ten values, three of which were negative: -10, -12, and -10. After loading the data but before any activation boxes are folded, 683 activation boxes are visible in the sequence diagram. Query-Based Debugging. Consider the template Variable Changed query of figure 4. This query searches for negative values assigned to the data field of BSTNode instances. As expected, the query produces exactly three results. When the user double clicks the second result (-12) on
the search window, Jive displays a sequence diagram much like the one in figure 7, except for some missing initialization and paint activation boxes at the top and at the bottom of the diagram, respectively. The total number of nodes in the folded sequence diagram is 25– 96.3% of all initially visible activation boxes are folded. Double clicking on the other query results produces similar reductions in the diagram. Although this is a rather constricted example, it is reasonable to expect this kind of reduction in the sizes of sequence diagrams when exploring query results. The reason is that Jive focuses on one query result at a time, meaning that only the subtree containing the query result is unfolded, while all others remain folded. Manual Diagram Exploration. Assume that instead of running a query, the user simply wants to explore the sequence diagram after loading the data. By applying a simple FoldChildren on the loadModel():1 activation box (see figure 7), the user reduces the diagram to 55 nodes (92.0% reduction) and gains a reasonable high-level understanding of the execution of this method. The user may then decide to fold all activation boxes before loadModel():1, further reducing the diagram to 33 nodes (95.2% reducton). Finally, if the user applies a RegexFoldChildren to loadModel():1, the diagram ends up with a mere 14 nodes (98% reduction). The results presented in this section suggest a lot of potential for the query-based debugging and visualization techniques implemented by Jive. These results agree with other tests performed during tool development and testing. We plan on running experiments to confirm the benefits of our approach in more realistic scenarios.
6.
CONCLUSIONS AND FURTHER WORK
We have described techniques for scalable visualizations of the run-time state and execution history of object-oriented programs. The main idea underlying our approach is that declarative debug queries not only facilitate efficient search for run-time information– akin to a web search engine– they also help the visualization system focus on what is to be displayed. As described in the paper, the sequence diagram is particularly helpful in providing a visual timeline for reporting answers to ‘when’ queries. The paper also presented two broad classes of techniques (folding and filtering) for reducing the amount of information displayed. We introduced a regular-expression notation for concisely abstracting a sequence of calls in sequence subdiagram, and also a refinement of the sequence diagram itself for calls between methods that are not filtered out and those that are. The implementation of these techniques is based upon call trees, and we show how the folding operations are realized as operations on this tree structure. Our techniques have been successfully incorporated in a state-of-the-art debugging system, Jive, for the Java programming language. While the focus of this paper was on achieving compacted sequence diagrams, our earlier paper [5] showed techniques for compact object diagrams. In this paper, we presented template-based queries as well as more expressive textual JQL queries. We are developing a full-fledged temporal data model and query language for eliciting debugging information from the states of execution history of object-oriented programs. To enhance scalability of the Jive methodology for long execution sequences, we are exploring three approaches: (i) the use of byte-code instrumentation for minimizing the extent of
process context-switching; (ii) the use of dynamic slicing techniques for determining the relevant states and execution subhistory with respect to variables of interest; and (iii) the use of an external database for saving very large execution histories. The Jive system may be accessed from http://www.cse.buffalo.edu/jive.
7.
REFERENCES
[1] J. K. Czyz and B. Jayaraman. Declarative and visual debugging in eclipse. In Proc. Eclipse Technology eXchange, pp. 31–35, Montreal, 2007. [2] W. De Pauw, D. Lorenz, J. Vlissides, and M. Wegman. Execution patterns in object-oriented visualization. In Proc. 4th COOTS, pp. 219–234, April 1998. [3] M. Ducass´e. Coca: an automated debugger for c. In Proc. 21st ICSE, pp. 504–513, Los Angeles, CA, 1999. [4] Eclipse. Eclipse Test and Performance Tools Platform. [Online; accessed 28-July-2006]. [5] P. V. Gestwicki and B. Jayaraman. Methodology and architecture of Jive. In Proc. 2nd SoftVis, pp. 95–104, St. Louis, MO, 2005. [6] P. V. Gestwicki and B. Jayaraman. Interactive Visualization of Java Programs. In Proc 2nd HCC, pp. 226–235, Arlington, VA, 2002. [7] G. Cattaneo, P. Faruolo, U. F. Petrillo, and G. F. Italiano. JIVE: Java Interactive Software Visualization Environment. In Proc 4th VL/HCC, pp. 41–43, Rome, Italy, 2004. [8] S. F. Goldsmith, R. O’Callahan, and A. Aiken. Relational queries over program traces. In Proc. 20th OOPSLA, pp. 385–402, San Diego, CA, 2005. [9] D. F. Jerding, J. T. Stasko, and T. Ball. Visualizing interactions in program executions. In Proc. 19th ICSE, pp. 360–370, Boston, MA, 1997. [10] A. J. Ko and B. A. Myers. Finding causes of program output with the java whyline. In Proc. 27th CHI, pp. 1569–1578, Boston, MA, 2009. [11] B. Korel and J. Laski. Dynamic program slicing. Inf. Process. Lett., 29(3):155–163, 1988. [12] D. B. Lange and Y. Nakamura. Object-oriented program tracing and visualization. Computer, 30(5):63–70, May 1997. [13] R. Lencevicius, U. H¨ olzle, and A. K. Singh. Query-based debugging of object-oriented programs. In 12th OOPSLA, pp. 304–317, Atlanta, GA, 1997. [14] G. Pothier, E. Tanter, and J. Piquer. Scalable omniscient debugging. SIGPLAN Notitces, 42(10):535–552, 2007. [15] S. P. Reiss. Visualizing Java in action. In Proc. 1st SoftVis, pp. 57–ff, San Diego, CA, 2003. [16] R. Sharp and A. Rountev. Interactive exploration of uml sequence diagrams. In Proc. 3rd VISSOFT, page 8, Budapest, Hungary, 2005. [17] J. Stoye and D. Gusfield. Simple and flexible detection of contiguous repeats using a suffix tree. Theor. Comput. Sci., 270(1-2):843–850, 2002. [18] Y. Watanabe, T. Ishio, Y. Ito, and K. Inoue. Visualizing an execution trace as a compact sequence diagram using dominance algorithms. In Proc. 4th PCODA. Belgium, October 2008.