Scan Patterns on Visual Scenes predict Sentence Production Moreno I. Coco (
[email protected]) and Frank Keller (
[email protected]) School of Informatics, University of Edinburgh 10 Crichton Street, Edinburgh EH8 9AB, UK
Abstract A range of cognitive modalities are involved in everyday tasks, which raises the questions to which extend these modalities are coordinated. In this paper, we focus on two particular aspects of this coordination: linguistic structure and visual attention during sentence production, based on the hypothesis that similar scan patterns are associated with similar sentences. We tested this hypothesis using a dataset from an eye-tracking experiment in which participants had to describe a photo-realistic scene. We paired each sentence produced with the corresponding scan pattern, and computed a range of similarity measures for both modalities. Correlation and mixed model analyses confirmed that trials involving similar scan patterns also involve similar sentences productions. This was true for all pairs of linguistic and scan pattern similarity measures we investigated. The result holds both before and during sentence production, and for within-scene and between-scene analyses. Keywords: scan patterns; sentence production; eye-tracking; sentence similarity.
Introduction Everyday tasks demand the coordination of a range of cognitive modalities. If the task is to make tea, for example, then motor actions (e.g., arm-hand movement) and visual attention (e.g., looking at the pot) have to be coordinated (Land, 2006). This implies that if two different persons perform the same task, they will do so in a similar way. It follows that the sequence of scan patterns, i.e., eye fixations across spatial locations in temporal order (Noton & Stark, 1971) as well as the sequence of motor actions, will be similar across participants (Land, 2006). In this paper, we investigate whether a similar evidence of cross-modal coordination can be found when vision and language have to be coordinated. In particular, we focus on the similarity between scan patterns and linguistic structures in a language generation task. In the visual cognition literature, similarity of scan patterns has not received much attention, mainly because of the high variability across participants (Henderson, 2003). There are some results, however, that point toward a range of visual factors that can trigger similarity. Often, these factors are related to the task (Castelhano et al., 2009), and to the degree of cross-modal interactivity required to perform it. In tasks with a low level of interactivity, i.e. free viewing, visual attention is mainly guided by exogenous factors like saliency (Itti & Koch, 2000): a measure of visual prominence based on low-level features (color, intensity and orientation). A free viewing task does not require visual attention to interact with extra-modal knowledge based (top-down) information. The low interactivity of free viewing makes the vi-
sual responses being driven by exogenous visual mechanisms while minimizing the need for cross-modal coordination. Different patterns of visual attention emerge in other visual tasks, such as memorization or imagery (Humphrey & Underwood, 2008), where participants are asked to memorize images in preparation for a recall phase. In the recall phase, despite the absence of the original stimuli (preventing bottomup effects), scan patterns on a blank screen were more similar across participants within the same scene than across different ones (Humphrey & Underwood, 2008). In this case, the task requires an endogenous control of visual attention through top-down knowledge: i.e. scene layout, contextual information, and even semantic relations between objects (Hwang et al., 2009). Thus, exogenous bottom-up effects are overridden by endogenous contextual guidance effects. These results, consistent with similar findings from visual search studies (Yang & Zelinsky, 2009), suggest that in tasks requiring endogenous control, categorical and semantic information is activated. Reasonably, this endogenous access to categorical information is activated during daily actions (Land, 2006); where categorical knowledge about the tea pot (i.e. it has a handle to grasp) is necessary to allow cross-modal coordination between visual attention and motor-action. It is important to notice that this information has a direct link with language processing. Such categorical information, in fact, is typically expressed verbally, and drives linguistic tasks such as scene description. It seems likely that the shared mechanism, based on categorical information, which allows coordination between motor-action and visual attention might also underlie the coordination between language processing and visual attention. Previous research has looked at the interaction between vision and language principally using the visual world paradigm (VWP, Tanenhaus et al. 1995), an eye-tracking paradigm which has demonstrated clear links between the processing of certain linguistic constructions and the access to visual contextual information (Knoeferle & Crocker, 2006). Research in this field suggests a tightly coupled relation between vision and language, but previous works has largely focused on specific psycholinguistic phenomena (e.g., attachment ambiguity), rather than uncovering the shared mechanisms by which this interaction takes place. We explain this coupled relation assuming a categorical interface which coordinates the cross-modal, visual and linguistic, interaction. In this paper, we investigate the extent to which visual and language processing are synchronized when participants perform a task viz., scene description in a visual context, which
Stellan Ohlsson and Richard Catrambone, eds., Proceedings of the 32nd Annual Conference of the Cognitive Science Society, 1934–1939. Portland, 2010.
the scan patterns produced both in preparation for production (min = 800 ms; max = 10205 ms) and during production (min = 2052 ms; max = 18361 ms). Both types of variability have to be taken into account when developing metrics for sentence and scan pattern similarity.
Similarity Measures Before quantifying the association between scan patterns and sentence productions, we measure similarity within each modality. We defined two similarity (or equivalent, dissimilarity) measures for both modalities. Applying more than one measure makes it less likely that our results will be an artifact of the type of measure used. Sentence Measures We define two similarity measures on sentences: Feature Dissimilarity (FD) and semantic similarity computed using Latent Semantic Analysis (LSA). We preprocess the sentences produced by the participants using an automatic part of speech (POS) tagger (Toutanova & Manning, 2000), whose reported accuracy is 96.8% on the Penn Treebank. The POS tags make it easy to extract relevant information from a sentence. For FD measure, we represent each sentence as a vector, each element of which represents a feature of the sentence. We include semantic and syntactic features, as well as contextual information derived from the scenario a scene belongs to. (In the result section, we also report correlation coefficients obtained when excluding the contextual features.) Syntactic features include (1) the length of the utterance, which is a general indicator of complexity while also reflecting the total number of visual referents, and (2) the presence of coordination, which reflects disambiguation strategies. As semantic features we include (1) the verb frame and (2) semantic similarity between verbs. The verb frame encodes the arguments the verb can take, obtained from WordNet (e.g., transitive or intransitive); semantic similarity is computed using Jiang and Conrath’s (JC) synset path-distance (Budanitsky & Hirst, 2006). This distance measure is based on the number of nodes from one verb to another in the WordNet database. We calculate pairwise JC distance on all pairs of unique verbs in our corpus of sentence productions; we then apply hierarchical clustering to group together similar verbs. Cluster membership is the feature value included in the FD vector. The contextual features include (1) the animacy of the cue word, useful to discriminate between different descriptive routines and (2) the scenario in which the sentence was produced (e.g., bathroom, entrance). Notice that the contextual features are not scene specific; each scenario is represented by four different scenes. After converting each sentence into a vector of features, we calculate FD between all pairs of sentences by applying Gower distance (Gower, 1971), which can be used when the data is both numerical and categorical. LSA measures the similarity between words based on the co-occurrence of content words within a collection of documents (in our case the British National Corpus). It indicates
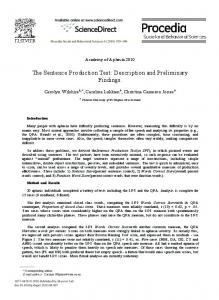
Figure 1: Example of scene and cues used as stimuli for the description task
requires endogenous interaction between linguistic and visual processing. Our main hypothesis is that scan patterns and sentences are correlated, i.e., if two trials involve similar scan patterns, then the sentences produced in these two trials will also be similar.
Experimental Setting In this section, we discuss how the data was collected and processed, and explain how we computed the measures of scan pattern and linguistic similarity.
Data Collection and Pre-processing In an eye-tracking language production experiment (Coco & Keller, 2010), we asked participants to describe photorealistic indoor scenes after being prompted with cue words which referred to visual objects in the scenes. The cue words were either animate or inanimate (e.g., man or suitcase) and were ambiguous with respect with the scene (see Figure 1 for an example trial). Participants’ eye-movements were recorded using an Eyelink II eye-tracker with at sampling rate of 500 Hz on a 21” screen (1024 x 768 pixel resolution), while the speech of the participants was recorded with a lapel microphone. We collected a total of 576 sentences produced for 24 scenes1 which were drawn from six different scenarios (e.g., bedroom, entrance). The sentences were manually transcribed and paired with the scan patterns that participants followed when generating the sentences. We removed two pairs because the sentences were missing. The data varies across participants and scenes both in terms of the complexity of the sentences (i.e., one man waits for another man to fill out the registration form for a hotel vs. the man is checking in for Figure 1) and in the length of 1 Scene refers to the layout location where an event is happening. Scenario refers to the context classifying the individual scene
2
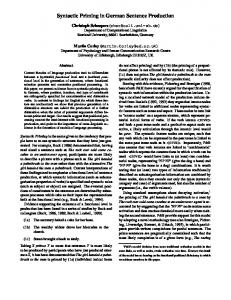
a time unit of SPnew by simply dividing the length of SPold with the length of SPnew . Over the SPold time-points, we look for the object which has received the highest number of looks and map it into the corresponding time-unit of SPnew . The final result is a normalized scan-pattern of fixed length containing the objects most likely to be fixated. The second method used to compare scan patterns is Ordered Sequence Similarity (note that despite its name, OSS is in fact a dissimilarity measure). Its main advantage is that it can be used with sequences of different lengths, and has shown to be more effective than established measures such as edit distance (Gomez & Valls, 2009). OSS is based on two aspects of sequential data: the elements the sequence is composed of, and their positions. When comparing two sequences, it takes into account the number of common elements and their relative order. The first step is to find target objects that occur in both scan patterns. For example in Figure 2, four objects are shared by the two scan patterns (man, plant, statue, suitcase). For each common element, we calculate the distance between the two sequences, e.g., statue of scan pattern 1 is two units distant from statue in scan pattern 2. Distances are then summed and normalized on the basis of sequence lengths (for details refer to Gomez & Valls 2009). All four measures of similarity are computed pairwise, i.e., every trial (sentence and scan pattern) is paired with every other trial. This resulted in a total of 164,164 pairs, for each region of analysis, i.e., Before and During production.
Figure 2: Example of how scan patterns are represented and normalized (for VR only); and how measures of scan pattern similarity are computed
how likely two words are to occur in the same document. Differently from Hwang et al. (2009) where LSA is calculated between individual words, we implemented a version of LSA generalized to compute similarity of sentences (Mitchell & Lapata, 2009). We compute an LSA vector for each content word in the sentence (context window of size five; low frequency words are removed) and then combine these vectors using addition to obtain a sentence vector (an alternative discussed by Mitchell & Lapata 2009 would be vector multiplication). Similarity between sentence vectors is measured using cosine distance. Scan Pattern Measures We use two measures to compute the similarity between scan patterns: Visual Recurrence (VR) and Ordered Sequence Similarity (OSS, Gomez & Valls 2009).
Analysis To analyze the correspondence between sentences and scan patterns, we divide the data into two regions: Before speech onset, and During production. The Before region provides evidence about the process of utterance planning and visual information retrieval, whereas During is informative about linguistic encoding and the utilization of visual information during this process. We perform two types of analysis: descriptive and inferential. In the descriptive analysis, we investigate the data at two levels: (1) globally, i.e., by performing comparisons between all pairs of trials in the full data set, and (2) locally, i.e., by comparing only the trials that pertain to a given scene (24 in total). These two forms of analysis make it possible to test whether the correspondence between sentences and scan patterns is scene specific. For comparison, we also report a baseline correlation(Humphrey & Underwood, 2008) that is obtained by pairing sentences and scan patterns randomly (rather than pairing the scan patterns with the sentences they belong to). We quantify the strength of the correspondence between similarity measures by computing Spearman’s ρ for all pairs of measures. We do not report coefficients for the baselines, as they are not significant across all combined measures: ρ ≈ 0.002; p > 0.1. For the correlation analysis, we also consider a variant of the Feature Dissimilarity measure, for which we remove the contextual features (FD-C). This makes it pos-
We consider scan patterns as temporally ordered sequences of fixated target objects. Each trial is therefore encoded as a sequence of discrete time points, each annotated with the object fixated at that time, encoded numerically (see Figure 2). VR is a percentage measure of scan pattern similarity that counts the frequency of looks to the same objects during the same time points between two scan patterns relative to its total length. For example, in Figure 2, we have two matches on a total of seven time points, i.e., 25.87% agreement between the scan patterns. VR can only compare scan patterns equal in length. We therefore normalize each scan pattern (SPold ) by mapping it onto a normalized time course of fixed length (SPnew ). The length of SPnew is set on the basis of the shortest eyemovement sequence found across all participants. For each SPold , we obtain the number of time-points corresponding to 3
sible to investigate the contribution of scenario and animacy of the cue word to the correspondence between scan pattern and sentence similarity. The distinction we made between global and local similarity has implications for the nature of correspondence. A correlation found globally (across all scenes) would imply that scan patterns are partially independent from the precise layout of the scene, i.e. position of the objects, etc., as these factors varied across scenes, but rather dependent on the categorical structure shared, i.e. the visual referents common across scenes. A correlation found at the local level would be consistent with well-known scene-based effects, both bottomup and top-down, which guide visual attention (Itti & Koch, 2000; Humphrey & Underwood, 2008). In the inferential analysis, we apply linear mixed effects modeling (Baayen et al., 2008) using the R-package lme4. We use scan pattern similarity as the dependent variable (fitting a separate model for OSS and VR) and sentence similarity (FD and LSA) as predictors. The region of analysis (before or after) is also included as a factor. As random effects, we included participants and trials.2 . All fixed factors were centered to reduce collinearity. The models are built following a forward step-wise procedure. We start with an empty model, then we add the random effects. Once all random effects have been evaluated, we proceed by adding the predictors. The parameters are added one at time, and ordered by their loglikelihood improvement of model fit: the best parameter goes first. Every time we add a new parameter to the model (fixed or random), we compare its log-likelihood against the previous model. We retain the additional predictor if log-likelihood fit improves significantly (p < 0.05). The final model is therefore the one that maximizes fit with the minimal number of predictors.
Figure 3: Correlation between LSA similarity, Feature dissimilarity (FD) and Ordered Sequence Similarity (OSS)
ing. During planning, visual attention integrates the categorical information of the scene with the linguistic referents selected as arguments of the sentence. When production starts, detailed information is sourced from the visual processor to drive encoding, thus triggering more specialized routines of visual information retrieval. Figure 4 plots local similarity values i.e., computed separately for each scene (OSS against LSA)5 . Generally, the trend previously observed at the global level is confirmed,
Results and Discussions Figure 3 plots the linguistic similarity measures LSA and FD against the scan pattern similarity measure OSS3 , computed globally, i.e. across all scenes. We bin the data on the x-axis and include 95% confidence intervals. The plots also include the random baseline. For both linguistic measures, we observe a clear trend between sentence and scan pattern: when LSA4 similarity increases, scan pattern dissimilarity decreases; when feature dissimilarity (FD) increases, OSS also increases. This effect is observed both Before and During region, but not in the random baseline. We also observe a difference in the intercept between the Before and During region. In the Before region, there is less dissimilarity between scan-patterns overall. This could indicate a higher degree of coordination between the two modalities during sentence planning, compared to sentence encod-
5 Again, for space limitation, we can show only one pair of combined measures, OSS/LSA. However, we observe a similar trend for all the others pairs.
2 Similarity is calculated pairwise. Thus, we need to include as random variables two participants and two trials for each pair. 3 For reason of space, VR is shown only in the LME results. 4 The non-linearity of LSA is a property of cosine derived measures.
Figure 4: Scan pattern dissimilarity (OSS) as a function of the Linguistic Similarity (LSA) across all 24 scenes
4
Table 1: Correlations (Spearman ρ) between the different similarity measures. Before and During aggregated
Measures VR OSS FD LSA ∗∗∗ OSS −0.63 FD −0.07∗∗∗ 0.15∗∗∗ LSA 0.15∗∗∗ −0.10∗∗∗ −0.06∗∗∗ FD-C −0.02∗∗ 0.01∗ 0.86∗∗∗ −0.10∗∗∗
Table 2: Minimum and Maximum correlations (Spearman ρ) across different scenes between the different similarity measures.
Measures OSS FD LSA
min max min max min max
VR OSS FD −0.10 −0.56 −0.01 −0.02 −0.55 0.44 0.01 −0.001 −0.52 0.33 −0.30 −0.79
Figure 5: Predicted values of the linear mixed effects model: linguistic similarity predicted by scan pattern similarity
Table 3: LME coefficients. The dependent measures are: OSS and VR. The predictors are: Region (contrast coding: Before = −0.5; During = 0.5) and the Linguistic Measures (LM) FD or LSA. Each column shows which linguistic/scan pattern similarity measure is compared
Predictor FD/OSS FD /VR LSA/OSS LSA/VR Intercept 0.0879∗∗∗ 18.95∗∗∗ 0.639∗∗∗ 18.97∗∗∗ Region 0.062∗∗∗ −0.907∗∗∗ 0.062∗∗∗ −0.906∗∗∗ LM 0.087∗∗∗ −6.151∗∗∗ −0.104∗∗∗ 5.953∗∗∗ LM:Region −0.083∗∗∗ 4.866∗∗∗ n.sig. −2.687∗∗∗
both for the Before and the During region, though there is some variation in the degree of association between scan pattern and linguistic similarity across scenes. Table 1 lists the correlation coefficients for all pairs of similarity measure. There are weak but significant correlations across all measures. In particular, both VR and OSS are significantly correlated with both FD and LSA in the direction expected, i.e., positively in case of dissimilarity and negatively in the case of similarity. Between the two scan pattern measures (OSS and VR), we observe a strong correlation, whereas the association between the two linguistic measures (FD and LSA) is weak. We also observe that FD-C, the measure obtained by removing contextual information from FD is highly correlated with FD, but the removal of contextual information weakens the correlation with the scan pattern measures. On the other hand, FD-C is somewhat more strongly correlated with LSA than FD is. It seems that the contextual information, even if at the level of the scenario, prominently contribute to the prediction of scan pattern similarity. In Table 2, we show the minimum and maximum values of the correlation coefficients for similarity measures observed locally, i.e. computed trials aggregated by scene. As expected from the plots in Figure 4, correlation coefficients vary across scenes for all pairs of measures. The context of the individual scenes modulates the correspondence between scan patterns and linguistic productions. Compared to the global coefficients, the most noticeable difference is a strengthening of the correlation between the two linguistic measures FD and LSA. It seems that in a scene context, the semantic information expressed by LSA more directly matches the information in FD, which also includes verb semantics and scenario information. Turning now to the inferential analysis, Figure 5 plots LME predicted values calculated globally for all pairs of measures.
The models closely follow the empirical patterns in Figure 3. Table 3 lists the coefficients of the mixed models; we find a significant main effect of scan pattern similarity for both FD and LSA, for both the OSS and the VR model. Moreover, we observe a main effect of region across all combined measure: for the Before region, sentence similarity is more strongly related to scan pattern similarity, compared to the During region. Furthermore, we observe an interaction of region of analysis and linguistic similarity: for Before region, the similarity between sentence and scan pattern has a steeper change, compared to During. In linguistically driven visual planning, we retrieve the referents going to be encoded. Thus, if two sentences are going to be very different, the set of referents chosen during visual planning is also going to be very different. During encoding instead, the visual system is already sourcing detailed information sentence specific, thus the magnitude of change is relatively smaller compared to planning.
General Discussion A range of cognitive modalities are involved in everyday tasks, which raises the questions to which extend these modalities are coordinated. In this paper, we focused on two particular aspects of this coordination: linguistic structure and visual attention during sentence production. Our main hypothesis was that similarity of scan patterns predict the similarity of sentences. 5
based measures of semantic distance. Computational Linguistics, 32, 13–47. Castelhano, M., Mack, M., & Henderson, J. (2009). Viewing task influences eye movement control during active scene perception. Journal of Vision, 9(3), 1–15. Coco, M., I., & Keller, F. (2010). Sentence production in naturalistic scene with referential ambiguity. In R. Catrambone & S. Ohlsson (Eds.), Proceedings of the 32th Annual Conference of the Cognitive Science Society, Portland. Gomez, C., & Valls, A. (2009). A similarity measure for sequences of categorical data based on the ordering of common elements. Lecture Notes in Computer Science, 5285/2009, 134–145. Gower, J. (1971). A general coefficient of similarity and some of its properties. Biometrics, 27, 623–637. Henderson, J., M. (2003). Human gaze control during realworld scene perception. Trends in Cognitive Sciences, 7, 498–504. Humphrey, K., & Underwood, G. (2008). Fixation sequences in imagery and in recognition during the processing of pictures of real-world scenes. Journal of Eye Movement Research, 2, 1–15. Hwang, A., Wang, H., & Pomplun, M. (2009). Semantic guidance of eye movements during real-world scene inspection. In N.A. Taatgen & H. van Rijn (Eds.), Proceedings of the 31th Annual Conference of the Cognitive Science Society, Amsterdam. Itti, L., & Koch, C. (2000). A saliency-based search mechanism for overt and covert shifts of visual attention. Vision Research, 40, 1489–1506. Knoeferle, P., & Crocker, M. (2006). The coordinated interplay of scene, utterance and world knowledge. Cognitive Science, 30, 481–529. Land, M. (2006). Eye movements and the control of actions in everyday life. Progress in Retinal and Eye Research, 25, 296–324. Mitchell, J., & Lapata, M. (2009). Language models based on semantic composition. Proceedings of the 2009 Conference on Empirical Methods in Natural Language Processing, (pp. 430– 439). Noton, D., & Stark, L. (1971). Eye movements and visual perception. Scientific American, 224, 34–43. Tanenhaus, M. S.-K., M.J., Eberhard, K., & Sedivy, J. (1995). Integration of visual and linguistic information in spoken language comprehension. Science, (pp. 632–634). Toutanova, K., & Manning, C. (2000). Enriching the knowledge sources used in a maximum entropy part-of-speech tagger. In Proceedings of the Joint SIGDAT Conference on Empirical Methods in Natural Language Processing and Very Large Corpora (EMNLP/VLC-2000). Yang, H., & Zelinsky, G. (2009). Visual search is guided to categorically-defined targets. Vision Research, 49, 2095– 2103.
We tested this hypothesis using a dataset from an eyetracking experiment in which participants had to describe a photo-realistic scenes. We paired each sentence produced with the corresponding scan pattern, and computed similarity measures for both modalities. We used Visual Recurrence and Ordered Sequence Similarity to compare scan patterns, while for sentences we used a semantic similarity measure based on LSA and a feature dissimilarity measure that combines syntactic, semantics, and contextual information. Both descriptive and inferential analysis confirmed our hypothesis: if two trials involve similar scan patterns, then the sentences produced in these two trials are also similar. This was true for all pairs of linguistic and scan pattern similarity measures. Furthermore, we subjected the data to a global analysis (i.e., we computed similarity across different scenes) and a local analysis (i.e., we only compared scan patterns and sentences within the same scene). Significant correlations were found in both cases, which suggests that the correspondence between sentences and scan patterns cannot be explained as a simple mapping between individual scene content and the objects mentioned in the corresponding sentence. This conclusion is confirmed at the level of individual scenes, where the variability observed suggests the presence of different visual and linguistic factors modulating the strength of the correspondence. An important point emerged during our analysis regarding the role of contextual information in predicting similarity. When contextual features were removed from the linguistic measure, the strength of the correlation was reduced (but was still significant). Even though our contextual features were not scene specific, but rather pertained to more general scenarios, they were still helpful in predicting scan patterns. Within the broader context of cognition, in tasks demanding the interaction vision and language, where endogenous control plays an essential role, they synchronize processing through coordination over a shared categorical interface. Ongoing work is currently investigating the sequential and temporal aspect of the correspondence using alignment techniques borrowed from bio-informatics. We find alignment techniques more pertinent than Markovian approaches, where it is not easy to directly compare similarity between instances of sentence and scan pattern without losing the temporal information. Preliminary results show that the inclusion of temporal information together with a more stringent analysis of sequential data increase our findings of correlation between sentences and scan patterns. Finally, in future work we plan to investigate a range of linguistic features separately, thus enabling us to establish which aspects of scan patterns predict syntactic, semantic, or contextual aspects of sentence production.
References Baayen, R., Davidson, D., & Bates, D. (2008). Mixed-effects modeling with crossed random effects for subjects and items. Journal of Memory and Language, 59, 390–412. Budanitsky, A., & Hirst, G. (2006). Evaluating wordnet6