The Journal of Neuroscience, June 25, 2014 • 34(26):8837– 8844 • 8837
Systems/Circuits
Low-Level Image Properties of Visual Objects Predict Patterns of Neural Response across Category-Selective Regions of the Ventral Visual Pathway Grace E. Rice, David M. Watson, Tom Hartley, and Timothy J. Andrews Department of Psychology and York Neuroimaging Centre, University of York, York YO10 5DD, United Kingdom
Neuroimaging studies have revealed strong selectivity for object categories in high-level regions of the human visual system. However, it is unknown whether this selectivity is truly based on object category, or whether it reflects tuning for low-level features that are common to images from a particular category. To address this issue, we measured the neural response to different object categories across the ventral visual pathway. Each object category elicited a distinct neural pattern of response. Next, we compared the patterns of neural response between object categories. We found a strong positive correlation between the neural patterns and the underlying low-level image properties. Importantly, this correlation was still evident when the within-category correlations were removed from the analysis. Next, we asked whether basic image properties could also explain variation in the pattern of response to different exemplars from one object category (faces). A significant correlation was also evident between the similarity of neural patterns of response and the low-level properties of different faces, particularly in regions associated with face processing. These results suggest that the appearance of category-selective regions at this coarse scale of representation may be explained by the systematic convergence of responses to low-level features that are characteristic of each category. Key words: category; faces; fMRI; MVPA; object
Introduction Neuroimaging studies have shown that discrete regions of the ventral visual pathway are specialized for different categories of objects. For example, some regions are more responsive to faces than to images of nonface objects (Kanwisher et al., 1997), whereas other regions are selective for images of places (Epstein and Kanwisher, 1998), body parts (Downing et al., 2001), visually presented words (Cohen et al., 2000), and inanimate objects (Malach et al., 1995). This selectivity has been regarded as characteristic of a modular organization in which distinct areas are responsible for processing functionally distinct categories of the visual stimulus (Kanwisher, 2010). Despite the evidence for category selectivity in the ventral visual pathway, specialized regions have only been reported for a limited number of object categories (Downing et al., 2006; Op de Beeck et al., 2008). Other studies Received Dec. 17, 2013; revised March 18, 2014; accepted April 13, 2014. Author contributions: G.E.R. and T.J.A. designed research; G.E.R. and T.J.A. performed research; D.M.W., T.H., and T.J.A. contributed unpublished reagents/analytic tools; G.E.R. and T.J.A. analyzed data; G.E.R., D.M.W., T.H., and T.J.A. wrote the paper. This work was supported by a grant from the Wellcome Trust (WT087720MA). We thank Bryony James for her help on the early stages of this project. We also thank Alex Wade, Andy Young, Tony Morland, and two anonymous reviewers for helpful comments on this manuscript. The authors declare to financial competing interests. This article is freely available online through the J Neurosci Author Open Choice option. Correspondence should be addressed to Timothy J. Andrews, Department of Psychology and York Neuroimaging Centre, University of York, York YO10 5DD, UK. E-mail:
[email protected]. DOI:10.1523/JNEUROSCI.5265-13.2014 Copyright © 2014 Rice et al. This is an Open Access article distributed under the terms of the Creative Commons Attribution License (http://creativecommons.org/licenses/by/3.0), which permits unrestricted use, distribution and reproduction in any medium provided that the original work is properly attributed.
provide support for a more distributed categorical organization. For example, it has been shown that the spatial pattern of response across the entire ventral stream can distinguish a much greater range of object categories (Haxby et al., 2001; Spiridon and Kanwisher, 2002; Cox and Savoy, 2003; Kriegeskorte et al., 2008). Indeed, the ability of the pattern to discriminate particular object categories is still evident when the most category-selective voxels were removed from the analysis. Although these studies show robust and reliable patterns of response to different object categories in the ventral visual pathway, it is not clear if more basic principles underpin these patterns of response. Evidence for larger scale patterns of response across the ventral visual pathway have been found for the animacy (Chao et al., 1999), real-world size (Konkle and Oliva, 2012), and the location in the visual field (Levy et al., 2001; Brewer et al., 2005; Arcaro et al., 2009) of visual objects. However, it is unclear how these factors explain the stronger category-selective patterns of response (Op de Beeck et al., 2008). A potential answer to this question was proposed by O’Toole et al. (2005), who showed that the capacity to discriminate neural responses to images in one category from those of another could be predicted by corresponding discriminations based on image properties. These results suggest that a purely category-based account of these patterns is incomplete. However, the ability to discriminate one category from another can depend on local features of image or brain activity rather than the pattern as a whole. To understand the relationship between low-level image properties and patterns of neural response it is necessary to compare the similarity of entire patterns. Moreover, this relationship should still be ev-
Rice et al. • Properties of Visual Objects Predict Patterns of Neural Response
8838 • J. Neurosci., June 25, 2014 • 34(26):8837– 8844
ident in comparisons between images that do not share a category. The aim of the current study was to compare global low-level image properties with patterns of neural response across the whole ventral visual pathway. If patterns of response are based on categorical properties of the stimulus, any similarities in responses to different objects should only reflect high-level relationships between categories to which they belong. On the other hand, if image properties play an important role, the response to different objects should be better explained in terms of their low-level characteristics.
Materials and Methods Participants Data were collected from 40 participants (30 females; mean age, 23). Twenty participants took part in Experiment 1 and 20 participants took part in Experiment 2. All observers had normal or corrected-to-normal vision. Written consent was obtained for all participants and the study was approved by the York Neuroimaging Centre Ethics Committee. All images (approximately 8° ⫻ 8°) were presented in grayscale and were back projected onto a screen located inside the bore of the scanner, ⬃57 cm from the participants’ eyes. Experiment 1 had five different object categories: bottle, chair, face, house, and shoe. Examples of images from each condition are shown in Figure 1. Images were presented on a mid-gray background. Face images from Experiment 1 were taken from the Radboud Face Database. Stimuli were presented with a blocked design. There were six images from one stimulus condition in each block. Each image was presented for 800 ms and followed by a 200 ms blank screen, resulting in a total block length of 6 s. Stimulus blocks were separated by a 9 s gray screen with a central fixation cross. There were eight runs in the scan. In each run, each of the five categories was shown in a pseudorandomized order to ensure that each condition was presented evenly across the scan. Different exemplars of each stimulus condition were used in all blocks. The stimulus conditions for Experiment 2 included exemplars from one category (faces). A face image was taken from each of the following familiar identities: Brad Pitt, David Beckham, Gary Lineker, Rowan Atkinson, Tom Cruise, and Tom Hanks. In all other respects, the design and procedure was identical to the first experiment.
Figure 1.
Examples of images from the different object categories: bottles, chairs, faces, houses, and shoes.
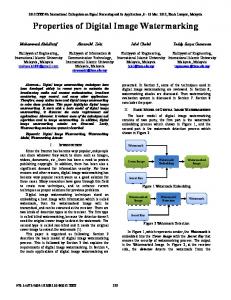
Figure 2. Schematic diagram of pattern analysis procedure. A LOPO method was used to measure patterns of response to different stimulus conditions. In this analysis, the pattern of response elicited by one participant is compared with the pattern generated by a group analysis of all remaining participants. This procedure is repeated for all combinations of stimulus conditions and participants. This example shows the response to faces from an individual participant and the group. This cross-validation analysis was used to ask whether the patterns of response to different object categories are consistent across participants.
fMRI data acquisition and analysis The experiment was performed using a GE 3 T HD Excite MRI scanner at the York Neuroimaging Centre at the University of York. An 8-channel, phased-array head coil (GE) tuned to 127.4 MHz was used to acquire MRI data. A gradient-echo EPI sequence was used to collect data from 38 contiguous axial slices. (TR ⫽ 3 s, TE ⫽ 25 ms, FOV 28 * 28 cm, matrix size ⫽ 128 * 128, slice thickness 3 mm). These were coregistered onto a T1-weighted anatomical image (1 ⫻ 1 ⫻ 1 mm) from each participant. To improve registrations, an additional T1-weighted image was taken in
the same plane as the EPI slices. Finally, individual participant data were registered to the standard brain (MNI 152). Statistical analysis of the fMRI data was performed using FEAT in the FSL toolbox (http://www.fmrib.ox.ac.uk/fsl). The first three volumes (9 s) of each scan were removed to minimize the effects of magnetic saturation, and slice-timing correction was applied. Motion correction was followed by temporal high-pass filtering (cutoff, 0.01 Hz) and spatial smoothing 6 mm (Gaussian, FWHM). Regressors for each condition in
Rice et al. • Properties of Visual Objects Predict Patterns of Neural Response
J. Neurosci., June 25, 2014 • 34(26):8837– 8844 • 8839
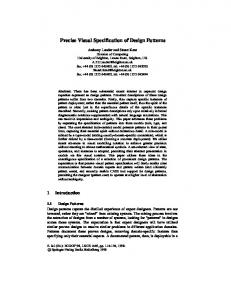
other than to responses to different categories. Pearson correlation was used to determine the similarity of the patterns across all combinations of object categories. To avoid any assumptions about the functional organization of the ventral stream, we used anatomical masks defined by the Harvard Oxford Atlas. These masks included: lateral occipital cortex– inferior, middle temporal– temporal occipital, inferior temporal– temporal occipital, fusiform– occipital, fusiform–temporal occipital, fusiform–posterior, parahippocampal– posterior, lingual, superior temporal– posterior, superior temporal–anterior, middle temporal– posterior, middle temporal–anterior, inferior temporal–posterior, inferior temporal–anterior, fusiform–anterior, parahippocampal–anterior, and the temporal pole. The location of the individual masks is shown in Figure 3. The ventral visual pathway mask was a concatenation of these individual anatomical masks. The ability to discriminate patterns of response to specific object categories or to specific exemplars of an object category was calculated by determining whether the withincondition correlations were greater than the between-condition correlations. An arcsin square root transformation was performed on correlation values before they were entered into repeated-measures ANOVAs. Correlation between patterns of neural response and image properties. Finally, we asked whether the patterns of neural response in Experiments 1 and 2 could be explained by the image statistics of the visual objects. The image statistics of each object were computed using the GIST descriptor (http://people.csail.mit. edu/torralba/code/spatialenvelope/). For each image, a vector of 512 values was obtained by passing the image through a series of Gabor filters across eight orientations and four spatial frequencies, and windowing the filtered images along a 4 ⫻ 4 grid (Fig. 4). Each vector represents the image in terms of the spatial frequenFigure 3. Location of regional masks in the ventral visual pathway. The ventral stream mask was based on a concatenation of cies and orientations present at different positions across the image. A cross-validation the individual anatomical masks. procedure was used to determine how similar individual objects were to the average of each object category. GIST descriptors were averthe general linear model were convolved with a gamma hemodynamic aged across all but one of the images within each category of object. These response function. This generated parameter estimates for each condiaverage descriptors were then compared with each unique image creating tion in each voxel across the entire scan. within- and between-category correlations for each combination of obThe reliability of the neural patterns of response was determined using ject category. the correlation-based multivoxel pattern analysis (MVPA) method deThe correlation values for the GIST descriptor across different object vised by Haxby et al. (2001). To determine whether the pattern of recategories were then compared with the corresponding correlation valsponse to different object categories generalized across individuals, we ues in the fMRI pattern of response to different object categories. This adapted the method so that the pattern of response to each condition in generated a group r value. The significance of the correlation was assessed an individual participant was compared with the pattern of response by determining the reliability of the r value across all subjects. To deterfrom the group (Fig. 2). The parameter estimate for each regressor was mine whether the correlations depended on the difference between taken as a measure of response relative to baseline in each voxel across the within-category and between-category values, we removed the withinentire scan. The mean response in each voxel across all conditions was category correlations and repeated the analysis. This analysis provided a subtracted from the response to each condition. The group pattern was stronger test of whether the low-level image properties influenced the derived by entering the remaining 19 participants’ data into a higher level pattern of response to different objects, because the pattern of response group analysis (mixed effects, FLAME; http://www.fmrib.ox.ac.uk/fsl). cannot be predicted by category. The group response was then compared with the data from the individual who was omitted from the group. For each comparison, this “leave one Results participant out” (LOPO) method was repeated 20 times with a different Experiment 1 participant being compared with the group each time. If a given stimulus In Experiment 1, we determined the relationship between lowcategory evoked a distinct pattern of activity, then independent observalevel properties of objects and the patterns they elicit in the ventions of the response to that category should be more similar to each
8840 • J. Neurosci., June 25, 2014 • 34(26):8837– 8844
Rice et al. • Properties of Visual Objects Predict Patterns of Neural Response
tral visual pathway. First, we measured the patterns of response to different object categories across the ventral visual pathway. Figure 5 shows distinct topographic patterns of response to each object category across the ventral visual pathway. We then compared the similarity of these topographic patterns across participants using MVPA. Figure 6A shows the correlation matrix for all combinations of object category. To quantify the reliability of these patterns of activation, a two-way ANOVA with Comparison (withincategory, between-category) and Category (bottle, chair, face, house, and shoe) was run on the correlations from the ventral visual pathway. We found that the withincategory (e.g., face–face) patterns of fMRI response were significantly more positively correlated than the betweencategory (e.g., face– house) patterns of Figure 4. Schematic illustration of the calculation of a GIST descriptor for an example image. A series of Gabor filters across eight response (F(1,19) ⫽ 283.3, p ⬍ 0.001). orientations and four spatial frequencies are applied to the image. Each of the resulting 32 filtered images is then windowed along However, we also found a significant a 4 ⫻ 4 grid to give a final GIST descriptor of 512 values (right). Comparison * Category interaction (F(4,76) ⫽ 18.6, p ⬍ 0.001). This reflected differences between the within-category and between-category correlations for each object category (within-between: Bottle: t(19) ⫽ 7.83, p ⬍ 0.001; Chair: t(19) ⫽ 7.04, p ⬍ 0.001; Face: t(19) ⫽ 15.05, p ⬍ 0.001; House: t(19) ⫽ 16.43, p ⬍ 0.001; Shoe: t(19) ⫽ 9.20, p ⬍ 0.001). This suggests that there was systematic variation in the magnitude of the within-category and between-category correlations across different object categories. To determine whether the variance in the patterns of neural response could be explained by differences in the image statistics of different object categories, we measured the low-level properties of all images in the fMRI experiment. The image statistics of each object were computed using the GIST descriptor (Oliva and Torralba, 2001). Using the GIST descriptor, we calculated the average orientation energy at different spatial frequencies and spatial positions within each object category. We then determined the within- and between-category correlations in GIST values across images. Figure 6B shows that there were higher correlations in the image properties for within-category Figure 5. Topographic patterns of response to different object categories (left) in the ventral visual pathway. Red/yellow and compared with between-category images, blue/light blue colors represent positive and negative fMRI responses relative to the mean response across all objects. The patterns but the magnitude of this difference or response are restricted to the combined ventral visual pathway mask (see Fig. 3). Average image properties from each object appears to vary for different object catego- category were described by contour plots of the Fourier power spectra across different spatial locations in the image. ries. We then compared the withincomparisons were removed from the correlation (r ⫽ 0.53, p ⬍ category and between-category correlations for the fMRI 0.001). This finding shows that low-level image properties can response with the corresponding correlations in the image propexplain systematic variation in the patterns of fMRI response erties. We found a strong positive correlation across the ventral regardless of category label. visual pathway (r ⫽ 0.79, p ⬍ 0.001; Fig. 6C). Importantly, the Next, we asked whether this relationship between image propcorrelation between low-level image properties and the neural pattern of response was still evident when the within-category erties and fMRI response varied across different anatomical re-
Rice et al. • Properties of Visual Objects Predict Patterns of Neural Response
J. Neurosci., June 25, 2014 • 34(26):8837– 8844 • 8841
Figure 6. Relationship between fMRI response and low-level image properties. Correlation matrices showing the within-category and between-category correlations in (A) fMRI response across the ventral visual pathway and (B) the image properties of different object categories. C, Scatter plot showing a strong positive correlation (r ⫽ 0.79) between the correlation matrices in A and B, demonstrating that patterns of fMRI response are closely linked to low-level image properties.
gions within the ventral stream. Figure 7 shows that there was a significant positive relationship between the patterns of response and the image properties in the Temporal Pole (r ⫽ 0.54, p ⬍ 0.008), Middle Temporal Gyrus–Temporal Occipital (0.67, p ⬍ 0.001), Inferior Temporal Gyrus–Posterior (r ⫽ 0.58, p ⬍ 0.006), Inferior Temporal Gyrus–Temporal Occipital (r ⫽ 0.63, p ⬍ 0.001), Lateral Occipital (r ⫽ 0.66, p ⬍ 0.001), Parahippocampal Gyrus–Posterior (r ⫽ 0.61, p ⬍ 0.001), Lingual (r ⫽ 0.72, p ⬍ 0.001), Fusiform Gyrus–Posterior (r ⫽ 0.59, p ⬍ 0.001), Fusiform Gyrus–Temporal Occipital (r ⫽ 0.66, p ⬍ 0.001), and Fusiform Gyrus–Occipital (r ⫽ 0.74, p ⬍ 0.001) regions. When the within-category comparisons were removed from the analysis, the Inferior Temporal Gyrus– Temporal Occipital (r ⫽ 0.64, p ⬍ 0.001), Lateral Occipital (r ⫽ 0.57, p ⬍ 0.001), Lingual (r ⫽ 0.66, p ⬍ 0.001), Fusiform Gyrus–Temporal Occipital (r ⫽ 0.35, p ⬍ 0.01), and Fusiform Gyrus–Occipital (r ⫽ 0.63, p ⬍ 0.001) regions showed significant positive correlations. Finally, we asked whether the neural patterns of response to complex images in early visual cortex can also be predicted by the low-level properties of the image. We found significant correlations were evident for the intracalcarine (r ⫽ 0.69, p ⬍ 0.001), supracalcarine (r ⫽ 0.37, p ⬍ 0.01), and occipital pole (r ⫽ 0.64, p ⬍ 0.001) regions.
Figure 7. Correlation between fMRI response to different object categories and GIST description across subregions of the ventral visual pathway. The scatter plots show variation in the way that low-level image properties described by the GIST can explain the pattern of response across the ventral visual pathway.
Experiment 2 In Experiment 2, we asked whether lowlevel image properties could also explain variation in the pattern of response to individual exemplars from one object category (faces). We measured fMRI patterns
Rice et al. • Properties of Visual Objects Predict Patterns of Neural Response
8842 • J. Neurosci., June 25, 2014 • 34(26):8837– 8844
Figure 8. Relationship between fMRI response and low-level image properties of exemplars from one category (faces). Correlation matrices showing the within-category and between-category correlations in (A) the fMRI response across the ventral visual pathway and (B) the image properties of different faces. C, Scatter plot showing the correlation between the correlation matrices in A and B. These results show that the low-level image properties are able to predict the topographic pattern of response to exemplars of a single object category (r ⫽ 0.44), although the relationship is not as strong when compared with exemplars from different object categories (Fig. 6).
of response to six different face images. Figure 8A shows the correlation matrix for all combinations of face images. To quantify the reliability of the patterns of fMRI response to each face image, a two-way ANOVA with Comparison and Face as the main factors was used. We found a main effect of comparison that was due to larger within-exemplar compared to betweenexemplar correlations (F(1,19) ⫽ 21.01, p ⬍ 0.001). This shows that pattern of response across the ventral visual pathway can discriminate different facial identities ( Kriegeskorte et al., 2007; Natu et al., 2010; Nestor et al., 2011). We also found a significant Comparison*Face interaction (F(5,95) ⫽ 13.83, p ⬍ 0.001). This reflected differences between the within-category and betweencategory correlations for each facial identity (within-between: Brad Pitt: t(19) ⫽ 0.28, p ⫽ 0.782; David Beckham: t(19) ⫽ 1.81, p ⫽ 0.086; Gary Lineker: t(19) ⫽ 2.09, p ⫽ 0.050; Rowan Atkinson: t(19) ⫽ 8.75, p ⬍ 0.001; Tom Cruise: t(19) ⫽ 2.79, p ⫽ 0.012; Tom Hanks: t(19) ⫽ ⫺1.33, p ⫽ 0.199). Next, we determined whether low-level differences between faces described by the GIST description could account for the differences in the neural patterns of response. Figure 8B shows the differences in the image properties between the different face exemplars. Finally, we correlated the fMRI response correlations with the corresponding image properties. We found significant correlations between the similarity of neural patterns of response and the image properties for different face images in the ventral pathway (r ⫽ 0.44, p ⬍ 0.001; Fig. 8C). However, no correlation was found between image properties and neural responses when the within-category correlations were removed from the analysis (r ⫽ ⫺0.03, p ⫽ 0.95). These results suggest that a finer scale of cortical organization may be necessary to discriminate exemplars of a single category such as faces. To determine whether there were regional differences, we measured the relationship between fMRI response and image properties across different regions of the ventral visual pathway (Fig. 9). Significant correlations were evident in the Lateral Occipital (r ⫽ 0.27, p ⬍ 0.005), Lingual Gyrus (r ⫽ 0.53, p ⬍ 0.001), Fusiform Gyrus–Temporal Occipital (r ⫽ 0.49, p ⬍ 0.001) and Fusiform Gyrus–Occipital (r ⫽ 0.62, p ⬍ 0.001) regions. However, when the within-category correlations were removed from the analysis, only the Fusiform Gyrus–Occipital region showed a significant correlation between image properties and fMRI response (r ⫽ 0.24, p ⬍ 0.05).
Finally, we asked whether the neural patterns of response to complex images in early visual cortex can also be predicted by the low-level properties of the image. We found significant correlations were only evident in the intracalcarine (r ⫽ 0.53, p ⬍ 0.001) and occipital pole (r ⫽ 0.47, p ⬍ 0.001)
Discussion The aim of this study was to determine whether more basic principles and dimensions than category could underlie the topographic organization of the ventral visual pathway. We found that the patterns of response to images from the same object category were more similar than the patterns of response to objects from different categories. However, there were differences in the magnitude of both the within-category and between-category correlations. Next, we investigated the extent to which this variation in the neural response to different objects could be explained by systematic differences in low-level image properties. We found a strong, linear relationship between the pattern of neural response in the ventral visual pathway and the image statistics of different object categories. These results have important implications for understanding how the ventral visual cortex is organized. A dominant perspective on the organization of this region is that it encodes information based on object category (Kanwisher, 2010). This organization contrasts with the continuous, topographic maps found in early stages of visual processing, which are tightly linked to the properties of the visual image (Hubel and Wiesel, 1968; Wandell et al., 2007). Until now, it has proved difficult to explain how selectivity for object categories suddenly emerges from these low-level representations (Op de Beeck et al., 2008). The strong, linear relationship between low-level image properties and largescale, distributed patterns of neural response, we report, suggests that no explanation may be necessary. Patterns of response at this coarse scale of representation can be explained by low-level properties of the image. These findings are consistent with previous studies that used principal component analysis to show that neural responses to different object categories in inferior temporal cortex can be predicted by variance in the principal components of the images (O’Toole et al., 2005; Baldassi et al., 2013). However, this need not be counter to a categorical representation, given that a category typically contains objects that are visually
Rice et al. • Properties of Visual Objects Predict Patterns of Neural Response
J. Neurosci., June 25, 2014 • 34(26):8837– 8844 • 8843
discontinuous variable. It is possible to change continuously between exemplars from one category (morphing between two faces, for example), because the corresponding features are obvious. However, the corresponding features of exemplars from different categories (e.g., face and house) are less clear. The lowlevel image properties of the GIST descriptor reflect variation in spatial position, orientation, and spatial frequency across the image. With this lower level framework of stimulus representation, it is more straightforward to determine how a continuous map could emerge (Op de Beeck et al., 2008). It is important to note that these representations need not be similar to the way information is represented in lower level regions. Indeed, it seems likely that there will be an over-representation of low-level image properties that are more commonly found in natural images (Op de Beeck et al., 2001; Kayaert et al., 2003). The appearance of discrete regional selectivity may thus emerge from the characteristic combinations of low-level image properties that co-occur in natural stimuli. This conclusion is consistent with other work showing low-level biases in responses of high-level visual regions. For example, spatial frequency (Rajimehr et al., 2011), orientation (Nasr and Tootell, 2012), and shape (Wilkinson et al., 2000) biases, along with visual field representations (Levy et al., 2001; Brewer et al., 2005; Arcaro et al., 2009), have been reported in these regions. We found that neural patterns of response to different objects in lower level visual areas can also be predicted by the Figure 9. Correlation between fMRI response to different faces and GIST description across subregions of the ventral visual low-level properties of the image. This pathway. The scatter plots show variation in the way that low-level image properties described by the GIST can explain the pattern of response to different faces across the ventral visual pathway. It is interesting to note that significant positive correlations were finding is consistent with previous work that has shown that activity in lower level only evident in the Fusiform (Temporal–Occipital, Occipital) and Lingual gyri. visual areas (V1, V2, V3) could be decoded to correctly identify natural images, similar. The key finding from this study is that the correlation using a model derived from estimates of each voxel’s selectivity between the pattern of neural response and the low-level properfor location, spatial frequency, and orientation (Kay et al., 2008). ties was still evident when the within-category correlations were However, previous attempts to characterize the topographic removed from the analysis. If the organization of the ventral viproperties of visual areas beyond this early stage of visual processsual cortex is solely dependent on categorical principles, then the ing have needed to include categorical or semantic information linear relationship between neural and image properties should about the images ( Kriegeskorte et al., 2008; Naselaris et al., 2009). not extend to between-category correlations when the withinThe key result from our study is that, even within these higher category correlations are removed from the analysis. level regions, patterns of activity are parametrically related to lowlevel image properties. This applies even in between-category comOur results provide a novel framework in which to consider parisons, which suggests that such image properties play a the topographic organization of the ventral visual pathway. Prefundamental role in organizing the topography of the ventral stream. vious studies have shown that category-selective patterns of reRegional variation was evident in the correlation between imsponse are robust and reliable within and between individuals age properties of different object categories and fMRI responses (Kanwisher, 2010; Haxby et al., 2011). However, it has remained a substantial challenge to describe the strong categorical specificacross different anatomical regions. Stronger correlations were ity that exists in ventral visual pathway by simpler properties that found in posterior and inferior regions of the ventral visual pathcan be continuously mapped across the cortical surface. A fundaway. Regional variation was also evident when we compared mental problem in this endeavor is that category membership is a fMRI responses and image properties for different exemplars of
8844 • J. Neurosci., June 25, 2014 • 34(26):8837– 8844
one object category (faces). For example, the fusiform gyrus, a region associated with face processing, showed a significant positive correlation between image properties and fMRI responses even when the within-exemplar comparisons were removed from the analysis. This pattern of results was not evident in other anatomical masks, such as the parahippocampal gyrus. These findings are consistent with previous work that showed that patterns of response across the ventral visual pathway are not equipotential in the ability to discriminate different object categories (Spiridon and Kanwisher et al., 2002). Rather, the ability of the pattern to discriminate a specific object category is higher in regions that are more responsive to that category. Our results show that the patterns of fMRI response generalize across participants. Using a modified cross-validation analysis (Haxby et al., 2001), we compared the pattern of response in one participant with the pattern from a group analysis in which that participant was left out (Shinkareva et al., 2008; Poldrack et al., 2009; Haxby et al., 2011). This LOPO approach showed that the topographic patterns of response to different object categories were consistent across individuals. These observations are significant in that they suggest that our findings reflect the operation of consistent, large-scale topographical organizing principles, rather than an arbitrarily distributed representation in each individual. In conclusion, previous neuroimaging studies have revealed strong selectivity for object categories, such as faces, in the human visual system. However, it has never been clear whether this regional selectivity is driven solely by tunings to discrete object categories or whether it reflects tunings for continuous low-level features that are common to images from a particular category. Here, we show a clear link between patterns of response in higher level visual cortex and the image statistics characteristic of each category that cannot be explained solely in terms of discrete categorical organization.
References Arcaro MJ, McMains SA, Singer BD, Kastner S (2009) Retinotopic organization of human ventral visual cortex. J Neurosci 29:10638 –10652. CrossRef Medline Baldassi C, Alemi-Neissi A, Pagan M, Dicarlo JJ, Zecchina R, Zoccolan D (2013) Shape similarity, better than semantic membership, accounts for the structure of visual object representations in a population of monkey inferotemporal neurons. PLoS Comput Biol 9: e1003167. CrossRef Medline Brewer AA, Liu J, Wade AR, Wandell BA (2005) Visual field maps and stimulus selectivity in human ventral occipital cortex. Nat Neurosci 8:1102– 1109. CrossRef Medline Chao LL, Haxby JV, Martin A (1999) Attribute-based neural substrates in temporal cortex for perceiving and knowing about objects. Nat Neurosci 2:913–919. CrossRef Medline Cohen L,Dehaene S, Naccache L, Lehe´ricy S, Dehaene-Lambertz G, He´naff MA, Michel F (2000) The visual word form area: spatial and temporal characterization of an initial stage of reading in normal subjects and posterior split-brain patients. Brain 123:291–307. CrossRef Medline Cox DD, Savoy RL (2003) Functional magnetic resonance imaging (fMRI) “brain reading”: detecting and classifying distributed patterns of fMRI activity in human visual cortex. Neuroimage 19:261–270. CrossRef Medline Downing PE, Jiang Y, Shuman M, Kanwisher N (2001) A cortical area selective for visual processing of the human body. Science 293:2470 –2473. CrossRef Medline Downing PE, Chan AW, Peelen MV, Dodds CM, Kanwisher N (2006) Domain specificity in visual cortex. Cereb Cortex 16:1453–1461. Medline Epstein R, Kanwisher N (1998) A cortical representation of the local visual environment. Nature 392:598 – 601. CrossRef Medline Haxby JV, Gobbini MI, Furey ML, Ishai A, Schouten JL, Pietrini P (2001) Distributed and overlapping representations of faces and objects in ventral temporal cortex. Science 293:2425–2430. CrossRef Medline
Rice et al. • Properties of Visual Objects Predict Patterns of Neural Response Haxby JV, Guntupalli JS, Connolly AC, Halchenko YO, Conroy BR, Gobbini MI, Hanke M, Ramadge PJ (2011) A common, high-dimensional model of the representational space in human ventral temporal cortex. Neuron 72:404 – 416. CrossRef Medline Hubel DH, Wiesel TN (1968) Receptive fields and functional architecture of monkey striate cortex. J Physiol 195:215–243. Medline Kanwisher N (2010) Functional specificity in the human brain: a window into the functional architecture of the mind. Proc Natl Acad Sci U S A 107:11163–11170. CrossRef Medline Kanwisher N, McDermott J, Chun MM (1997) The fusiform face area: a module in human extrastriate cortex specialized for face perception. J Neurosci 17:4302– 4311. Medline Kayaert G, Biederman I, Vogels R (2003) Shape tuning in macaque inferior temporal cortex. J Neurosci 23:3016 –3027. Medline Kay KN, Naselaris T, Prenger RJ, Gallant JL (2008) Identifying natural images from human brain activity. Nature 452:352–355. CrossRef Medline Konkle T, Oliva A (2012) Real-world size organisation of object responses in occipitotemporal cortex. Neuron 74:1114 –1124. CrossRef Medline Kriegeskorte N, Mur M, Ruff DA, Kiani R, Bodurka J, Esteky H, Tanaka K, Bandettini PA (2008) Matching categorical object representations in inferior temporal cortex of man and monkey. Neuron 60:1126–1141. CrossRef Medline Kriegeskorte N, Formisano E, Sorger B, Goebel R (2007) Individual faces elicit distinct response patterns in human anterior temporal cortex. Proc Natl Acad Sci U S A 104:20600 –20605. CrossRef Medline Levy I, Hasson U, Avidan G, Hendler T, Malach R (2001) Center–periphery organization of human object areas. Nat Neurosci 4:533–539. Medline Malach R, Reppas JB, Benson RR, Kwong KK, Jiang H, Kennedy WA, Ledden PJ, Brady TJ, Rosen BR, Tootell RB (1995) Object-related activity revealed by functional magnetic-resonance-imaging in human occipital cortex. Proc Natl Acad Sci U S A 92:8135– 8139. CrossRef Medline Naselaris T, Prenger RJ, Kay KN, Oliver M, Gallant JL (2009) Bayesian reconstruction of natural images from human brain activity. Neuron 63: 902–915. CrossRef Medline Nasr S, Tootell RB (2012) A cardinal orientation bias in scene-selective visual cortex. J Neurosci 32:14921–14926. CrossRef Medline Natu VS, Jiang F, Narvekar A, Keshvari S, Blanz V, O’Toole AJ (2010) Dissociable neural patterns of facial identity across changes in viewpoint. J Cogn Neurosci 22:1570 –1582. CrossRef Medline Nestor A, Plaut DC, Behrmann M (2011) Unraveling the distributed neural code of facial identity through spatiotemporal pattern analysis. Proc Natl Acad Sci U S A 108:9998 –10003. CrossRef Medline Oliva A, Torralba A (2001) Modelling the shape of the scene: a holistic representation of the spatial envelope. Int J Comput Vis 42:145–175. CrossRef Op de Beeck HP, Haushofer J, Kanwisher N (2008) Interpreting fMRI data: maps, modules and dimensions. Nat Rev Neurosci 9:123–135. CrossRef Medline Op de Beeck H, Wagemans J, Vogels R (2001) Inferotemporal neurons represent low-dimensional configurations of parameterized shapes. Nat Neurosci 4:1244 –1252. CrossRef Medline O’Toole AJ, Jiang F, Abdi H, Haxby JV (2005) Partially distributed representations of objects and faces in ventral temporal cortex. J Cogn Neurosci 17:580 –590. CrossRef Medline Poldrack RA, Halchenko YO, SJ (2009) Decoding the large-scale structure of brain function by classifying mental states across individuals. Psychol Sci 20:1364 –1372. CrossRef Medline Rajimehr R, Devaney KJ, Bilenko NY, Young JC, Tootell RB (2011) The “Parahippocampal Place Area” Responds Preferentially to High Spatial Frequencies in Humans and Monkeys. PLoS Biol. 9:e1000608. CrossRef Medline Shinkareva SV, Mason RA, Malave VL, Wang W, Mitchell TM, Just MA (2008) Using fMRI brain activation to identify cognitive states associated with perception of tools and dwellings. PLoS One 3:e1394. CrossRef Medline Spiridon M, Kanwisher N (2002) How distributed is visual category information in human occipito-temporal cortex? An fMRI study. Neuron 35: 1157–1165. CrossRef Medline Wandell BA, Dumoulin SO, Brewer AA (2007) Visual field maps in human cortex. Neuron 56:366 –383. CrossRef Medline Wilkinson F, James TW, Wilson HR, Gati JS, Menon RS, Goodale MA (2000) An fMRI study of the selective activation of human extrastriate form vision areas by radial and concentric gratings. Curr Biol 10:1455–1458. CrossRef Medline