SCAN (Speech Content based Audio Navigator) is a spoken document retrieval system integrating speaker-independent, large-vocabulary speech recognition ...
SCAN - Speech Content Based Audio Navigator: A Systems Overview John Choi, Don Hindle, Julia Hirschberg, Ivan Magrin-Chagnolleau, Christine Nakatani, Fernando Pereira, Amit Singhal, Steve Whittaker AT&T Labs - Research
ABSTRACT 2. SPEECH RECOGNITION SCAN (Speech Content based Audio Navigator) is a spoken document retrieval system integrating speaker-independent, large-vocabulary speech recognition with information-retrieval to support query-based retrieval of information from speech archives. Initial development focused on the application of SCAN to the broadcast news domain. This paper provides an overview of this system, including a description of its graphical user interface which incorporates machine-generated speech transcripts to provide local contextual navigation and random access for browsing large speech databases.
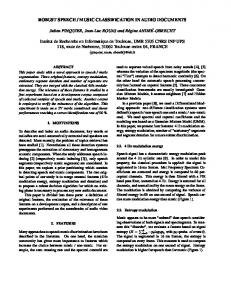
1. INTRODUCTION We present an overview of SCAN (Speech Content based Audio Navigator), a system developed at AT&T Labs-Research which supports the retrieval, browsing and navigation of speech archives. The system consists of three components: (i) a speaker-independent large-vocabulary speech recognition engine which segments the speech archive and generates transcripts, (ii) an information-retrieval engine which indexes the transcriptions and formulates hypotheses regarding document relevance to user-submitted queries and (iii) a graphical-user-interface which supports search and local contextual navigation based on the machine-generated transcripts and graphical representations of query-keyword distribution in the retrieved speech transcripts. An overview of the system architecture is provided in Figure 1.
Speech Corpus
Intonational Phrase Boundary Detection
User Interface
Classification
Recognition
Figure 1: architecture
Transcripts
Information Retrieval
Overview of the spoken document system
Previous work on information retrieval from speech databases include a system for Swiss radio news [14], a system for a digital video library [15], radio news broadcast retrieval using subword units [9], a Video Mail Retrieval system [4,5] and a number of systems developed for the Text Retrieval Conference Spoken Document Retrieval track [13], inter alia.
The speech recognition component of SCAN includes an intonational phrase boundary detection module and a classification module. These subcomponents preprocess the speech data before passing the speech to the recognizer itself.
2.1. Intonational Phrase Boundary Detection The intonational phrase boundary detection module analyzes and classifies the incoming speech stream every 20 msec as either occurring within an intonational phrase or within a break between intonational phrases [3]. This classification is driven by a regression tree model [1] which take as observation vectors values for fundamental frequency, RMS energy and autocorrelation-peaks. The resulting intonational phrases serve as recognition units by breaking up the incoming speech stream into smaller segments for decoding. In addition, the phrases serve as prosodically wellformed browsing and play-back units in the user-interface. This is arguably preferable to using fixed-size segments, which might begin and terminate within words and otherwise form prosodically ill-formed segments for play-back.
2.2. Channel Condition Classifier The intonational phrases are subsequently passed to a classifier designed to detect one of four different channel conditions: (i) wideband (0-8kHz) speech recorded in a studio environment with no background noise; (ii) wideband (0-8kHz) speech recorded in non-studio environments, including field conditions, with no background noise; (iii) narrowband (0-4kHz) speech recorded from telephone interviews and (iv) speech with background noise and/or music. The training data come from the 1996 broadcast news corpus distributed by the Linguistic Data Consortium and that comprised the HUB4 continuous speech recognition task for that year. The decision to apply one of potentially several acoustic models is based on this classification. The classifier itself is based on full covariance Gaussian mixture models, initialized using vector quantization and trained using the Expectation-Maximization algorithm [7]. Input consists of 31-dimensional vectors of filter-bank coefficients in dB units, derived from Hamming windowed frames of 20 msec with a frame advance rate of 10 msec. The filter-bank coefficients are computed by taking the base 10 logarithm from short term power spectra in the 0-8kHz band from a mel-scaled bank of
average number of unique terms in a document, computed across the entire collection. The user-queries are also preprocessed in the manner described above and indexed using ltn weights [12]:
filters.
2.3. Recognizer The core speech recognizer is based on a standard timesynchronous beam search algorithm and continuous-density, left-to-right, three-state, context-dependent HMM phone models. The transduction from phone HMMs to word sequences is implemented in the general framework of weighted finite-state transducers [14,17]. The decoder supports multiple recognition hypotheses in the form of word lattices, derived from model lattices by transducer composition.
( 1 + ln ( tf ) ) * idf where inter document frequency idf is defined as the ratio of the total number of documents in the collection N and the number of documents df that contain the word, scaled again by a length normalization factor ln: ln ( N / df )
Acoustic observations serving as input to the HMMs consist of 39-dimensional vectors taken from 20 msec analysis frames with 10 msec overlap. Each acoustic vector contains the first 13 normalized mel-frequency cepstral coefficients, along with their first and second time derivatives.
An inner-product similarity measure is used to assess the relevance of a document vector Di and a query vector Q
We have experimented with several acoustic models trained on broadcast news data, partitioning the training data in terms of differing channel conditions. Training iterations for all the acoustic models consist of eigenvector rotations to decorrelate the training data, k-means clustering, normalization of means and variances based on maximum-likelihood, and Viterbi alignment to resegment the data. The output probability distributions in the HMMs consist of a weighted mixture of Gaussians with diagonal covariance. The number of components per mixture varies from model to model, but ranges between 4 and 12.
where tj is a term present in both the query and the document, qj is the weight of term tj in the query, and dij is its weight in document i. The transcripts are ranked by their decreasing similarity to the query and presented to the user in this order.
Sim ( Q,Di ) =
qj Σ common terms tj
*
dij
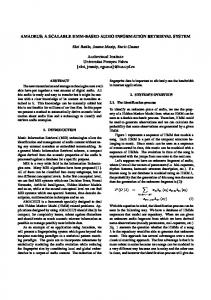
4. USER INTERFACE The graphical-user-interface is built on the principle of "what you see is almost what you hear" (WYSIAWYH) and uses the ASR transcripts extensively. The term “almost” is included because the machine-generated transcripts are errorful.
We have also experimented with several language models, varying in vocabulary size from 20k to 237k. Standard Katz backoff trigram models [6] are constructed from appropriate training corpora. Trigrams and bigrams are then discarded from the model in cases where the difference between the model prediction and backed-off prediction is less than a threshold T: f * (Po * Pb) < T where f is the observed n-gram frequency, Po is the n-gram prediction and Pb is the backed-off (n-1)-gram prediction.
3. INFORMATION RETRIEVAL The information-retrieval engine used in the system is based on a vector space model which generates weighted term (word) vectors for a given transcript and is known as SMART in the information retrieval community [2,11]. SMART initially preprocesses the transcripts by (i) tokenizing the text into individual words, (ii) removing common functions words and (iii) running morphological stemming. The term vectors are then weighted using the lnu term weighting scheme [12]: ( 1 + ln ( tf ) ) / ( 1 + ln ( average tf ) ) 0.8 * pivot + 0.2 * ( # of unique terms ) where term frequency tf is the number of times a term occurs in the text, average tf is the average of the tfs of all the terms in a document, ln is a length normalization factor, and pivot is the
Figure 2: The SCAN graphical user interface. The interface, presented in Figure 2, consists of three
Associated with each document in the ranked list is an Overview display and a Transcript display. The Overview display (middle of Figure 2) provides the user with information about the distribution of query-keywords within the transcripts associated with the selected document. A graphical rendering of this information allows the user to quickly assess regions within the transcripts that are “hotspots” insofar as they exhibit high query-keyword density or occurrences of a certain word or word combinations. This information is rendered as a histogram in Figure 2. The x-axis represents the length of the selected audio document, with the bin-boundaries corresponding to the intonational phrase boundaries detected at recognition time. Within each intonational phrase, we denote the occurrence of a query-keyword in the phrase by adding a color-coded block. The height of the block is determined by the term weight computed by the information-retrieval engine for the specific query-keyword. The query-keywords themselves are displayed to the left of the histogram, again color-coded for easy identification with the blocks in the histogram. Each bin in the histogram is linked to the audio associated with the intonational phrase; simply clicking on a bar in the histogram, or on the baseline in cases of an empty bin, will trigger audio play-back of the corresponding intonational phrase. The final component of our interface consists of a display of the ASR transcripts (bottom of Figure 2) associated with the document that the user has selected. Within the transcripts, words matching the keywords from the query are color-hilighted to facilitate quick visual scanning. The transcripts are also formatted so that the text associated with separate intonational phrases are delimited in paragraph type breaks. Again, each paragraph is linked to the audio associated with the intonational phrase; simply clicking on a paragraph will trigger audio playback of the corresponding intonational phrase. Both the Overview and Transcript components are designed to provide the user with information about the internal structure and content of the selected transcript. The aim of this design is to afford the user quick access to the underlying speech at any point in the speech document. By visually rendering the underlying speech in terms of keyword distribution and machine-generated transcripts, the interface allows the user to fully exploit the human ability to rapidly scan and browse complex visual data to identify the relevant portions of the lengthy audio material that they wish to listen to. Each transcript can be viewed as a visual analogue to the speech story, and it can be used as a partial index to access relevant speech information. The visual analogue also allows us to exploit existing textual layout conventions, to provide some structure to the underlying speech. Furthermore, the Transcript component allows the played speech to be interpreted in context: i.e., users can scan the transcript to see what was said before and after the soundbite they are currently playing. They no longer hear an isolated soundbite with no idea of where the played speech occurs in relation to the whole document.
Finally, providing the transcript enables users to exercise “checks” to determine the relevance of a given document: by quickly scanning it they can determine whether problems in either speech recognition or information retrieval led to the selection of an irrelevant document.
5. SYSTEM ASSESSMENT To provide an assessment of the effectiveness of informationretrieval, we present results from two tasks. The first is the TREC-6 SDR task [13] which involves 49 known-item userqueries where each query has associated with it a unique document in a collection of 1452 documents. Performance on the task can be measured by simply counting the number of queries for which the target document is ranked within some K ranks. Figure 3 presents these counts for K=1, i.e., when the correct document was ranked #1 by the information-retrieval engine, and for K=5, i.e., when the correct document was ranked within the top 5 ranked documents. Results are presented for retrieval based on both machine-generated transcripts and human-generated transcripts. 50 ASR Transcripts 45 Human Transcripts CORRECT DOCUMENTS RETRIEVED
components: (i) Search, (ii) Overview and (iii) Transcripts. The Search component (top of Figure 2) accommodates user submitted queries. The information returned by the information-retrieval engine is displayed as a ranked list of (potentially) relevant documents. Each of the items displayed in the ranked list provide links to the corresponding documents.
40 35 30 25 20 15 10 5 0 1
5 K-RANK
Figure 3: Information retrieval accuracy on a known-item task based on ASR transcripts and human transcripts. While the TREC-6 SDR task affords us a benchmark with which to compare our system performance against other systems on the same task, it is widely held that the task is too restricted in its scope, due primarily to the small size of the corpus over which retrieval is being conducted, to be a robust measure of spoken document retrieval performance. To compensate for this, we exercised the system further, devising another task in which we selected 94 AP Newswire headlines from the same period that the broadcast news archives were collected. These headlines were then used as user queries. In lieu of relevance assessments for these headlines, which were not available, we simply compared the retrieval results from the machine-generated transcripts with those from the human-generated transcripts. In doing so, we assume that retrieval from human-generated transcripts serves as an upper-bound on our retrieval performance; i.e., average precision is 100%. Having made this assumption, we can calculate average precision based on
retrieval from the machine-generated transcripts and compare this to the upper-bound. 4. The results from the AP headlines task is illustrated in Figure 4, where average precision based on the machine-generated transcripts is plotted as a function of K ranks, where K={1, 5, 10, 20, 30, 50, 100}. The top curve represents average precision when the word-error-rate is 30.0%. For comparison, another curve is plotted which represents average precision when the word-error-rate is 42.7%. This test shows that with a word-error-rate of 30.0%, we perform approximately 81% as well as we would if the transcripts were perfect. This test also shows that better recognition results in higher precision retrieval.
5.
6.
85
Average Precision
80
7.
75 70
8.
65
WER = 30.0% 60
WER = 42.7%
9.
55 50 1
5
10
20
30
50
100
10.
K Top Ranks Assumed Relevant
Figure 4: Average precision based on ASR transcripts at different word-error-rates for the AP headlines task.
11.
6. CONCLUSION
12.
We have described a system for querying and retrieving information from speech databases which integrates speech recognition and information retrieval technologies. Preliminary assessments conducted on tasks in the broadcast news domain are encouraging and we continue to explore techniques for improving information retrieval precision through the use of word lattices. We have also described an interface which allows users to identify relevant regions of the underlying speech without having to listen to the entire speech document and are conducting usability tests on this interface.
7. REFERENCES 1.
2.
3.
Breiman, L., Friedman, J.H., Olshen, R.A., and Stone, C.J., Classification and Regression Trees, Chapman and Hall, 1984. Buckley, C., “Implementation of the SMART information retrieval system”, Technical Report TR85-686, Department of Computer Science, Cornell University, Ithaca, NY, 1985. Hirschberg, J., and Nakatani, C., “Using machine learning to identify intonational segments”, Proceedings of the AAAI Spring Symposium on
13.
14.
15.
Applying Machine Learning to Discourse Processing, 1988, forthcoming. Jones, G.J.F., Foote, J.T., Sparck-Jones, K., and Young, S.J., “Video mail retrieval: The effect of word spotting accuracy on precision”, Proceedings of ICASSP 95, Vol. 1, 1995, pp. 309-312. Jones, G.J.F., Foote, J.T., Sparck-Jones, K., and Young, S.J., “Retrieving spoken documents by combining multiple index sources”, Proceedings of the Nineteenth Annual International ACM SIGIR Conference on Research and Development in Information Retrieval, 1996, pp. 30-38. Katz, S.M., “Estimation of probabilities from sparse data from the language model component of a speech recognizer”, IEEE Transactions on Acoustics, Speech and Signal Processing, 1987, pp. 400-401. Magrin-Chagnolleau, I., Parthasanathy, S., and Rosenberg, A., “Automatic labeling of broadcast news into different sound classes using gaussian mixtures models”, MS in preparation. Mohri, M., Riley, M., Hindle, D., Ljolje, A., and Pereira, F.C.N., “Full expansion of contextdependent networks in large vocabulary speech recognition”, Proceedings of ICASSP 98, 1998. Ng, K., and Zue, V., “Subword unit representations for spoken document retrieval”, Proceedings of Eurospeech 97, 1997, pp. 1607-1610. Pereira, F., and Riley, M., “Speech recognition by composition of weighted finite automata”, In Roche, E., and Schabes, Y., (eds), Finite-State Language Processing, MIT Press, Cambridge, 1997, pp. 431-453. Salton, G., (ed.), The SMART Retrieval System Experiments in Automatic Document Retrieval, Prentice Hall, Inc., Englewood Cliffs, NJ, 1971. Singhal, A., Buckley, C., and Mitra, M., “Pivoted document length normalization”, Proceedings of the Nineteenth Annual International ACM SIGIR Conference on Research and Development in Information Retrieval, 1996, pp. 21-29. Vorhees, E.M., and Harman, D.K., “Overview of the sixth Text Retrieval Conference (TREC-6)”, in Vorhees, E.M., and Karman, D.K. (eds.), Proceedings of the Sixth Text Retrieval Conference (TREC-6), 1998, forthcoming. Wechsler, M., and Schauble, P., “Indexing methods for a speech retrieval system”, in van Rijsbergen, C.J. (ed.), Proceedings of the MIRO Workshop, 1995. Witbrock, M.J., and Hauptmann, A.G., “Using words and phonetic strings for efficient information retrieval from imperfectly transcribed spoken documents”, Proceedings of the 2nd ACM International Conference on Digital Libraries, 1997, pp. 30-35.