use as compute servers for multiprogramming and parallel appli- cation workloads. .... Finally, we used the hardware performance monitor on. DASH [15] to ..... tion, since that is the bottom-line metric for a person using the machine. Next, we ...
Scheduling and Page Migration for Multiprocessor Compute Servers Rohit Chandra, Scott Devine, Ben Verghese, Anoop Gupta, and Mendel Rosenblum Computer Systems Laboratory Stanford University, Stanford CA 94305
Abstract
the dynamically varying and mixed nature of multiprogramming workloads. For example, short jobs may be mixed with longrunning jobs, compute-intensive jobs requiring memory locality may be mixed with I/O intensive jobs, and while at one moment there may only be a single job in the system, a short time later there might be a substantial overload. Each of these different jobs/situations potentially require the system scheduler to make complex choices to get high performance. The second main problem is management of the complex memory hierarchy present in CC-NUMA machines. While cachehits take only a single clock cycle, a miss serviced from local memory may take several tens of cycles, while a remote miss may take over a hundred cycles. The scheduler faces complex choices in deciding whether to migrate processes or data in order to improve locality. Given these characteristics, it is hardly surprising that the scheduling policies of systems with uniform memory access times perform poorly in scalable multiprocessor environments [25], and that new scheduling and page migration policies are needed. Several scheduling and page migration policies for multiprocessor systems have been explored in the literature. Common scheduling approaches include cache affinity [12, 22], gang scheduling [6, 9, 10, 19], processor sets [3], and process control [26] or scheduler activations [1]. These policies have so far been evaluated only in the context of small bus-based multiprocessors with uniform memory access times [1, 24, 25]. Substantial work on page migration policies has also been done [4, 14], but the target of this work has been NUMA machines that are not cache coherent, like the BBN Butterfly. These earlier results from small-scale bus-based machines and non-cache-coherent NUMA machines, unfortunately, are difficult to extrapolate to CC-NUMA multiprocessors. In this paper we evaluate scheduling and page migration policies using a recent CC-NUMA multiprocessor, the Stanford DASH [15]. We target two different multiprogrammed environments—the first consisting primarily of sequential applications, and the second consisting of parallel applications. We have modified the kernel to implement several scheduling policies and a simple page migration policy, and we perform a detailed evaluation of the effectiveness of each. Our results for workloads consisting of sequential applications show that affinity scheduling combined with a simple page migration policy improves the performance of individual applications by as much as a factor of two over the standard Unix scheduler. While previous studies on bus-based machines showed only modest gains with affinity scheduling, we observe much larger gains because of the higher cost of cache misses in a CC-NUMA machine. Our results for parallel applications show that while the more specialized time-slicing and space-partitioning policies outperform the generic UNIX policy, there is no clear winner among them. The winning policy appears to be application specific and depends on importance of data distribution. Finally, our initial experience with page migration for parallel applications indicates
Several cache-coherent shared-memory multiprocessors have been developed that are scalable and offer a very tight coupling between the processing resources. They are therefore quite attractive for use as compute servers for multiprogramming and parallel application workloads. Process scheduling and memory management, however, remain challenging due to the distributed main memory found on such machines. This paper examines the effects of OS scheduling and page migration policies on the performance of such compute servers. Our experiments are done on the Stanford DASH, a distributed-memory cache-coherent multiprocessor. We show that for our multiprogramming workloads consisting of sequential jobs, the traditional Unix scheduling policy does very poorly. In contrast, a policy incorporating cluster and cache affinity along with a simple page-migration algorithm offers up to twofold performance improvement. For our workloads consisting of multiple parallel applications, we compare space-sharing policies that divide the processors among the applications to time-slicing policies such as standard Unix or gang scheduling. We show that space-sharing policies can achieve better processor utilization due to the operating point effect, but time-slicing policies benefit strongly from user-level data distribution. Our initial experience with automatic page migration suggests that policies based only on TLB miss information can be quite effective, and useful for addressing the data distribution problems of space-sharing schedulers.
1
Introduction
While small-scale shared-memory multiprocessors have been available for a long time [17, 18], large-scale shared-memory machines have only recently become available [15, 13]. To achieve scalability these machines have distributed main memory and use a scalable interconnect and directory techniques to provide lowoverhead cache-coherent access to shared data. The fine-grained sharing allowed by cache-coherent non-uniform-memory access (CC-NUMA) machines can significantly broaden the appeal of parallel computing, by enabling such machines to perform well as cost-effective compute-servers for both general-purpose multiprogramming workloads as well as for more traditional supercomputing workloads. Despite the relatively low-overhead communication supported by CC-NUMA machines, achieving high processor utilization for real workloads is not trivial. There are two main problems. First is
To appear in the Sixth International Conference on Architectural Support for Programming Language and Operating Sytems (ASPLOS-VI), San Jose, CA, October 5-7, 1994.
1
that we may be able to use TLB-misses instead of cache-misses for implementing such policies on real multiprocessors. The rest of the paper is organized as follows. We present a brief overview of various scheduling and page migration policies in Section 2. We then describe the architecture that we use and our evaluation framework in Section 3. We analyze sequential workloads in Section 4 and parallel workloads in Section 5. Finally, we conclude in Section 6.
2
better processor utilization) with fewer processors. This is labeled the operating point effect. The process control/scheduler activations approaches [26, 1] are an extension of processor sets in which a parallel application dynamically adjusts its number of active processes to match the number of physical processors assigned to its processor set. As a result the application executes at a more efficient operating point along its speedup curve. Process control is most easily exploited by parallel applications written using the task-queue model of parallelism [1, 5], in which user-level tasks are scheduled onto a number of kernel processes. Adjustments to the number of active processes can therefore be embedded within the runtime system, becoming transparent to the application programmer. Evaluations of these policies [11, 1] on bus-based machines such as SGI workstations and the DEC Firefly report significant performance improvements that range from 8-22%. We explore the interaction of this approach with the memory hierarchy of CC-NUMA machines.
Background and Related Work
In this subsection we briefly review past proposals for scheduling and page migration policies. Later sections of the paper discuss our implementation of these policies.
2.1 Scheduling Policies Affinity Scheduling: In a traditional multiprocessor operating system, processes may frequently move between processors as part of load balancing, causing them to continually need to reload their state into new caches. Furthermore, multiple processes can be time-shared on the same processor, resulting in cache interference. Cache affinity scheduling [22, 12, 24] attempts to reschedule a process on the processor it last used, thereby reducing process migration and cache interference. The effectiveness of cache affinity has been evaluated through analytical studies [22, 21], simulation [12], and actual implementations [24, 8, 27]. Experiments on bus-based multiprocessors [24], however, show that realistic applications achieve only moderate gains (less than 10%) from affinity scheduling. We will show that the gains can be much larger on CC-NUMA machines. Gang Scheduling: For parallel applications, Ousterhout [19] proposed the gang scheduling or coscheduling approach in which all the processes of a parallel application are scheduled to run at the same time. This improves the synchronization and communication behavior of applications, particularly those using busy-wait synchronization. However, two-phase synchronization—where a process spins for a while trying to acquire the lock, and then blocks if the lock is still unavailable—offers a much more robust alternative without any loss of performance, making this issue largely irrelevant (all of our applications used two-phase locking). Experimental evaluations of gang scheduling have found only limited gains (ranging from -5 to 15% [25]) for multiprogrammed workloads. However, these studies have been performed on bus-based machines; we explore the usefulness of the gang-scheduling approach on CC-NUMA machines. Processor Sets: In contrast to the above time-multiplexing approaches, the processor sets technique [3] space partitions the machine. The machine is partitioned into sets of processors, each of which executes a single parallel application. This reduces the cache interference between multiple applications running on the same processor. Using processor sets can also ensure that different applications get an equal portion of the machine. (In contrast, in a gang scheduled machine, an application that has more processes gets a larger fraction of the machine.) Such equi-partitioning of resources has been shown to reduce average response time [16, 12]. In contrast to previous simulation-based studies, we evaluate the performance of processor sets and its interaction with the NUMA memory hierarchy on a real machine. Process Control/Scheduler Activations: The speedup achieved by a parallel application typically drops off with increasing number of processors, reflecting the penalties of increased communication, synchronization, and load imbalance. A parallel application therefore executes more efficiently (i.e., achieves
2.2
Page Migration Policies
Page migration policies have previously been studied primarily in the context of non-cache-coherent NUMA machines, such as the BBN Butterfly. These policies are based on the page fault mechanism, and migrate a page to the local memory of the processor that references it. However, pages that are actively shared between several processors may be repeatedly migrated from one processor’s memory to another. To avoid this ping-ponging effect, pages are usually frozen in memory after a certain number of migrations, and defrosted after a timeout period so that they are again eligible for migration. Several variations of this basic strategy have been studied [4, 14], and have reported significant gains. In contrast, we focus on the usefulness of automatic page migration on cache-coherent NUMA machines. Furthermore, while page migration is most beneficial for pages with high cache miss counts, this information is not available to the operating system on current machines. We therefore also explore the effectiveness of using TLB miss counts as an approximation to cache miss counts for making page migration decisions.
3
Experimental Environment
Our experiments are performed on a directory-based CC-NUMA multiprocessor, the Stanford DASH [15]. We use a machine with sixteen 33MHz MIPS R3000 processors organized into four clusters, with each cluster containing four processors and some physical memory (56 MB each). Each processor has a 64 KB first level cache and a 256 KB second-level cache. References that are satisfied in the first-level cache take a single processor cycle, while hits in the second-level cache take about 14 cycles. Memory references to data in the local cluster memory take approximately 30 cycles, while references to the memory of another cluster take between 100 and 170 cycles. The machine runs a modified version of SGI IRIX, an operating system based on System V Release 3. We have modified the kernel to implement the scheduling policies described earlier. We have also implemented a simple page migration policy. Each of these is described in detail in later sections. To obtain detailed performance information, we instrumented the kernel to dynamically track a variety of information relating to scheduling and page distribution. We augmented the context switch routine to count (a) the number of context switches incurred by a process, (b) the number of times a process is rescheduled on another processor, and (c) the number of times a process
2
is switched to another cluster. We also augmented the page allocation routine to track the distribution across clusters of the pages belonging to each process. Since both context switch and page allocation are sufficiently expensive operations, maintaining these counters incurs negligible overhead. We ran each experiment three times, and present results from the median run. Finally, we used the hardware performance monitor on DASH [15] to monitor the bus and network activity in a nonintrusive manner. For example, we tracked the number of cache misses to local and remote memories for each of the processors. To understand the effectiveness of using TLB miss counts for page migration, we also gathered traces containing all cache and TLB misses.
4
Table 1: Applications used in the sequential workloads, their standalone execution time, and data set size. Appl.
Description
Mp3d
Simulation of rarefied hypersonic flow. Input: 40000 particles, 200 time steps. Model eddy currents in an ocean basin. Input: 96x96 grid. N-body molecular dynamics application. Input: 343 molecules. VLSI router for standard cell circuit. Input: circuit with 2040 wires. Cholesky factorization of a sparse matrix. Input: Sparse matrix with 4K rows. Compute the radiosity of a scene. Input: a room scene. 4-process parallel compilation. Input: 17 C files, average 770 lines each.
Ocean Water Locus Panel Radiosity
Evaluation of Sequential Workloads
Pmake
In this section we evaluate the performance of OS scheduling and page migration strategies for multiprogrammed sequential workloads. We first describe our policies along with their implementation, and then present performance results for the workloads.
Time (sec) 21.7
Size (KB) 7,536
26.3
3,059
50.3
1,351
29.1
3,461
39.0
8,908
78.6
70,561
55.0
2,364
Table 2: Scheduling effectiveness of the different strategies for the Mp3d application from the Engineering workload.
4.1 Implementation of the Policies
Scheduler
Of the various schedulers described earlier, only the affinity scheduling policies make sense for workloads consisting of sequential applications. We explore two variations of affinity, namely cache affinity and cluster affinity. Cache affinity improves reuse in the cache in two ways. First, a given processor tries to run the same process that it last ran, effectively increasing the scheduling time-slice. Second, a process being scheduled tries to return to the processor where it last ran thereby avoiding the penalty of reloading the cache on another processor. Cluster affinity improves memory locality (servicing cache misses from local rather than remote memory) on a cluster-based machine like DASH by trying to schedule a process in the same cluster where it last ran. These affinity policies work together to improve both cache and memory locality in a CC-NUMA machine like DASH. We base our implementation of affinity scheduling on the traditional priority mechanism in Unix [24], in which the priority of a process is decreased as it accumulates CPU time (one point for every 20ms of execution time). We implemented affinity scheduling through temporary boosts in the priority of desirable processes. While searching for the next process to execute, a processor favors (a) the process that was just running on the processor, (b) processes that last ran on that processor, and (c) processes that last ran within the same cluster as the processor. We use a priority boost of 6 points for each of these three factors—this provides a moderate degree of affinity while maintaining fair scheduling across multiple applications. We verified that the performance of our affinity scheduler is relatively insensitive to small variations in the value of the priority boost. Our page migration strategy is based on TLB misses to the data pages of a process. We modified the software TLB miss handler invoked on misses in the hardware TLB (64 entries, fullyassociative) of the MIPS R3000 processor to check if the target of the miss is in local or remote memory. If remote, the page is marked for migration and a trap is generated to the fault handler which then performs the actual migrate. To avoid moving a page too often we freeze a page (making it ineligible for migration) immediately following a migration; a defrost daemon runs periodically (every second) and defrosts all pages in the system. While one can imagine many more complex and sophisticated algorithms, our results show that this scheme is both simple and effective.
Unix Cluster Cache Both
4.2
Switches per second Context Processor Cluster 19.90 19.70 15.90 9.03 8.08 0.03 0.71 0.15 0.15 0.69 0.06 0.03
Workloads
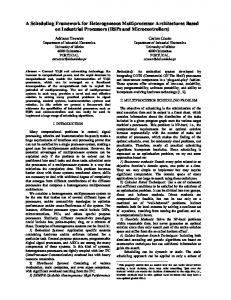
Our sequential workloads contain a mix of both short and long running jobs that one might encounter in a compute server environment. The first workload (Engineering) consists of scientific/engineering applications chosen to model an engineering development environment. The second workload (I/O) is a diverse mix that includes engineering applications, a graphics application, a pmake, and two editor sessions. This workload is intended to model a more interactive, I/O intensive environment. Each of our workloads contains about twenty-five active jobs on a sixteen processor machine, with the individual jobs starting and completing in a staggered fashion. Table 1 provides some of the characteristics of each application, while Figure 1 gives a dynamic profile of the execution of each workload under a standard Unix scheduler. Note that the workloads cause the machine to go from an initial underloaded phase through an overloaded phase to a final underloaded phase, thus amply exercising the scheduling and page migration algorithms.
4.3
Performance Results
We run each workload under four different schedulers—Unix, cache affinity alone, cluster affinity alone, and cache and cluster affinity combined. Furthermore, we run each scheduler with and without automatic page migration enabled. The exception is Unix with page migration, which performs particularly badly since processes are continually rescheduled on a different cluster causing excessive page migrations. We first present results from the affinity scheduling policies alone, followed by the results from combining page migration with affinity scheduling. 4.3.1 Performance with Affinity Scheduling Alone To evaluate the effectiveness of the affinity schedulers, we monitor the scheduling of each application in the workload. Table 2
3
Application Application
water
water
panel
rad pmake
ocean ocean mp3d
mp3d
locus edit
locus 0
10
20
30
40
50
60
70
80
90
100 110 120 130
0
10
20
30
40
50
60
70
80
90
100 110 120
Time (sec)
Time (sec)
I/O Workload
Engineering Workload
69 60
67
System User
61
|
57 50
55 54
52 54
45 45 40
|
20
|
CPU Time (sec)
Figure 1: Execution timeline for the individual applications in each workload when run under the Unix scheduler. Each line shows the start and finish time for that application.
|
|
|
0
39
u
|
|
cl ca b
u
MP3D
|
|
cl ca b
u
Ocean
|
|
cl ca b
Water
200
202
|
196 185 174
170
Remote Local
155 150
| 115 113
100
|
50
|
cache misses (in millions)
Figure 2: The CPU time for some applications from the engineering workload under different schedulers without migration. Unix (u), cluster affinity (cl), cache affinity (ca), and both cache and cluster affinity (b).
|
|
0
u
cl
ca
Engineering
b
u
cl
ca
b
I/O
Figure 3: Local and remote cache misses under different schedulers without migration. Unix (u), cluster affinity (cl), cache affinity (ca), and both cache and cluster affinity (b).
4
presents the scheduling profile for the Mp3d application from the Engineering workload (the scheduling behavior of the other applications in the two workloads is similar). The table presents the average rate at which this application incurred context, processor, and cluster switches over the duration of its execution under the different schedulers. The numbers indicate that the application was frequently moved around under Unix. In contrast, adding cluster affinity almost eliminated cluster switches, while cache affinity as well as combined cache and cluster affinity dramatically reduced the frequency of context and processor switches. These improvements in scheduling behavior are directly reflected in the performance of individual applications in the workload. We first discuss the engineering workload, then the I/O workload. Figure 2 shows the performance of three applications from the Engineering workload: Mp3d, Ocean, and Water. The height of each bar represents the CPU time for the completion of the application, and is broken down into user and system time. The results show substantial performance gains with each of the affinity schedulers: cache affinity performs slightly better than cluster affinity, and combined cache and cluster affinity usually outperforms the other schedulers. The performance improvements of the Engineering applications are due to the improved cache behavior that occurs under affinity scheduling. This is demonstrated by the bars on the left hand side of Figure 3, which plot the total number of cache misses incurred under each scheduler. We find that cluster affinity has limited effect on the number of cache misses, since it aims at memory locality rather than cache reuse. However, the number of cache misses decreases substantially with cache or combined cache and cluster affinity. (Limitations of the DASH hardware monitor prevent us from analyzing per-application cache behavior in the workload.) The cache miss results for the I/O workload are similar although less pronounced. This is because the nature of the applications in the I/O workload reduces the effectiveness of the affinity schedulers. For instance, the pmake application repeatedly creates short-lived processes, thereby disturbing other jobs that may have acquired affinity for a processor. Furthermore, all I/O on the configuration of DASH we used is performed only on a single cluster, forcing applications to compete for those four processors to do I/O. These workload characteristics prevent the affinity schedulers from achieving the reductions in cache misses that were possible with the Engineering workload. The overall
29
|
20 0 cl
ca
b
cl
MP3D
ca
b
cl
Ocean
ca
b
|
|
40 50 Time (sec)
60 40
|
20
112
|
% of Pages Local
80
|
| |
|
|
|
|
|
0
10
20
30
|
cache misses (in millions)
100
0 50
|
30
|
|
Remote Local
148 114
|
20
No Migration
200 179
100
|
10
|
205
150
|
0
Water
Figure 4: The CPU time for some applications from the engineering workload under the different schedulers with automatic page migration. Unix (u), cluster affinity (cl), cache affinity (ca), and both cache and cluster affinity (b).
200
40
|
|
0
29
60
|
20
29
32
|
% of Pages Local
34
31
80
|
CPU Time (sec)
54
|
54
100
|
55
System User
|
40
|
60
|
|
40 50 Time (sec)
Migration
|
|
0
cl
ca
b
Engineering
cl
ca
b
I/O
Figure 5: Local and remote cache misses under different schedulers with page migration. Unix (u), cluster affinity (cl), cache affinity (ca), and both cache and cluster affinity (b).
improvements in execution time for the applications was about 10-20% as we will show in Section 4.4.
Figure 6: Scheduling behavior and page distribution for the Ocean application with cache affinity, without page migration (above) and with page migration (below). The plots show the fraction of pages in local memory, with the small bars along the x-axis identifying points of cluster switch.
migration is turned on. The same is true of the I/O workload. To help build intuition for these effects, Figure 6 presents the correlation between scheduling behavior and page migration for the Ocean application from the engineering workload under the cache affinity scheduler. The figure shows the results with and without page migration. The small vertical bars along the x-axis indicate points where the application was switched from one cluster to another, while the curve plots the percentage of pages of the application that are local to the application’s current cluster. As shown in the figure, affinity scheduling without page migration provides highly variable performance. For instance, the process often acquires affinity for a processor/cluster with most of its data in remote memory, while sometimes the process gets lucky and finds most of its data in local memory. With migration, however, the performance is much more robust. A cluster switch can cause most of the data to be remote, but page migration soon moves the application’s working set to the new cluster, as shown by the initial dip followed by improvements in the percentage of local pages. Note that the horizontal line at 60% of pages local actually indicates excellent locality, since the remaining 40% of the pages are no longer referenced by the application during this part of its execution.
4.3.2 Performance with Automatic Page Migration When optimizations for cache reuse alone are not sufficient for good performance (i.e., misses are still high), page migration can help reduce memory stall time by automatically moving pages from remote to local memory. Figure 4 shows the performance of the three applications from Figure 2 when page migration is enabled. Comparing results across these two figures, we see substantial performance gains with page migration for Mp3d (25%) and Ocean (45%) under combined cache and cluster affinity. In contrast, the Water application has a small working set and works well within its cache, hence page migration does not help it much. For the Mp3d and Ocean applications in Figure 4, the overhead of page migration is reflected in the sizeable portions of system time for each application. However, the gains from page migration more than compensate for this additional overhead. The impact of page migration is also demonstrated by the composition of the cache misses in the workload (Figure 5). For instance, comparing the composition of cache misses under combined cache and cluster affinity with and without page migration for the Engineering workload (Figures 3 and 5), we can see that although the total number of cache misses is not affected, many more of these misses are serviced from local memory when page
4.4
Summary
Having looked at the results from individual applications, we
5
pages into local memory (providing COMA [23] style benefits). We have found that for sequential workloads, simple page migration schemes offer substantial gains even on NUMA architectures with hardware caching, and are quite robust in practice.
Table 3: Performance of the different schedulers with and without page migration. Numbers show the average and standard deviation of the overall response time normalized to Unix without migration. Sched
25
|
20
|
Load
Unix Cluster Cache Both
Engineering Workload No Migration Migration Avg StDv Avg StDv 1.00 — — — 0.76 0.17 0.59 0.12 0.71 0.15 0.55 0.12 0.72 0.15 0.54 0.13
I/O Workload No Migration Migration Avg StDv Avg StDv 1.00 — — — 0.90 0.06 0.69 0.14 0.80 0.09 0.69 0.14 0.84 0.11 0.71 0.17
5
In this section we evaluate OS scheduling and page migration policies in the context of parallel applications. We first discuss tradeoffs between different scheduling policies and describe their implementation. We then evaluate performance of different scheduling policies (without considering page migration) using controlled experiments and multiprogrammed workloads. Finally, we discuss implementation issues and the performance potential of automatic page migration by the operating system.
Unix Cache+Clus Cache+Clus+Migr
5.1
|
|
0
|
5
In Section 2 we described the parallel-application scheduling policies of gang scheduling, processor sets, and process control. Unlike the affinity scheduling policy used for sequential applications, scheduling policies for parallel applications have a large effect not only on performance, but they also determine the programming model seen by the programmer, runtime system, and/or the compiler. We discuss below effects of the scheduler on potential to exploit data locality, efficiency due to the operating point effect, and on the synchronization behavior of parallel applications.
|
10
Tradeoffs Amongst Scheduling Policies
|
15
Evaluation of Parallel Workloads
0
|
|
|
|
|
|
|
|
|
|
|
|
|
|
10 20 30 40 50 60 70 80 90 100 110 120 130 140
Time (secs)
Figure 7: The load profile (number of active jobs) over time for the engineering workload under Unix and the scheduler with both cache and cluster affinity with and without page migration. The curves with affinity scheduling and page migration indicate that individual applications and the workload as a whole complete faster.
5.1.1 Data Locality The primary mechanism to improve data locality in a parallel application is to distribute tasks and data so that tasks execute close to the data they reference [5]. However, it is common to assume exclusive use of the machine in performing these optimizations, an assumption that is no longer valid in a multiprogrammed environment. Because of its coscheduling property, gang scheduling provides the illusion of an exclusive machine, with each application process assigned to a particular processor. This allows the programmer/compiler to successfully perform these optimizations without regard for other applications. However, depending on the system load, the processes of an application may be moved to a different set of processors during execution, affecting any data distribution optimizations. The space-sharing approaches may dynamically vary both the number of processors as well as the actual processors assigned to an application, again making these optimizations difficult. The different schedulers also affect the cache behavior of a parallel application. For instance, gang scheduling may cause cache interference between processes that belong to different applications but are time multiplexed onto the same physical processor. The space-sharing approaches avoid this problem since each processor set is assigned exclusively to a single application. However, in processor sets, multiple processes of the same application may be time-shared on the same processor, causing cache interference if their working sets do not overlap.
now look at the overall performance of the workloads. We monitor the wall-clock completion time (response time) of each application, since that is the bottom-line metric for a person using the machine. Next, we normalize the response time of each application in the workload to its time when run under Unix. We then simply take the average of this normalized time over all applications in the workload. As shown by the numbers in Table 3, affinity scheduling substantially improves the average response time for both workloads: across the different affinity schedulers, the gains range between 25-30% for the engineering workload, and between 10-20% for the I/O workload. With page migration the performance gains are even more dramatic, almost as high as a factor of two (on the average) for applications from the engineering workload. Table 3 also shows the standard deviation in the normalized response time across the applications in a workload. This number is uniformly small across all schedulers and both workloads. This indicates that nearly every application improved in performance with affinity scheduling, and no application was starved unfairly. Figure 7 shows graphically that the workload as a whole completes sooner with affinity scheduling and affinity with page migration than under Unix scheduling. To summarize, in contrast to previous studies that have reported modest gains of up to 10% with affinity scheduling on busbased machines, our experience suggests that affinity scheduling offers significant performance benefits on large-scale multiprocessors with NUMA memory hierarchies. The latency of memory references, particularly to remote data, is much larger in these machines, and optimizations to improve locality in the cache and in local memory are correspondingly more important. Affinity scheduling helps improve cache reuse, and can be successfully combined with OS page migration strategies to bring the remote
5.1.2 Operating Point As discussed earlier in Section 2, an application usually executes at a more efficient operating point along its speedup curve (i.e., at a point where the marginal efficiency of each processor allocated to the application is higher) when the number of processors used by it is smaller. Consequently, in a multiprogrammed environment, where the effective number of processors available to any given application is smaller than the total number of processors,
6
it is desirable for applications to reduce their active processes to match the number of available processors. The process control scheduler exploits this effect by keeping each parallel application informed of the number of processors allocated to it (in its processor set), thereby enabling the application to dynamically adapt to the processor resources it is allocated. The gang scheduling policy, in contrast, provides a machine abstraction as if all processors are still available to each of the applications. The processor-sets scheduler also divides up the processors among the applications, but it does not inform the user application about the change in resources; thus the operating point can not be exploited.
Table 4: The parallel applications used in the controlled experiments and their standalone running times. Appl.
Description
Ocean
Eddy and boundary currents in an ocean basin. Input: 192x192 grid. N-body molecular dynamics application. Input: 512 molecules. VLSI router for standard cell circuit. Input: circuit with 3029 wires. Cholesky factorization of a sparse matrix. Input: tk29.O, matrix with 11K rows.
Water Locus Panel
5.1.3 Synchronization The scheduling policies of the operating system can significantly affect the synchronization behavior of parallel applications, particularly those using busy-wait synchronization. For instance a process may get descheduled by the OS in the middle of a critical section, causing other processes waiting for the critical section to spin. However, this is largely a non-issue for applications using two-phase synchronization (spin for a while and then block); all our applications use two-phase locks.
5.3
Time (16 procs) 40.9s 29.4s 39.4s 58.3s
Performance Results
We evaluate the three scheduling policies presented above (affinity scheduling performed similar to Unix and is not reported here), using several parallel applications. Our evaluation consists of both controlled experiments and multiprogrammed workloads. The controlled experiments consist of a single application running by itself in an emulated multiprogrammed environment, thereby enabling us to isolate the different factors affecting performance. The multiprogrammed workloads consist of a mix of different applications through which we can compare the overall performance of the different schedulers, but cannot study individual effects.
5.2 Implementation of Scheduling Policies We implement gang scheduling using the matrix method [6, 7, 25], in which rows represent time slices and columns represent processors. When a parallel application starts up, its processes are placed within a single row. The scheduler conceptually executes the rows in a round-robin fashion—all processes in a row are scheduled for the duration of a timeslice (default 100 ms), before moving on to the next row. We schedule a row for execution through a simple extension to the Unix scheduler, by temporarily boosting the priority of all processes in that row for that timeslice. If the processes of a new application do not fit within an existing row then a new row is created. As applications start and complete the matrix is likely to get fragmented; we therefore compact the matrix periodically (every 10 seconds in our current implementation). Finally, the processes of a parallel application are placed in a contiguous set of columns within a row; they therefore execute on a contiguous set of physical processors on the machine, and exploit cluster level locality in an architecture such as DASH. In our processor sets implementation, an application can choose to execute in its own processor set by making a special system call. This creates a new processor set with its own run queue on which the processes of the corresponding application are enqueued. The partitioning of processors among applications is recomputed each time a parallel application arrives or completes. Processors are distributed equally across processor sets unless an application requests fewer processors. There is a separate processor set that executes all sequential jobs and those parallel applications that did not request a processor set. The size of this default processor set is varied dynamically based on the system load. Finally, we allocate physical processors to a set in multiples of an entire DASH cluster as far as possible, and thereby exploit cluster locality in DASH. For process control we extend our processor sets implementation with a mechanism to keep applications informed of the number of processors allocated to their processor set. Each processor set has a variable, maintained within the operating system, for the number of processors in the set at any time. In a taskqueue model, the runtime system of the application examines this variable at safe suspension points (i.e. at the end of a task), and suspends or resumes a process as necessary to match the number of processors assigned. Details of the implementation correspond closely to those in Tucker’s thesis [25].
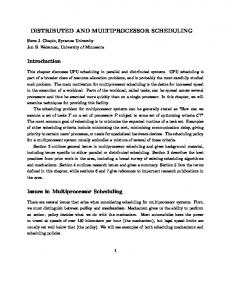
5.3.1 Parallel Applications and Results For both our controlled experiments and workloads we use four parallel applications: Ocean, Water, Locus, and Panel. All four applications are written in the Cool [5] parallel programming language, an extension of C++ that supports dynamic task-level parallelism. (The applications are originally from the SPLASH [20] suite.) The use of task-level parallelism is an important prerequisite for benefiting from process control scheduling. The Ocean program models eddy currents in an ocean basin. The main data structures in Ocean are several matrices, and the basic operations are very regular, such as adding two matrices. Both data and computation are partitioned across processors such that each processor computes primarily within its local data. The Water application models a system of water molecules interacting with each other. Molecules are partitioned across processors so that each processor works on its assigned set of molecules, except for one phase that requires all-to-all communication. The cache hit rates are high due to low communication and small working sets; data distribution is therefore relatively unimportant. Locus is a VLSI routing program where the main data structure is a shared cost matrix that is both read and modified by all processors. There is a high degree of communication so data distribution is again not helpful. Panel is a sparse matrix factorization program in which the matrix is partitioned into sets of columns (or panels) that are distributed across processors. Tasks for the basic operation, an update of a panel by another panel, are distributed based on the panel they update for better locality. Table 4 lists the applications, the input used, and the total execution time (i.e. including both serial and parallel portions) running standalone on 16 processors. (The application is run with 16 processes and each process is attached to a specific processor for the duration of the whole run.) Figure 8 reports on the parallel portion of each application, showing the execution time and the number of cache misses (broken into local/remote misses) when running standalone on 4, 8, and 16 processors. A high fraction of local misses indicates that locality is quite important for the application.
7
Water
Normalized CPU time
Locus
|
|
|
|
|
|
|
|
g1gnd1g3 g6
g1gnd1g3 g6
g1gnd1g3 g6
g1gnd1g3 g6
Ocean
Water
Locus
Panel
|
Panel
118 Remote Local
|
36
21
196
187185
40
164 156
151157 127 114
114114
111111
109110
27 29
25
0
|
|
|
16
80
|
46 46
120
|
41
160
|
|
79
Remote Local
220 200
|
98
240
|
|
Normalized Cache misses
Parallel execution time (sec)
|
|
|
Cache misses (in millions)
0
|
|
|
|
|
|
|
|
|
|
g1gnd1g3 g6
g1gnd1g3 g6
g1gnd1g3 g6
g1gnd1g3 g6
Ocean
Water
Locus
Panel
|
|
0
13
|
60
20
17
s4 s8 s16 s4 s8 s16 s4 s8 s16 s4 s8 s16
80
40
121 110 98 101 102102 102 101102
23
|
100
29
25 15
Ocean
120
30
|
|
0
60
109109 103
38 27
20
90
|
44
105103 |
|
45 40
122 |
|
63 60
120
|
87 80
156 150
s4 s8 s16 s4 s8 s16 s4 s8 s16 s4 s8 s16
Ocean
Water
Locus
Panel
Figure 9: Gang Scheduling: Normalized parallel execution time and normalized cache miss count (w.r.t. standalone 16). With cache flush and timeslice of 100ms (g1), turning off data distribution (gnd1), timeslice of 300ms (g3), timeslice of 600ms (g6).
Figure 8: Wall-clock execution time (in seconds), and number of cache misses (in millions) partitioned into local and remote references, in the parallel portion of each application standalone on 4, 8, and 16 processors (labeled s4, s8, s16).
uled. Since the performance impact of these reload cache misses are dependent on the length of the timeslice, we also examine the performance with 300ms and 600ms timeslices in addition to the default 100ms timeslice. Under a multiprogrammed workload, a gang scheduler might have to move applications between CPUs in order to keep the load balanced across the machine. However, this movement can break the data distribution done for the application. To examine this effect we simply turn off the explicit data distribution optimizations, and allocate data based on the default first-touch policy (data is allocated from the local memory of the processor that first touches it). Figure 9 shows the normalized CPU time and the normalized cache misses for the parallel part of each application. All the bars correspond to runs where the cache is explicitly flushed at every timeslice. Bar g1 shows results with data distribution optimizations and a scheduling interval of 100ms. Data distribution is turned off in gnd1. Bars g3 and g6 represent gang scheduling with data distribution and timeslices of 300ms and 600ms respectively. The results show that with a 100ms timeslice, cache interference in gang-scheduling can substantially increase the number of cache misses suffered by an application. In our runs the number of misses increased between 50% and 100% over the ideal case. The overall effect of these misses on application performance depended on the application. For memory intensive applications such as Ocean, performance drops by as much as 22%. The rest of the applications encounter relatively small (less than 10%) slowdowns. The g3 and g6 bars show that with longer timeslices almost all effects of cache interference can be mitigated. In fact, with a timeslice of 600ms (g6), both cache misses and performance are
5.3.2 Controlled Experiments In our controlled experiments we focus on the time spent in the parallel part of each application and ignore the serial portions, during which the application uses a single processor and the parallel schedulers are therefore equivalent in performance. To compare schedulers we use the metric “normalized CPU time”, computed by adding up the time spent on all the processors within the parallel portion and normalizing it to its value in the ideal case (which is the application running standalone with as many processors as it requested). This metric can be viewed as the inverse of machine efficiency—the larger the value the more inefficiently the processors are being used as compared to the standalone case. The normalized metric also allows us to compare results from different applications in the same chart without scaling problems. In addition to the normalized CPU time metric, we use the performance monitor on DASH to count the number of local and remote cache misses. Again to allow comparisons, we normalize the number of misses to the value for the standalone case. (Note that the absolute numbers can be computed from both normalized metrics using the base numbers provided in Figure 8). The normalization value is 100 in all figures. 5.3.2.1 Gang Scheduling: In a multiprogramming environment using gang scheduling, the major factors degrading application performance are cache interference and the possible difficulty of doing data distribution optimizations. To examine the effect of cache interference we modified the kernel to flush the caches in the system at each gang rescheduling interval. This effectively models worst-case cache interference with other applications where an application must reload its working set every time it is resched-
8
108 88 89
80
40
|
0
|
125 105
120
|
112105 108
160
78
81
88 74
89
|
80
|
120
|
160
Normalized CPU time
|
Normalized CPU time
|
200
|
|
240
204
200
|
|
280
305314
|
320
40
|
0
|
p8 p4 p8 p4 p8 p4 p8 p4
p8 p4 p8 p4 p8 p4 p8 p4
Ocean Water Locus Panel
Ocean Water Locus Panel
Figure 11: Process Control: Normalized parallel execution time w.r.t. standalone 16. 16-process application on a 8-processor set (p8), on a 4-processor set (p4).
150
|
204
200
|
50
|
0
|
105
100
|
5.3.2.2 Processor Sets: In processor sets, the scheduler responds to an increased multiprogrammed workload by squeezing the application on to fewer processors. To model this we ran a 16-process invocation of each application with only 8 or 4 processors. Figure 10 shows the cumulative execution time for the parallel part of each application when running on 8 and 4 processors, normalized to the ideal case where the application runs standalone on 16 processors. The results show that Ocean reacts very badly to being squeezed onto a smaller number of processors, Panel suffered a 25% slowdown, while the other applications are affected only mildly. The 300% slowdown for Ocean is a direct consequence of multiplexing several processes onto fewer processors within a processor set. In Ocean each process computes primarily within its assigned portion of data with little inter-process communication. The individual data portions are large, therefore multiplexing multiple processes onto the same processor acts as if a cache flush was being done every time slice. In contrast, the small working set in Water, and the sharing between processes in Locus and Panel, keep the performance degradation small for these applications. Locus benefited enough from the sharing to run 10% more efficiently on 4 processors than on the 16 CPU standalone case to which we normalized.
250
|
close to ideal. The timeslice period, however, must be chosen carefully—large timeslices mitigate cache interference but may lead to unfair scheduling of multiple applications. Finally, the results also show that the impact of not doing data distribution varies depending on the application (as shown by the gnd1 bars in Figure 9). Applications where memory locality is important perform quite poorly when data distribution optimizations are disabled (e.g. Ocean is 56% worse, Panel is 21% worse). The other applications perform only 10% worse without data distribution.
305
300
|
Normalized CPU time
Figure 10: Processor sets: Normalized parallel execution times (w.r.t. standalone 16). 16-process application on a 8-processor set (p8), on a 4-processor set (p4).
112 103
89
125 102108108 101
88
g ps pc
g ps pc
g ps pc
g ps pc
Ocean
Water
Locus
Panel
Figure 12: Comparing different schedulers: Normalized parallel execution time w.r.t. standalone 16 experiment. Gang (g), processor sets (ps), and process control (pc). is worse than the standalone case because it uses optimized task assignment to processors and data distribution in main memory, so that there are fewer total misses and a larger fraction are local. Looking closely at the performance of process control with 4 and 8 processors, we found that while the total number of misses was approximately the same, the 8 processor case had a much larger fraction of remote misses. An explanation is that given the size of data grids used in Ocean and the somewhat random task assignment that is happening due to process control, Ocean generates a lot of interference misses. These misses are likely serviced by the cache of one of the other processors (rather than main memory) executing the application. Since in the 4 processor case all processors are on the same cluster, all these misses appear as local misses, while in the 8 processor case there is a 50% chance that a miss will need to go to the remote cache to be serviced. 5.3.2.4 Comparing the Schedulers: Having looked at the individual effects of the various schedulers, we now compare their relative performance in Figure 12. For each application we show the execution time in the parallel portion under each scheduler normalized to ideal standalone execution. The gang scheduled version is modeled with cache interference, a 300ms timeslice, and with data distribution. For both processor sets and process control no data distribution optimizations are performed, and the execution consists of 16-processes multiplexed onto 8 processors. The performance of the different schedulers is a tradeoff between the relative importance of data distribution optimizations for better locality, cache interference, and the operating point effect. As shown by the results in Figure 12, Ocean performs better under gang-scheduling due to the data locality optimizations, while Panel and Water perform best under process control due
5.3.2.3 Process Control: Our experiments with process control are similar to the processor set experiments, with process control having the same disadvantage that no data locality optimizations (such as page migration) are used for the results. However, comparing the performance of process control to the 16-process standalone execution in Figure 11, we see that even without data distribution optimizations, the process control scheduler performs quite well due to the operating point effect. Performance improvement over the standalone case is as high as 26% for Panel. The one major exception to the general improvements due to process control is Ocean on 8 processors, where the machine efficiency is about two times worse than standalone with 16 processors and process control with 4 processors. The performance
9
cessor sets shows gains of only 5%, but process control benefits from the operating point effect and is 30% better than Unix in the parallel portion. Gang therefore outperforms the two space multiplexing schedulers in the parallel portion. In workload2 gang no longer enjoys the data distribution advantages, and shows only modest gains of 6% in parallel time, compared to 16% for process control. These gains are also reflected in (smaller) improvements in the total execution time of the applications. Overall, our experiments with these workloads bear out our experience with the controlled experiments. Gang-scheduling offers the compiler/programmer the opportunity to effectively do data locality optimizations, thus offering potential for increased performance by reducing remote misses. In contrast, process-control scheduling allows applications to exploit information about resource allocation changes, thus offering potential for increased performance through the operating point effect. The overall suitability of the schedulers thus depends on the characteristics of the applications in the workload.
Table 5: Applications within the two parallel workloads. Procs 16 16 16 16 16 16
97
95
88
80 60 40
Page Migration
As we have seen in the previous section, space multiplexing has the disadvantage of preventing effective data distribution optimizations. However, after every reallocation of processors in the space-partitioning schemes, the operating system could potentially move each application’s data to memory that is local to it. Several page migration schemes of varying sophistication have been proposed in the literature [4, 14]. We performed some initial experiments with a simple extension of our page migration strategy presented earlier for uniprocessor applications (we have not yet attempted page replication in our experiments). Our policy attempts to capture the sharing behavior of a parallel application by migrating a page only after a certain number (4) of consecutive remote misses to the page (in the TLB handler). To prevent a page from unnecessarily migrating between processors, it is frozen for one second after it is migrated and on a TLB miss by a processor local to the page. Unfortunately, however, our page migration scheme did not improve the response time for the workloads. The primary reason for this was that the synchronization structure of the IRIX virtual memory system required excessive locking to perform page migration. Without major modifications to the VM system, it was necessary to lock the page table of the application when moving a page. This coarse grain locking led to high lock contention, and the time spent waiting on locks more than canceled the benefits from migrating the page. Since we were limited by the current design of the virtual memory data structures, we instead performed a trace-driven study to explore the performance benefits of page migration. We instrumented the kernel to trace TLB misses and used the DASH nonintrusive performance monitor to record cache and TLB misses while running the Panel and Ocean applications. These application were chosen because they have the greatest potential for improvement from data distribution. In the trace we only consider cache and TLB misses incurred to data pages while running in user mode. Tracing was started at the beginning of the parallel section of each application. In analyzing the trace, we do not assume that memory is connected to a cluster as in DASH, but that each processor has its own memory, which is remote to all the others. The applications were run on a 16 processor machine utilizing 8 processes. The data for the applications was distributed among the 16 processor’s memory in a round robin fashion. This data and processor allocation corresponds to an application running under process control where its processor allocation was recently
|
|
0
Total Parallel Workload 1
84
|
20
Ga Ps Pc Ga Ps Pc
94 94
5.4
|
0
|
20
|
40
61
96 82
|
70 60
Workload 2 Input 146x146 grid 130x130 grid tk17.O 3029 wires 512 molecules 343 molecules
90
|
77
100
|
|
80
Procs 12 8 8 8 4 16
|
100
|
Normalized WallClock time
Ocean Ocean1 Panel Locus Locus1 Water Water1
Workload 1 Input 146x146 grid tk29.O 3029 wires 3029 wires 512 molecules 512 molecules
Normalized WallClock time
Application
Ga Ps Pc Ga Ps Pc
Total Parallel Workload 2
Figure 13: Workload performance under different schedulers. Average normalized parallel and total time (w.r.t. Unix). Gang (Ga), processor sets (Ps), and Process Control (Pc). primarily to the operating point effect. The performance differences for Locus are small, with gang-scheduling doing marginally better. Overall, therefore, gang-scheduling offers more robust performance in these controlled environments. The next subsection examines multiprogrammed workloads, where the scheduling situation is more chaotic. 5.3.3 Performance of Workloads The controlled experiments showed us that the relative performance of different schedulers is affected by the application characteristics. We therefore choose a mix of the different applications studied earlier (Table 5) to construct two different workloads representing multiprogrammed environments. The first workload represents a relatively static environment in which applications are long-running and arrive/complete infrequently. The applications are sized to run on the entire machine. This favors the gangscheduling approach since it avoids fragmentation in the scheduling matrix, and processes do not move from one processor to another during execution, enabling data distribution optimizations. The second workload is intended to model a more dynamic multiprogrammed environment with applications frequently starting and completing. Applications are sized for different numbers of processors; they are therefore likely to move around within the matrix in gang-scheduling, making it difficult to distribute data effectively. The performance of the workloads is shown in Figure 13. We normalize both the time spent in the parallel portion and the total time for each application to the corresponding values under the Unix scheduler. Figure 13 presents an average of each of these normalized numbers across all the applications in the workload. The results show that all of the parallel schedulers considered here outperform the standard Unix scheduler. In workload1 gangscheduling enjoys the benefits of data distribution and is 40% better than Unix in parallel time, 12% better in total time. Pro10
Number of pages
| |
800
|
|
1200
|
ocean panel
|
% overlap
1277
| | |
448
| |
400
| | |
|
|
|
|
|
|
|
|
0
10
20
30
40
50
60
70
80
|
|
96
51
90 100
0
% of hot TLB pages Figure 14: Percentage overlap of hot TLB pages with hot cachemiss pages.
|
4 |4 3 |3 2 |1
|
|
|
100 90 80 70 60 50 40 30 20 10 0
|
34 17 9 4 2 1 | | |
1 2 3 4 5 6 7 8
1 2 3 4 5 6 7 8
Ocean
Panel
|
Figure 15: TLB miss rank distribution of the processor with the most cache misses.
| | | |
% Local misses
| | | | |
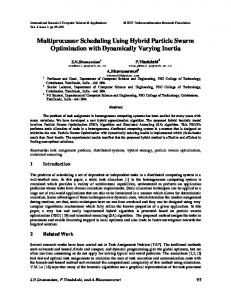
A page migration policy must address three issues. First, it must identify candidate pages for migration. Second, it must select an appropriate new location for such pages. Third, it must decide when a page should be migrated. We use the traces to analyze these issues in detail. Given that there is a cost associated with migrating a page, only those pages with a large number of cache misses should be considered for migration. Unfortunately, information about the number of cache misses to a page is not available to the operating system on most computers. We therefore explore the usefulness of an alternate strategy in which the TLB misses to a page are used to predict pages with large number of cache misses. To evaluate the correlation between cache misses and TLB misses, we plot the overlap between the pages with the most TLB misses (i.e. most hot) and those with the most cache misses in Figure 14. The x-axis shows increasing percentages of the hottest TLB pages, and the y-axis plots the percentage overlap with the corresponding set of hot cache miss pages. For example, a point on a curve at an x-value of 20% and a y-value of 30% means that, of the top 20% of the pages ordered by TLB misses, 30% are also in the top 20% ordered by cache misses. An exact correlation between the TLB and cache misses would be a horizontal line close to 100%, indicating that the set of pages selected by TLB misses overlaps very closely with the set selected using cache misses. Figure 14 shows that, while nowhere near perfect, there is reasonable correlation between TLB misses and cache misses. Considering the hottest 30% of the total pages there is significant overlap (50%) between pages taking many TLB misses and those with high cache misses. As we shall see, page migration policies can potentially gain with this level of correlation. The second requirement is to migrate a page to the particular CPU that is incurring the most cache misses. Once again the TLB miss information can potentially be used to track the distribution of misses across processors. Using the traces, we look at the correlation between the TLB and the cache miss distribution across processors for each page. Intuitively, we want to know if the processor that suffered the most cache misses also had the most TLB misses. Therefore, for each page we identify the processor with the most cache misses, and rank this processor in a list of processors ordered in decreasing TLB misses to that page. A rank
ocean cache ocean TLB panel cache panel TLB
|
5.4.1 Trace-based Evaluation of Page Migration
100 90 80 70 60 50 40 30 20 10 0
|
reduced from 16 to 8 processors. It is in this type of scenario that page migration is needed to restore an application’s data locality.
|
|
|
|
|
|
|
|
|
0
10
20
30
40
50
60
70
80
|
|
90 100
% Total misses Figure 16: Comparison of local misses through post-facto static placement based on cache misses and TLB misses. of 2 indicates that the processor incurred the second-most number of TLB misses to that page. A rank of 1, therefore, is ideal since that indicates that the same processor incurs the most cache and TLB misses. Figure 15 shows the distribution of this rank for the hot pages (defined as pages with more than 500 cache misses) over one second intervals averaged over the entire trace. This correlation is very good: there is a sharp peak at 1 implying that a large number of pages have a single processor incur the most TLB and cache misses. The mean value is 1.1 for Ocean and 1.47 for Panel. Besides the correlation in rank, we also look at the difference between using TLB misses and cache misses to determine page placement. Figure 16 plots the cumulative percentage of misses that would be local if the pages were placed based on the processor incurring the most cache misses, as well as based on the processor incuring the most TLB misses. (As we move from left to right on the X-axis, we increase the fraction of the applications’ pages considered.) The appropriate destination processor for each page is determined post facto from the trace; the page distribution therefore corresponds to the best possible static allocation of data based on either cache or TLB misses. For both applications, the TLB based plot closely follows the cache miss based plot, with only a small absolute difference between them. The difference in the number of local misses is fairly low—4% for Panel and 2.2% for Ocean. These two metrics, rank distribution and the local miss percentage, demonstrate that using TLB misses to place a page is quite promising and closely
11
applications, we believe that applications where data placement is successful should also show good results with page migration.
Table 6: Performance of page migration policies with Panel and Ocean, showing number of local and remote cache misses, pages migrated, and time spent in the memory system. Migration policy
Cache misses (millions) Local Remote
Pages migrated
Memory time (sec)
PANEL a. No migration b. Static post facto c. Competitive (cache) d. Single move (cache) e. Single move (TLB) f. Freeze 1 sec (TLB) g. Freeze 1 sec (hybrid)
1.2 8.1 5.5 5.7 3.3 6.5 6.2
18.9 12.1 14.6 14.4 16.9 13.7 14.0
1577 2891 3052 6498 3800
86.2 73.9 75.9 85.0 80.4 76.1
OCEAN a. No migration b. Static post facto c. Competitive (cache) d. Single move (cache) e. Single move (TLB) f. Freeze 1 sec (TLB) g. Freeze 1 sec (hybrid)
1.6 20.9 19.4 20.2 9.4 19.4 18.7
22.6 3.3 4.8 4.1 14.9 4.9 5.5
1453 1487 1525 1709 1627
103.2 42.1 39.4 78.3 42.7 44.8
6
Conclusions
While shared-memory multiprocessors offer the potential for costeffective computing in multiprogrammed environments, realizing this potential poses a significant challenge for scheduling and page migration policies. In this paper we have studied the effect of these policies in the context of the Stanford DASH, a CC-NUMA multiprocessor, for both sequential and parallel applications. For sequential applications workloads, we demonstrate that a combination of cache and cluster affinity along with page migration can be highly effective: our workloads show a 2-fold performance improvement over the standard Unix scheduler. The techniques that we use are simple, and can easily be incorporated into existing operating systems. For parallel applications, we found that both space partitioning and time-slicing approaches offer modest gains over the standard Unix scheduler. The relative performance of these strategies, however, depends on two key application characteristics: the importance of data distribution in main memory, and the shape of the speedup curve. The workloads we evaluated showed no clear winner with page migration disabled; gang-scheduling was a more effective approach when data distribution was important, while process control exploited the operating point effect. Our initial experiments with automatic page migration suggest that simple migration policies may be able to address the data distribution problems we observed for space-partitioning schedulers. To address page migration in real multiprocessors, we also studied the correlation between TLB misses and cache misses per page, and showed that policies based on TLB misses can be almost as effective as those based on perfect cache miss information. However, we have only begun to address these issues in the execution of parallel applications; we plan to study the interaction between scheduling and page migration policies for such workloads in greater detail.
approximates placement based on cache-misses. Finally, we address the last question of when to migrate a page by simulating some simple page migration policies based on the trace data. For each policy we track the number of cache misses and the total time spent in the memory system. Our cost model for computing the memory system time is loosely based on DASH. We assume that a local miss takes 30 clock cycles, a remote miss takes 150 cycles, and migrating a page takes 2 milliseconds (about 66000 cycles). We evaluated the following policies: (a) a base with no page migration, (b) static post-facto distribution of pages based on cache misses (therefore perfect static placement), (c) competitive page migration based on cache misses [2] with a miss threshold of 1000 misses, (d) single page migrate upon the first cache miss, (e) single migrate upon the first TLB miss, (f) the policy that we actually tried on DASH (described earlier in this section): migrate after 4 consecutive remote misses and freeze a page for one second after a migrate or a local TLB miss, and (g) a hybrid policy where pages are selected for migration based on the number of caches misses (500) and placed using policy (e). This last policy is based on our observation that the correlation for total misses to a page is not as good as that for the distribution across processors. The results are shown in Table 6. For these two applications, all the policies show an advantage over the no migration case (including the overhead for page migration). The best policies achieve local miss rates close to the post facto static allocation. The cache-miss based polices in general do better than the TLB-based policies. The hybrid policy, although requiring less information, still performs nearly as well as the cache-miss based policies. In the analysis of process scheduling schemes in Section 5.3 we had seen the performance of Ocean drop significantly in the case of space partitioning due to the increased number of cache misses that had to be serviced remotely. Our trace based analysis shows that using simple page migration policies we can get a substantial reduction in the time spent in the memory system for Ocean (from over 100 seconds to less than 50 seconds). Page migration can therefore potentially benefit space multiplexing schemes like process control where static data distribution is difficult. Furthermore, based on our experience with the SPLASH
Acknowledgements Vijayaraghavan Soundararajan and Steve Herrod helped in preparing the figures presented here. John Chapin and Jonathan Chew helped in collecting the trace data on DASH. We are also grateful to John Chapin, J. P. Singh, and the anonymous referees for their comments. This research has been sponsored by the Defense Advanced Research Projects Agency under DARPA contract #N00039-91-C-0138. Anoop Gupta is also supported by an NSF Presidential Young Investigator Award, and Mendel Rosenblum is also supported by an NSF Young Investigator Award.
References [1] T. E. Anderson, B. N. Bershad, E. D. Lazowska, and H. M. Levy. Scheduler activations: Effective kernel support for the user-level management of parallelism. In Proceedings of the 13th ACM Symposium on Operating System Principles, pages 95–109, October 1991. [2] D. Black, A. Gupta, and W.-D. Weber. Competitive management of distributed shared memory. In Proceedings of COMPCON, pages 184–190, March 1989. [3] D. L. Black. Scheduling support for concurrency and parallelism in the Mach operating system. IEEE Computer, 23(5):35–43, May 1990. [4] W. J. Bolosky, M. L. Scott, R. P. Fitzgerald, R. J. Fowler, and A. L. Cox. Numa policies and their relation to memory architecture. In
12
Proceedings of the Fourth International Conference on Architectural Support for Programming Languages and Operating Systems, pages 212–221, Santa Clara CA, April 1991.
[24] J. Torrellas, A. Tucker, and A. Gupta. Evaluating the benefits of cache-affinity scheduling in shared-memory multiprocessors. Technical Report CSL-TR-92-536, Computer Systems Laboratory, Stanford University, Aug. 1992. Published in short form in the Proceedings of SIGMETRICS ’93, pages 272–274, May 1993.
[5] R. Chandra, A. Gupta, and J. L. Hennessy. Integrating concurrency and data abstraction in the COOL parallel programming language. IEEE Computer, 27(8), August 1994.
[25] A. Tucker. Efficient Scheduling on Multiprogrammed SharedMemory Multiprocessors. PhD thesis, Department of Computer Science, Stanford University, November 1993. Technical Report CSLTR-94-601.
[6] M. Crovella. The costs and benefits of coscheduling. Technical report, University of Rochester Computer Science Department, May 1991.
[26] A. Tucker and A. Gupta. Process control and scheduling issues for multiprogrammed shared-memory multiprocessors. In Proceedings of the 12th ACM Symposium on Operating Systems Principles, pages 159–166, 1989.
[7] M. Crovella, P. Das, C. Dubnicki, T. LeBlanc, and E. Markatos. Multiprogramming on multiprocessors. In Proceedings of the Third IEEE Symposium on Parallel and Distributed Computing, pages 590–597, Dec. 1991.
[27] R. Vaswani and J. Zahorjan. The implications of cache affinity on processor scheduling for multiprogrammed, shared memory multiprocessors. In Proceedings of the Thirteenth ACM Symposium on Operating Systems Principles, pages 26–40, Pacific Grove CA, October 1991.
[8] M. Devarakonda and A. Mukherjee. Issues in implementation of cache-affinity scheduling. In Proceedings Winter 1992 USENIX Conference, pages 345–357, January 1992. [9] J. Edler, J. Lipkis, and E. Schonberg. Process management for highly parallel UNIX systems. In Proceedings of the USENIX Workshop on UNIX and Supercomputers, pages 1–17, 1988. [10] D. G. Feitelson and L. Rudolph. Distributed hierarchical control for parallel processing. IEEE Computer, 23(5):65–77, May 1990. [11] A. Gupta, A. Tucker, and L. Stevens. Making effective use of sharedmemory multiprocessors: the process control approach. Technical Report CSL-TR-91-475A, Computer Systems Lab, Stanford University, May 1991. [12] A. Gupta, A. Tucker, and S. Urushibara. The impact of operating system scheduling policies and synchronization methods on the performance of parallel applications. In Proceedings of SIGMETRICS ’91, pages 120–132, May 1991. [13] Kendall Square Research. KSR1 Technical Summary. Waltham, MA, 1992. [14] R. P. Larowe and C. S. Ellis. Experimental comparison of memory management policies for numa multiprocessors. ACM Transactions on Computer Systems, 9(4):319–363, November 1991. [15] D. Lenoski, J. Laudon, T. Joe, D. Nakahira, L. Stevens, A. Gupta, and J. L. Hennessy. The DASH prototype: Implementation and performance. In Proceedings of the 19th International Symposium on Computer Architecture, pages 92–103, May 1992. [16] S. T. Leutenegger and M. K. Vernon. The performance of multiprogrammed multiprocessor scheduling policies. In Proceedings of the 1990 ACM SIGMETRICS Conference on Measurement and Modeling of Computer Systems, pages 226–236, Boulder CO, May 1990. [17] T. Lovett and S. Thakkar. The Symmetry Multiprocessor System. In Proceedings of the 1988 International Conference on Parallel Processing, pages I:303–310, August 1988. [18] Multimax technical summary. Technical report, Encore Computer Corporation, 1986. [19] J. K. Ousterhout. Scheduling techniques for concurrent systems. In 3rd International Conference on Distributed Computing Systems, pages 22–30, 1982. [20] J. P. Singh, W.-D. Weber, and A. Gupta. SPLASH: Stanford parallel applications for shared memory. Computer Architecture News, 20(1):5–44, 1992. [21] M. Squillante and R. Nelson. Analysis of task migration in sharedmemory multiprocessor scheduling. In Proceedings of SIGMETRICS ’91, pages 143–155, May 1991. [22] M. S. Squillante and E. D. Lazowska. Using processor-cache affinity in shared-memory multiprocessor scheduling. IEEE Transactions on Parallel and Distributed Systems, 4(2):131–143, Feb. 1993. [23] P. Stenstrom, T. Joe, and A. Gupta. Comparative performance evaluation of cache-coherent NUMA and COMA architectures. In Proceedings of the 19th Annual International Symposium on Computer Architecture, pages 80–91, May 1992.
13