Available online at www.sciencedirect.com
ScienceDirect Energy Procedia 63 (2014) 3923 – 3934
GHGT-12
Using baseline monitoring data to strengthen the geological characterization of a Niagaran Pinnacle Reef Jacqueline Gersta*, Lydia Cumminga, John Millera, Glenn Larsena, Neeraj Guptaa, and Allen Modroob b
a Battelle, 505 King Ave., Columbus, Ohio 43201 USA Core Energy, LLC, 1011 Noteware Dr., Traverse City, Michigan 469868 USA
Abstract The Midwest Regional Carbon Sequestration Partnership has collected a full suite of initial monitoring data from its large-scale carbon dioxide (CO2) injection test site in the an depleted oil field to provide a baseline set of data. Data collection will be repeated after the field has been pressurized to the original discovery pressure using CO2. Data collection includes five walkaway vertical seismic profiles, microseismic monitoring, three pulsed neutron capture wireline logs, a borehole gravity meter survey, and satellite monitoring. An overview of these monitoring techniques and how they are being applied to improve current geologic understanding of this Niagaran Pinnacle Reef is presented. © Published by Elsevier Ltd. This 2013The TheAuthors. Authors. Published by Elsevier Ltd. is an open access article under the CC BY-NC-ND license © 2014 (http://creativecommons.org/licenses/by-nc-nd/3.0/). Selection and peer-review under responsibility of GHGT. Peer-review under responsibility of the Organizing Committee of GHGT-12 Keywords: MRCSP; Regional Partnerships; monitoring; MVA; EOR; VSP; Gravity; Pulse Neutron; InSar
1. Introduction The Midwest Regional Carbon Sequestration Partnership (MRCSP) is one of the seven regional partnerships established by the U.S. Department of Energy (DOE) across the U.S. to develop robust, cost-effective options for mitigating carbon dioxide (CO2) emissions that contribute to climate change [1]. Overview of the MRCSP Phase II and III program can be found in Gupta et al. [2,3,4]. As part of the Development Phase (Phase III) of MRCSP
*
Corresponding author. Tel.: +1-614-424-7439; fax: +1-614-458-7439. E-mail address:
[email protected]
1876-6102 © 2014 The Authors. Published by Elsevier Ltd. This is an open access article under the CC BY-NC-ND license (http://creativecommons.org/licenses/by-nc-nd/3.0/). Peer-review under responsibility of the Organizing Committee of GHGT-12 doi:10.1016/j.egypro.2014.11.422
3924
Jacqueline Gerst et al. / Energy Procedia 63 (2014) 3923 – 3934
research efforts, Battelle has been conducting large-scale CO2 injection in the depleted oil field in Otsego County, Michigan, in cooperation with site host Core Energy, LLC. This field is one of more than 700 pinnacle reef structures in the northern reef trend of the Michigan basin. The reef is a late-stage Silurian age pinnacle reef that has undergone extensive primary and secondary recovery phases. This closed carbonate reservoir provides an ideal test bed for testing technologies to track and monitor the CO 2 movement in the subsurface over time. MRCSP has successfully injected about 244,000 tonnes of CO2 into this reef since March 2013. The purpose of this paper is to describe the baseline monitoring verification and accounting (MVA) technologies used for the reef. Information on related aspects of the program is presented in other papers in these proceedings, such as pressure analysis [5]; static earth model development [6]; and dynamic reservoir modeling [7]. 1.1. Overall site The test reef is one of numerous Silurian-age pinnacle reefs within the Northern Pinnacle Reef. It has been subject to extensive primary and secondary recovery for a total of 32 years since 1975. The reservoir underwent primary production from 1975 to 1996 to yield 1,286 thousand barrels of oil; CO2 flooding for secondary recovery was implemented from 1996 to 2007 to extract additional 492 thousand barrels. MRCSP has been injecting CO2 at a maximum of 1,000 tonnes per day (based on availability of CO2) since March 2013. Approximately 244,000 tonnes of CO2 have been injected through August 2014 with a concurrent increase in pressure to above discovery pressure levels. At present, the test reef contains one injection well 1-33 and two monitoring wells 2-33 and 5-3). Fig. 1 (a) and (b) show a map of the injection site location and the well layout within the reef. Well 1-33 is a vertical well in the middle of the reservoir that was converted into a CO2 injection well in 1996 [8]. These pinnacle reefs are developed within the Silurian Brown Niagara Formation, overlying A-1 carbonate and capped by a low-permeability salt/anhydrite (A-2 evaporite). They are underlain by the Gray Niagara (Lockport dolomite) Formation. A generalized geologic cross section through the test reef is provided in Fig. 2. This cross section, which is based on interpretation of geophysical logs from wells that penetrate the reef, shows the presence of the Brown Niagara and the A-1 carbonate, which are overlain by the A-2 evaporite and A-2 carbonate, respectively. The approximate thickness of the reef complex (i.e., combined thickness of the A-1 carbonate and the Brown Niagara) reaches a maximum of approximately 300 ft (94 m) in the center of the reef. The approximate dimensions of the reef measured at the oil-water contact and the top of the Brown Niagara are 1,550 ft (472 m) east to west and 2,245 ft (684 m) north to south (approximately 80 acres [0.32 sq km]).
Fig. 1. (a) Phase III test site location; (b) Site plan view with well layout.
Jacqueline Gerst et al. / Energy Procedia 63 (2014) 3923 – 3934
3925
Fig. 2. Generalized geologic cross section through the test reef.
1.2. Baseline monitoring overview The overall goal for MRCSP field program is to inject and monitor at least 1 million tonnes of CO 2 in multiple oil bearing reefs, with up to 500,000 tonnes injected in the test reef. The monitoring results will be used to improve understanding of the utilization of depleted reservoirs as permanent CO2 sinks. Thorough geological characterization has been completed using the historical data to build static and dynamic reservoir models [6,7]. Certain assumptions were required for data gaps due to the age of the wells. New data have been collected to serve as baseline monitoring data; data collection will be repeated at the end of the active injection phase once the reservoir has reached capacity. The initial data set was used to help refine the geologic uncertainties of the initial reservoir model. Data collected includes five vertical seismic profiles, microseismic monitoring, three pulsed neutron capture (PNC) wireline logs, a borehole gravity survey, and satellite monitoring. An overview of these monitoring techniques and how they are being applied to improve current geologic understanding is presented in this paper. In addition, pressure monitoring [5] and fluid sampling events have occurred; however, they are not discussed here. One significant aspect of reef is the past CO2 injection for enhanced oil recovery (EOR). Before the start of MRCSP injection approximately 200,000 tonnes of CO2 had already been retained in this field. Effects of this pre-existing CO2 must be considered in the interpretation of monitoring data.
3926
Jacqueline Gerst et al. / Energy Procedia 63 (2014) 3923 – 3934
2. Vertical seismic profile A vertical seismic profile (VSP) is an active source seismic method that uses receivers in a borehole and sources on the surface. In this program, we used VSP to attempt to assess the incremental changes in the reservoir response due to the injected CO2 within the formation. Time-lapse VSP is considered a viable method to overcome the potential resolution limitation of surface seismic. A VSP survey typically provides higher resolution of the geology because the seismic energy is detected and recorded below the surface rather than after returning to the surface, as in a traditional surface-only seismic survey. Five transects, centered around the 1-33 injection well, were collected for baseline data, as shown in Fig. 3. These transects were positioned to provide as much information about the reef as possible while allowing access to the land needed for the surveys. Processed results (Fig. 4) showed a distinct increase in frequency content and more character in the evaporites near the edge of the reef and internal reef structure compared to the 3-D seismic data, which are hampered by the thick glacial till at the surface and highangle geologic features of the reef. There are some clear migration errors on the edge of each survey, but this is to be expected because without the proper fold, there are difficulties correcting for true dip. However, this is far enough away from the reef that it does not interfere with data interpretation.
Fig. 3. Location of the five walkaway VSP lines with respect to the well and the test reef.
3927
Jacqueline Gerst et al. / Energy Procedia 63 (2014) 3923 – 3934
A2 Carbonate
A1 Carbonate
Fig. 4. Main portion of the east-west line of the VSP data and the well data along the transect.
Encouragingly, there was not a significant difference between the VSP data and the interpreted static earth model [6], as can be seen in Fig. 5. This indicates that the VSP data were consistent with the rest of the data and that the initial reservoir model was well developed. Future work on the VSP data will involve relating the internal structures to the lithofacies developed within the static earth model. In addition, a post-injection VSP is being planned to evaluate whether differences between the two VSP surveys can be used to assess CO 2 migration and saturation differences over time. 3. Microseismic monitoring Microseismic monitoring is a passive approach for assessing the potential effect of CO2 injection on the cap rock and other geologic structures. Microseisms are minute-magnitude releases of mechanical energy. They can occur as part of natural seismic events or as the result of activities related to drilling, such as fracturing of a penetrated formation due to pressure change caused by injection of well fluids. Sensitive listening devices (receivers) continuously record seismic signals that occur in the region around the borehole. The output of these receivers is recorded and analyzed, and the analysis provides an indication of both magnitude and location (in three dimensions) of each event that is detected. Microseismic monitoring was completed during and after a 9-day injection test prior to the start of full-scale injection. (Results of pressure fall-off tests are detailed in a paper by Kelley, et al. [5].) During microseismic monitoring, we deployed an array of 80 geophones in the 5-33 monitoring well. This array was installed from March 20, 2013, through April 1, 2013. Data quality varied during the monitoring period, but, overall, good quality data were obtained. In total, 34 sub-surface events were detected (Fig. 6); however, none of these events were located within the reef and therefore these events are deemed unrelated to injection. Their detection does verify that the array was fully functional during the monitoring period. In addition, comparisons were made to injection mass flow rate and gas temperature, and no correlation was found on any day, which is interpreted to mean that there were no injection-related events. Fig. 7 shows an example day from March 25, 2013.
3928
Jacqueline Gerst et al. / Energy Procedia 63 (2014) 3923 – 3934
Fig. 5. East-west transect shown within the final static earth model; surface shown is the A-2 carbonate, which matches well with the bright reflector on the section.
Fig. 6. Simplified reef location and velocity model showing the located microseismic events; blue are interpreted as borehole events based upon their character as a tube wave or their location near to the wellbore; red are small seismic events, interpreted to be unrelated to injection activities.
Jacqueline Gerst et al. / Energy Procedia 63 (2014) 3923 – 3934
3929
Fig. 7. Comparison of injection operations to recorded events on a given day; no correlation could be made on this or any other day.
Although no injection-related events were detected, this is seen as a positive result. Because the current reservoir pressure during monitoring was below the discovery pressure, it is unlikely that injection operations would cause any microseismic events. In 2014, the reef pressure has been restored to discovery pressure. 4. Pulsed neutron capture logging Another monitoring technology we are testing is PNC wireline logging, which measures the capture cross sectional area (sigma), a measurement of an element’s ability to capture neutrons, in the near-wellbore environment. Brine has a high sigma value, whereas natural gas and CO2 have low sigma values. By repeating the measurement over time, the changes in the pore space fluid can be analyzed. Such logs have been utilized effectively for logging relative saturations of CO2 and brine for CO2 storage in saline reservoir in places such as the Friyo Project and the MRCSP Phase II Michigan Test Site. However, their use for EOR sites that have long well histories, variable pressure regimes, and complex fluid compositions (brine, oil, natural gas, CO 2 mixtures) is still under investigation. The MRCSP program offers a unique opportunity to test and validate PNC logging tools under these challenging conditions. We are using these data sets to characterize the pore space fluid distribution. We are also examining how the resulting curves relate to lithology, effective porosity, bulk mineralogy, injection pressure, and fluid content. An initial PNC log has been run on each of the three open wells within the reef as well as two repeat passes in the monitoring wells (2-33 and 5-33) to identify the presence of reservoir fluids near the wells and to aid in monitoring the migration of the injected CO2. A repeat pass has not been completed in the injection well, 1-33. The PNC log data were collected under appropriate well conditions and provided acceptable data. The repeat PNC data in the monitoring wells confirm the increasing presence of liquid CO 2 within the reservoir. Furthermore, changes in fluid saturations were observed only within the reservoir (e.g., the subsurface conditions above the reservoir remained the same). However, a large change in the data was observed, likely caused by the gaseous phase transitioning to liquid phase. The discussion below focuses on the processing techniques and other analyses performed to characterize the initial conditions in the reservoir and to quantify the changes occurring in the reservoir.
3930
Jacqueline Gerst et al. / Energy Procedia 63 (2014) 3923 – 3934
One of the main challenges associated with the processed data is the lack of modern triple combo data (gamma ray, neutron, and density logs), which provides information about lithology and mineralogy. PNC processing techniques use mineralogy as an input to better constrain the matrix response. However, without a minimum density and photo-electric effect log that is provided by triple combo data, mineralogy and lithology must be inferred from another source (elemental spectroscopy tools, for example). This inference introduces errors within the processing. Sections of the PNC log where there is a large difference between the Baker Hughes GasView analysis [9] and the sigma analysis are considered to show a processing error, not a change in fluid saturations within the formation. However, this effect is not seen within the reservoir portion of any of the wells. The lithology and mineralogy data were obtained from the detailed static earth model, which was built for the test reef. Within this model, sequence stratigraphic sections were determined. A full discussion of this model can be found in Miller et al. [6] The lithofacies were interpreted at the wellbore for 1-33 and 5-33. Due to the lack of well data in 2-33, this analysis was not possible. Overall, the strongest response in the logs is theorized to be from pressure changes. Other correlations were examined; however strong, readily relevant responses were not seen when compared to effective porosity and lithology, for example as shown in Fig. 8. As the increase in pressure, from approximately 400 psi (2758 kPa) to more than 1,100 psi (7584 kPa) was the primary change to the environment, and pressures have increased beyond the supercritical point of carbon dioxide, we expect to see more liquid phase in the near wellbore environment. The data obtained from repeat PNC logging are expected validate this finding. 5. Borehole gravity Borehole gravity surveys are conducted by stopping and reading the borehole gravity meter (BHGM) at a series of downhole stations that have been previously selected from examination of well logs to meet the survey objectives [10]. Gravity (Δg) and depth (Δz) differences measured between successive stations constitute the interval vertical gradient of gravity (Δg/Δz), which varies inversely with the density of the rock layer bracketed by the measurements. Borehole gravity data are converted to apparent or interval density profiles, which can be used for reservoir evaluation, well log and core analysis, surface gravity and seismic studies, or engineering and rock property investigations [10]. The baseline BHGM survey at the injection well was made with a small-diameter Gravilog tool (provided by Scintrex Limited of Toronto, Canada) using Baker Hughes’ logging cable winch system. This tool has been designed to log inside standard diamond drilling NQ (57 mm I.D.) drill rods, within boreholes that are deviated as much as 60˚ and to depths where ambient temperatures approach 70˚C [8]. Part of the package is the integrated natural gamma detector, which is used to correlate depth to a reference gamma log in order to place the Gravilog data on the correct depth reference. Overall, 35 downhole gravity stations were occupied between ground level and 5540 ft (1689 m) (Fig. 1). Most of the gravity stations were selected based on historical downhole gamma ray data to choose depths that could be reliably located and reoccupied at a later date. The planned survey included ~30 ft (9 m) station separations from near the bottom of the injection well to the top of the reef, then transitioned to ~150 to ~300 ft (~46 to ~91 m) stations up to ground surface. The station intervals through the injection zone were decreased to provide more detailed information of CO2 accumulations. Fig. 9 presents plots of BHGM apparent density. Apparent density logs can be calculated from BHGM data in several ways. The methods used in this study assume a horizontally layered earth, under which assumption the vertical gradient of gravity over the BHGM-logged section of the borehole is determined solely by the density variations within the logged section. An inversion method was applied to allow stable calculation of interval densities over much closer station spacings than are feasible using the traditional conversion method. A more detailed summary of the BHGM inversion method can be found in MacQueen [11].
Jacqueline Gerst et al. / Energy Procedia 63 (2014) 3923 – 3934
3931
The results, when fully interpreted, will provide qualitative and quantitative data for identification, correlation, and imaging of subsurface structure and stratigraphy. The intent is to repeat the survey at the end of CO 2 injection operations to monitor changes in the reservoir before and after injection in response to CO2 accumulation within the reservoir.
Fig. 8. Selected interval in the 5-33 well showing the increase in sigma, signifying an increase in pressure.
3932
Jacqueline Gerst et al. / Energy Procedia 63 (2014) 3923 – 3934
Fig. 9. BHGM apparent density profile from borehole gravity survey in the injection well.
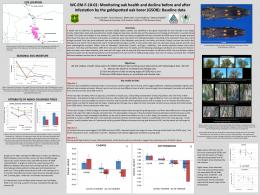
6. InSAR Remote sensing technologies for monitoring land surface deformation can be a cost-effective method to demonstrate long-term geological security. InSAR (interferometric synthetic aperture radar) is a satellite-based technology that obtains high-precision information on the position of the ground surface. InSAR has been used to monitor small-scale, surface-level changes in response to injection of CO2 in the subsurface at other carbon sequestration test sites. The most prominent example is the In Salah project in Algeria, in which an injected mass of 3 million tons of CO2 produced a measurable surface displacement of approximately 5 mm/year [12]. Battelle is investigating the applicability of satellite SAR products to the northern Michigan MRCSP field site, which—unlike the desert environment of the In Salah site—is a vegetated area with agricultural areas and forests. An 80 square kilometer area of interest (AOI) was delineated that encompasses the test reef, other reefs owned by Core Energy, and a nearby natural gas storage field (Fig. 10). The baseline analysis was carried out on the first 6 months of Cosmo-SkyMed (CSK) radar imagery acquired from April 22, 2012, to October 23, 2012 (Fig. 10). The nature of the terrain, with low wooded slopes, farmed fields, and open, cleared areas, provided a reasonable density of natural reflectors. Both permanent scatterers (PS) and distributed scatterers (DS) were identified within the AOI. Buildings and other man-made structures, as well as natural features such as exposed ground, are likely sources of stable PS and DS targets. The baseline analysis resulted in a density of 211 PS and DS per square kilometer (545
Jacqueline Gerst et al. / Energy Procedia 63 (2014) 3923 – 3934
3933
measurement points per square mile), which provided a comprehensive overview of ground movement in this area during the 6-month period. The results obtained from the baseline analysis of the CSK imagery demonstrate that the 80 square kilometer AOI is prevalently stable. More than 92% of the measurement points indicated minimal deformation measured (less than 15 mm), and an average surface deformation rate of -1 mm/year was identified. Monitoring is scheduled to continue over more than 2 years (to coincide with the CO2 injection), with radar imagery continuing to be acquired with the Cosmo-SkyMed constellation of satellites. Longer-term data are expected help to reduce the level noise caused by natural seasonal variations. Also, during the long-term CO2 injection monitoring period, artificial corner reflectors (ACRs) will be used for monitoring in addition to using natural features (Fig. 10). The distribution of ACRs is intended to supplement the data provided by PS-type radar targets. Data collection and analysis for the injection monitoring period is currently underway.
Fig. 10. (a) Results of baseline analysis for 80 km2 area of interest; (b) locations of the ACRs installed over the test reef with all PS-type measurement points identified from the baseline analysis.
7. Conclusions Overall, the baseline MVA program yielded important first steps for future analysis. While oftentimes the data supported and strengthened the baseline interpretations, rather than changing them, this is a positive result. It demonstrates that an accurate geologic interpretation can be made on the older set of data, and that the baseline MVA data fit well into the field context. The VSP was selected due to the complex geologic conditions that limit the usefulness of traditional seismic data. Significant glacial till and numerous evaporite beds cause it to be difficult to interpret the internal structure of a reef. We show how the increase in data fidelity from the VSP has confirmed the developed static earth model and may be used for future analyses. Microseismic monitoring validated our geologic understanding of injection within a depleted reef. Microseisms primarily occur when the injection pressures exceed the fracture pressure. In this case, however, the production of oil from the reef has reduced the formation pressure; therefore, microseisms from fracturing were not expected during the initial injection and none were observed.
3934
Jacqueline Gerst et al. / Energy Procedia 63 (2014) 3923 – 3934
MRCSP is assessing the value of advanced wireline logs such as PNC in a complex depositional environment with multiple fluids present (CO2, saline, oil, and/or natural gas). We discussed how PNC logging has contributed to the assessment of current fluid interfaces as well as the inherent difficulties of using PNC data to determine CO 2 saturation in a multi-phase environment with limited initial data. Gravity measurements were collected using a borehole gravity meter at points within the injection well. The gravity measurements were then inverted for density. We described the operation and design of the survey and how the results will be integrated into the geologic model. Finally, InSAR satellite monitoring to look for any quantifiable, small-scale, surface-level changes related to injection of CO2 was discussed. Although this technique does not directly contribute to the geologic characterization of the reef itself, it may contribute to the understanding of the overall injection operations and how they interact with the rest of the geologic column. As injection is ending, each monitoring technique will be scrutinized to determine if, how, and when it will be repeated. For example, velocity sensitivity analyses are being completed for the VSP to determine what the minimum detectable change will be. Repeated PNC log timing is being evaluated to determine when the largest change due to composition versus pressure change may be determined. The results of these types of analyses will be used to develop the post-injection MVA plan. Acknowledgements MRCSP is led by Battelle and supported by U.S. Department of Energy National Energy Technology Laboratory under Cooperative Agreement no. DE-FC26-0NT42589 with co-funding from several other partners. Core Energy, LLC and its staff are acknowledged for providing access and field implementation support for the large-scale test. Significant contributions were also provided by Matthew Place, Caitlin McNeil, and Darrell Paul of Battelle. References [1] Rodosta T, Brown B, Myer L, Wildman D, Kane R. U.S. DOE/NETL Core R&D Program for Carbon Storage Technology Development. Session 9C. In: Proceedings of the 12th International Conference on Greenhouse Gas Control Technologies, October 6 – 9, 2014, Austin, Texas, USA. [2] Gupta N, Ball D, Sminchak J, Gerst J, Kelley M, Place M, Bradbury J, Cumming L. Geologic storage field tests in multiple basins in Midwestern USA–Lessons learned and implications for commercial deployment. Energy Procedia 2011;4:5565–5572, ISSN 1876-6102, http://dx.doi.org/10.1016/j.egypro.2011.02.544. (http://www.sciencedirect.com/science/article/pii/S187661021100823X). [3] Gupta N, Cumming L, Kelley M, Paul D, Mishra S, Gerst J, Place M, Pardini R, Modroo A, Mannes R. Monitoring and Modeling CO2 Behavior in Multiple Oil Bearing Carbonate Reefs for a Large Scale Demonstration in Northern Lower Michigan, Energy Procedia. 2013;37:6800–6807,ISSN1876-6102,http://dx.doi.org/10.1016/j.egypro.2013.06.613. (http://www.sciencedirect.com/science/article/pii/S1876610213008564). [4] Gupta N, et al. Testing for large-scale CO2-enhanced oil recovery and geologic storage in the Midwestern USA. In Proceedings of the 12th International Conference on Greenhouse Gas Control Technologies, October 6 – 9, 2014, Austin, Texas, USA. [5] Kelley M, et al. Reservoir characterization from pressure monitoring during CO2 injection into a depleted pinnacle reef – MRCSP commercial-scale CCUS demonstration project. In: Proceedings of the 12th International Conference on Greenhouse Gas Control Technologies, October 6 – 9, 2014, Austin, Texas, USA. [6] Miller J, et al. Alternative conceptual geologic models for CO2 injection in a Niagaran Pinnacle Reef Oil Field, Otsego Co, Michigan USA. In: Proceedings of the 12th International Conference on Greenhouse Gas Control Technologies, October 6 – 9, 2014, Austin, Texas, USA. [7] Ravi Ganesh P, et al. Assessment of CO2 injectivity and storage capacity in a depleted pinnacle reef oil filed in Northern Michigan. In: Proceedings of the 12th International Conference on Greenhouse Gas Control Technologies, October 6 – 9, 2014, Austin, Texas, USA. [8] Nind C, Seigel HO, Chouteau M, Giroux, B. Development of a borehole gravimeter for mining applications. First Break. 2007;25:71–77. [9] Ansari R, Mekic N, Chace D, Rust M, Starr M. Field Applications of a New Cased Hole Gas Saturation Measurement in Tight Gas Reservoirs. SPWLA 50th Annual Logging Symposium. June 21–24, 2009. [10] Beyer LA. Borehole Gravity Surveys: Theory, Mechanics, and Nature of Measurements. Number 83-76 in the Open-File Report Series. U. S. Geological Survey, 1983. [11] MacQueen JD. High-resolution density from borehole gravity data. In: Expanded Abstracts of the Technical Program (77). Society of Exploration Geophysicists, 2007. [12] Vasco DW, Rucci A, Ferretti A, Novali F, Bissell RC, Ringrose PS, Mathieson AS, Wright IW. Satellite-Based Measurements of Surface Deformation Reveal Fluid Flow Associated with the Geological Storage of Carbon Dioxide. Geophys Res Lett. 2010;37:L03303, 5p.