Scientific Computing for Biologists. Hands-On Exercises, Lecture 8. Paul M.
Magwene. 25 October 2011. Discriminant Analysis in R. The function lda(), found
in ...
Scientific Computing for Biologists Hands-On Exercises, Lecture 8 Paul M. Magwene 25 October 2011
Discriminant Analysis in R The function lda(), found in the R library MASS, carries out linear discriminant analysis (i.e. canonical variates analysis). > library(MASS) #load the MASS package > z z Call: lda(Species ~ Sepal.Length + Sepal.Width + Petal.Length + Petal.Width, data = iris, prior = c(1, 1, 1)/3) Prior probabilities of groups: setosa versicolor virginica 0.3333333 0.3333333 0.3333333 Group means: Sepal.Length Sepal.Width Petal.Length Petal.Width setosa 5.006 3.428 1.462 0.246 versicolor 5.936 2.770 4.260 1.326 virginica 6.588 2.974 5.552 2.026 Coefficients of linear discriminants: LD1 LD2 Sepal.Length 0.8293776 0.02410215 Sepal.Width 1.5344731 2.16452123 Petal.Length -2.2012117 -0.93192121 Petal.Width -2.8104603 2.83918785 Proportion of trace: LD1 LD2 0.9912 0.0088
The prior argument given in the lda() function call isn’t strictly necessary because by default the lda function will assign equal probabilities among the groups. However I included this argument call to illustrate how to change the prior if you wanted. The output give some simple summary statistics for the group means for each of the variables and then gives the coefficients of the canonical variates. The ‘Proportion of trace’ output above tells us that 99.12% of the between-group variance is captured along the first discriminant axis.
Shorthand Formulae in R You’ve encountered the use of model formulae in R several times, such as in the call to lda() above and when carrying out various regressions. The document “An Introduction to R” (dis1
tributed with R and available at the R project website) gives a concise summary and a number of examples of how to construct formulae in R (see Defining statistical models: formulae). Relevant to our current example is a shorthand way for specifying multiple variables in a formula. In the example above we called the lda() function with a formula of the form: Species ~ Sepal.Length + Sepal.Width + ....
Writing the names of all those variables is tedious and error prone and would be unmanageable if we were analyzing a data set with tens or hundreds of variables. Luckily we can use the shorthand name ‘.’ to specify all other variables in the data frame except the variable on the left. For example, we can rewrite the lda() call above as: > z plot(z) # 2D scatter plot of specimens in CVs 1 and 2 > plot(z, abbrev=T) # use abbreviated group names
You can also create a plot to look at group variation along just the first canonical variate: > plot(z, dimen=1,type=’both’) # plot histograms and density plots for each group along 1st CV
The plot call on the object returned by lda() allows some additional customization of the plot, but the extent of graphical tuning is limited: > plot(z, abbrev=T, xlab=’CV1’, ylab=’CV2’) # change the x- and y-axis labels
If you want to do any more fine tuning of the plot you’ll have to calculate the CV scores from the coefficients and reconstruct the plot to your liking. Below I give an example of how to do that: > iris.data iris.mtx dim(iris.mtx) [1] 150 4 > iris.cv dim(iris.cv) [1] 150 2 > group.symbols plot(iris.cv, pch=group.symbols, asp=1, xlab="CV1", ylab="CV2")
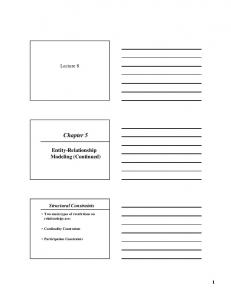
The definition of group.symbols and the use of the pch argument require a little explanation. pch is short-hand for ‘plotting character’ and specifies the symbols used to represent each observation in the plot. These symbols can either be letters or integers in the range 0-25. The integers refer to a standard set of symbols shapes defined in R. Figure 1 gives those symbols. If you’d like to see a function that prints out all the standard symbols type ?points and check out the pchShow function defined in the example at the bottom of the documentation page. To see this example in action type example(points). After typing example(points) you can call the pchShow function directly (that’s how I generated the figure). 2
plot symbols : points (... pch = *, cex = 2.5 )
0
5
10
15
20
1
6
11
16
21
2
7
12
17
22
3
8
13
18
23
4
9
14
19
24
25
Figure 1: Standard R symbols, and their corresponding integer values, accessible via the pch argument to plot.
The group.symbols sexes = as.factor(c(’M’,’F’,’F’,’M’,’F’)) > sexes [1] M F F M F Levels: F M > c("a","b")[sexes] [1] "b" "a" "a" "b" "a"
Here I created a simple example involving five specimens where each specimens was categorized by sex. The as.factor function tells R to treat the characters in the vector as factor levels. I then assigned each specimen a label, either“a” or “b” depending on its sex. If I wanted to extend that example to our three species iris data set I could do something like: > group.symbols = c("a","b","c")[iris$Species] > plot(iris.cv, pch=group.symbols, cex = 0.75, asp=1, xlab="CV1", ylab="CV2")
This draws each specimen with the label “a”, “b”, or “c” depending on which species it is assigned to. Notice that in the last example I used the cex argument to make the symbols smaller than normal. What if i wanted to also plot the group means in the canonical variate space? The following example shows how to do that: > group.symbols = c(0,2,4)[iris$Species] # I decided to go back to plotting symbols > group.colors = c(’red’,’darkorange’,’blue’)[iris$Species] # I also want to use colors
3
> cv1.means cv1.means setosa versicolor virginica 5.502493 -3.930156 -7.887657 > cv2.means cv2.means setosa versicolor virginica 6.876606 5.933573 7.174239 > plot(iris.cv, pch=group.symbols, cex = 0.75, asp=1, xlab="CV1", ylab="CV2", col=group.colors) > points(cv1.means, cv2.means, pch=16, cex=1.5, col=’black’)
Note the use of the points() function. This function draws on top of rather than erasing the previous plot. Note too the use of the col argument in the plot() call to specify different colors. If you’d like to see a chart of all the colors in R check out this web page: A Chart of R Colors. I stated in lecture that for the canonical variate diagram we can estimate the 100(1 − α) confidence region for a group mean as a circle centered at the mean having a radius (χ2α,r /ni )1/2 where r is the number of canonical variate dimensions considered. Using similar reasoning the 100(1 − α) confidence region for the whole population is given by a hypersphere centered at the mean with radius (χ2α,r )1/2 . To calculate these confidence regions you could look up the appropriate value of the the χ2 distribution in a book of statistical tables, or we can use the qchisq() function which gives the inverse cumulative probability distribution for the χ2 function: > chi2 = qchisq(0.05,2, lower.tail=F) > chi2 [1] 5.991465 > group.lengths = tapply(iris$Species, iris$Species, length) > group.lengths setosa versicolor virginica 50 50 50 > mean.radii = sqrt(chi2/group.lengths) > pop.radii = rep(sqrt(chi2),3) > help.search("circle") # I don’t remember off hand how to draw circles so let’s look it up > library(tripack) # I decided to use the circles function in the ’tripack’ package > circles(cv1.means, cv2.means, pop.radii,lty=’dashed’) > circles(cv1.means, cv2.means, mean.radii,lty=’dotted’)
Let’s put the finishing touch on our plots by adding some color coded rug plots to the first CV axis. For completeness I’ll include all the previous steps used to generate the plot: > > > > > > > >
plot(iris.cv, pch=group.symbols, cex = 0.75, asp=1, xlab="CV1", ylab="CV2", col=group.colors) points(cv1.means, cv2.means, pch=16, cex=1.5,col=’red’) circles(cv1.means, cv2.means, pop.radii,lty=’dashed’) circles(cv1.means, cv2.means, mean.radii, lty=’dotted’) rug(iris.cv[,1][iris$Species=="setosa"],col="red") rug(iris.cv[,1][iris$Species=="versicolor"],col="darkorange") rug(iris.cv[,1][iris$Species=="virginica"],col="blue") title("Canonical Variates Analysis\nof Anderson’s Iris Data")
If you did everything right (and I cut and pasted correctly!) you should get a plot that looks like Figure 2. If I was going to be repeatedly generate these types of plots I would wrap up the key steps discussed above into a convenient function.
Calculating the Within and Between Group Covariance Matrices The lda() function conveniently carries out the key steps of a canonical variates analysis for you. However, what if we wanted some of the intermediate matrices relevant to the analysis such as 4
0
5
CV2
10
15
Canonical Variates Analysis of Anderson's Iris Data
-10
-5
0
5
CV1
Figure 2: Ordination of iris specimens in the space of the first two canonical variates. The dashed circles surrounding each species distribution give the approximate 95% tolerance regions for the population distributions. See text for details on the construction of this plot.
the within- and between group covariances matrices? The code below shows you how to calculate these: > g = iris$Species > group.means group.means Sepal.Length Sepal.Width Petal.Length Petal.Width setosa 5.006 3.428 1.462 0.246 versicolor 5.936 2.770 4.260 1.326 virginica 6.588 2.974 5.552 2.026 > Dwin nobs ngroups win.cov btw.cov.unweighted mahalanobis(group.means, group.means[1,], win.cov) setosa versicolor virginica 0.00000 89.86419 179.38471 > mahalanobis(group.means, group.means[2,], win.cov) setosa versicolor virginica 89.86419 0.00000 17.20107 > mahalanobis(group.means, group.means[3,], win.cov) setosa versicolor virginica 179.38471 17.20107 0.00000
5
A Literature Based Assignment Assignment: Identify a paper from the literature (published in the last decade) that employs one or more of the following multivariate statistical techniques: 1. Multivariate regression 2. Principal Component Analysis 3. Singular Value Decomposition 4. Canonical Variate Analysis (or an alternate discriminant function) Write a short report discussing the use of these techniques in the paper and how the application of these methods contributed to the author’s conclusions or understanding of the data. Your report should touch on any assumptions (explicit or implicit) that are relevant to the statistical analysis and discuss whether you feel the author’s conclusions are justified or well supported (again based on the statistical anlaysis). Include in your report a brief outline (bullet points) that lays out the key steps (e.g. handling of missing data, normalization) and the primary R functions that you would use to repeat the analysis yourself. Specify whether the author(s) have made their multivariate data set available.
6


![[PDF] Practical Computing for Biologists - Google Sites](https://m.moam.info/img/260x300/pdf-practical-computing-for-biologists-google-site_647779c4097c474c228c11b6.jpg)