client and server, the ping round trip time and the. HTTP request .... for Internet host proximity [CC95, IWR]. Unlike the ... likely to be a good predictor of the HTTP.
Selection Algorithms for Replicated Web Servers Mehmet Sayal+,
Yuri Breitbart *,
+ Northwestern University Dept. of Electrical & Computer Eng. 2145 Sheridan Rd Evanston, IL 60208 {mehmet, peters}@ece.nwu.edu
Abstract Replication of documents on geographically distributed servers can improve both performance and reliability of the Web service. Server selection algorithms allow Web clients to select one of the replicated servers which is "close" to them and thereby minimize the response time of the Web service. Using client proxy server traces, we compare the effectiveness of several “proximity” metrics including the number of hops between the client and server, the ping round trip time and the HTTP request latency. Based on this analysis, we design two new algorithms for selection of replicated servers and compare their performance against other existing algorithms. We show that the new server selection algorithms improve the performance of other existing algorithms on the average by 55%. In addition, the new algorithms improve the performance of the existing nonreplicated Web servers on average by 69%.
1.
Introduction
Although the Web is becoming a widely accepted medium for distributing all kinds of data and services, it provides relatively poor performance and low reliability. For example, a multi-second response time for downloading a 5 KB document is not unusual. Similarly, the mean time to failure (MTTF) of Internet servers has been measured as 15 days [LMG95] which is significantly below the
Peter Scheuermann+, *
Radek Vingralek*
Bell Laboratories Lucent Technologies 600 Mountain Avenue Murray Hill, NJ 07974 {yuri,rvingral}@research.bell-labs.com
levels found in other information systems such as database servers [G90]. Replication of Web documents can improve both performance and reliability of the Web service. After a server failure, Web clients can still satisfy their requests from another server, which replicates the requested document. Many popular Web sites already employ a replication (mirroring) of their sites. For example, users can select among 101 different servers to download the Netscape browser, 15 different servers to access Yahoo in the US, 12 servers to access Lycos , 8 servers to access America Online, 7 servers to access Alta Vista and 3 servers to access Infoseek. However, the server replication is not transparent to the user; the user must manually select the server which is “closest” to him/her to get a fast response time. If that server does not respond, the user must manually satisfy the request from another replicated server. We argue that server replication could and should be completely transparent to the user. In fact, we are in the process of designing a system which provides such a mechanism. The success of a transparent Web server replication system critically depends on the criteria used for selection of replicated servers, which in turn depends on the exact notion of “proximity” metric. The “proximity” metric impacts both the response time perceived by the user and the overhead involved in
measuring the distance. There are several ways to define “proximity” of a server and a client: the number of hops between the client and the server [GS95,F97], the geographic proximity of the client and the server [GSe95], the round trip time of a ping request sent from the client to the server [CC95,IWR], and finally the response time of an HTTP request sent from the client to the server. In this paper we empirically evaluate each of the above proximity metrics using client traces collected at Northwestern University. We show that both the number of hops and the ping round trip time are poor indicators of the resulting HTTP request response time. Ideally, the selection of replicated servers should be based directly on the HTTP request response time. However, since the HTTP request response time depends on the document size, which is unknown at the time of issuing a request, we propose to use the HTTP request latency as a substitute for the HTTP request response time. We measure HTTP request latency as the response time of servers for very small documents. Given the fact that most Web documents tend to be small, we show experimentally that the HTTP request latency and the HTTP request response time are statistically highly correlated. We propose two new algorithms for the selection of replicated servers using the HTTP request latency, and compare their performance with other existing algorithms. We show that the new server selection algorithms improve the performance on the average by 55% when compared to other existing algorithms. In addition, the new algorithms improve the performance on the average by 69% when compared to the existing non-replicated Web servers. At the same time, the new algorithms incur only a minimal extra network overhead. The paper is organized as follows: in Section 2 we present the results of our trace analysis. In
Section 3 we define two new algorithms for server selection and evaluate their performance. In Section 4 we discuss related work and we conclude with Section 5.
2.
Server Proximity Metrics
The HTTP server response time is the most relevant metric from the users’ point of view and ideally, it should be used by all clients to determine the proximity of replicated servers. However, the HTTP request response time depends on network traffic, server load and document size. Hence, using the HTTP request response time as a metric for proximity may lead to substantial overhead in collecting measurements, given that these factors fluctuate between different requests. Therefore, several other metrics have been used to approximate the HTTP request response time. The number of hops between a client and a server is one common approximation [GS95,F97]. Its primary advantage is that it is relatively static. For example, it has been shown that over 87% of routes remain stable for at least six hours and 68% for at least seven days [P97]. Moreover, the number of hops can be obtained directly from the routing tables without incurring any additional network load. However, since the speed of links may vary together with their load, it is not a priori clear whether the number of hops can provide any estimate of the HTTP request response time. In order to evaluate the relationship between the number of hops and the HTTP request response time, we have collected a client proxy trace in our computer lab at Northwestern University. The trace contains approximately 15K HTTP GET requests referencing 1348 distinct HTTP servers. We
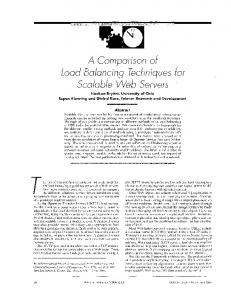
measured the number of hops between each server referenced in the trace and a corresponding client at Northwestern University using the traceroute utility. The histogram depicting the distribution of number of hops is given in Figure 1. The distribution is close to a normal distribution except for a singularity, i.e., a peak at 4 hops, which is due to other servers accessed on the campus of Northwestern University. 6000
5000
Number of Requests
4000
server. In order to ascertain the degree of dependency between the ping round trip time and the HTTP request response time, for every HTTP request in the trace we sent a ping request to the server holding the requested document immediately after receiving a response. This is done in order to guarantee that the network load remains relatively stable. We have found that the correlation between the ping round trip time and the HTTP request response time is 0.51. Although the value is higher than the correlation between the number of hops and the HTTP request response time, it still does not constitute a high reliability indicator to be used in predicting the HTTP request response time.
3000
2000
1000
0 1
2
3
4
5
6
7
8
9
10 11 12 13 14 15 16 17 18 19 20 21 22 23 24 25 26 27 28 29 30 Number of Hops
Figure 1: Distribution of hop distance of servers from a Northwestern University client (x-axis: # of hops; y-axis: # of requests). We found that the correlation between the number of hops and the HTTP request response time is 0.16, which is relatively low. Consequently, the number of hops between a client and a server gives very little indication of the response time that an HTTP server might deliver to the client. Our finding is consistent with that of Crovella and Carter [CC95], who report a similar result. The round trip time of the packets sent by the ping utility [S94] is another common metric for Internet host proximity [CC95, IWR]. Unlike the number of hops, the ping round trip time reflects the network load on the route between the client and the server. However, the ping round trip time does not provide any indication of the load and speed of the HTTP
Another possibility is to assume that the HTTP request response times are stable within a short period of time and to estimate the response time of a new HTTP request from the response times of HTTP requests previously sent to the same server. However, the response time also depends on the size of the document, which is not known at the time the document is requested. Instead, we propose to use the HTTP request latency, i.e., time to receive the first byte of a response, as a substitute for estimating the HTTP request response time. The HTTP request latency can be viewed as HTTP response time for very small documents. We argue that this substitute, which is independent of the document size, is likely to be a good predictor of the HTTP request response time because most Web documents tend to be small. For example, 90% of referenced documents in our traces are smaller than or equal to 10 KB, as it is shown in Figure 2. The distribution of document sizes referenced in the traces can be found in Figure 3. In our traces we have found that the correlation between the HTTP latency and the HTTP request response time is 0.73. This correlation is 356% higher than that of the
number of hops and 43% higher than that of the ping round trip time.
Larger than 10 Kilobytes 10%
Smaller than or equal to 10 KB. 90%
Figure 2: Percentages of small vs. large files in our traces.
14000
12000
# of Requests
10000
8000
6000
4000
2000
0 1
11
21
31
41
51
61
71
81
91
F ile Siz e (KB)
Figure 3: Distribution of sizes of referenced documents in our traces (x-axis: file size; y-axis: # of requests).
3.
Server Selection Algorithms
Based on the analysis carried out in the previous section, we introduce two new server selection algorithms: Probabilistic and Refresh. Both of the algorithms select a server that provided the minimal latency for previously sent HTTP requests. A straightforward implementation of such an algorithm leads to a form of starvation. Once a
client selects a given server as its closest server, it keeps directing all of its requests to that server and is not responsive at all to changes in the HTTP request latencies of the “non-optimal” servers. Hence, the fact that the load of these servers could increase or decrease over time is not considered by the client and these non-optimal servers could starve. Consequently, there is a need for some mechanism that will enable clients to refresh the latency information associated with the “non-optimal” servers. The Probabilistic algorithm refreshes the latency information associated with the "nonoptimal" servers in a manner similar to simulated annealing. Rather than always sending requests to the closest server, the requests are sent to every server with a probability inversely proportional to the most recently measured latency for the server. Consequently, most of the time the requests are sent to close servers, but from time to time the requests are also sent to more distant servers in order to refresh their latency information. The drawback of the Probabilistic algorithm is that it has no control over how often it sends requests to "non-optimal" servers which is directly dictated by the measured HTTP request latencies. On the other hand, the algorithm does not generate any extra requests to refresh the latency information associated with the "non-optimal" servers. The Refresh algorithm always sends all requests to the server with the least HTTP request latency. However, each latency value is given only a limited valid time. After the valid time has expired, a new latency value is obtained by sending an extra asynchronous HTTP HEAD request to the corresponding server. Unlike the Probabilistic algorithm, the Refresh algorithm generates extra requests to refresh the latency information of non-optimal
servers. However, it is possible to explicitly control the number of such requests by changing the setting of the valid time parameter. We have compared the performance of the Probabilistic and the Refresh algorithms against other published server selection algorithms. In particular, we considered the following algorithms in the comparison: 1. Fixed: Client sends all requests to a fixed server. This algorithm reflects the current situation on the Web with no server replication. 2. Ping:Client periodically sends a ping request to each server and redirects all HTTP requests to the server with minimal ping round trip time [CC95]. 3. Hops: Client sends all requests to a server that has the closest distance from the client in terms of the number of hops [GS95]. 4. Parallel: Client sends parallel requests to all servers replicating the document and waits for the first response. 5. Probabilistic: The probability that a given server is selected is given by Probi = K / lati, where lati is the average HTTP request latency on server i and K is normalizing constant defined as K = 1 / Σi(1/lati). 6. Refresh: The server with the minimal HTTP request latency is chosen. Each latency sample is assigned a “valid time”. After the valid time expires, the samples are refreshed using an extra HEAD request sent asynchronously to the server. To study the scalability of these six algorithms we have conducted two sets of experiments, one with 50 servers and another one with 5 servers chosen out of the first set of 50 servers. Recently, several Internet service providers started to replicate documents on the Web. For example such popular service
providers as Yahoo, Netscape, America Online, NCSA, replicate their most popular documents on 3 to 101 different servers. Consequently, we selected a degree of replication from 5 to 50. The servers that we used in our experiments were selected in topdown popularity order as measured by our trace. We excluded the servers at Northwestern University campus in order to ensure that the server selection is indeed nontrivial. In each experiment, we assumed that the same document is replicated on all servers. Since, in reality the servers contained distinct documents with different sizes, we measured only the latency of HTTP request which is independent of the document size. We implemented our experiment as a Java application that acts like a Web client, and sends requests to selected Web servers by using the algorithms explained above. For each algorithm, it selects the server(s) using the algorithms one by one, sends requests, and records latencies separately for each one. We repeated experiments 2000 times, each time measuring the latency for every single algorithm, in order to achieve 95% confidence intervals within 5% of the reported average latency values. We ran the same series of experiments during daytime and nighttime in order to study the impact of network load on the performance of the evaluated algorithms. All experiments are performed on the real network using our Web client program. This may rise some concerns about the server configurations; some servers may be not be properly configured, and can affect our test results by unusually long latencies. Unfortunately, we do not have any control on the Web servers. Even if there are some misconfigured servers in our traces, we believe that it reflects a reality about the Web traffic, which could not have been recognized in a simulation. Therefore, we believe that server
The reported latencies for the Ping, Probabilistic and Refresh algorithms include the latencies measured during an initial warm up period in which the client collected latency samples for all servers in the replication group. In order to choose servers based on previous measurements, the client has to have at least one measured value for each server to start with. We set the “valid time” parameter of the Refresh algorithm to three minutes in all experiments. This value was chosen to be larger than the longest possible latency, and calculated using the mean and standard deviation of measured latency values in our trace. 700
As expected, the Parallel algorithm provides the best latency in all cases. However, it is important to observe here that the results of the Parallel algorithm do not reflect the situation where all clients on the Web employ the same server selection strategy. If this were the case, additional significant network delays would also have been encountered even for low degrees of server replication (5-server case) because five times as many requests would have been generated. 1800
1779.02
1600
1400 1256.51 Avg. HTTP Request Latency (ms)
configuration is not an issue to worry about in our experiments.
1200
1000 Day Night
800 725.77 632.46 595.37
600
637.91
517.13 421.61
600
412.02
400
553.24 267.43
Avg. HTTP Request Latency (ms)
136.29
200
500 457.18
87.32
483.86
82.15
0
400
Day
370.4 317.25
Fixed Host
Hops
Ping
Parallel
Probabilistic
Refresh
Night
305.67
300 259.64 203.47 200 158.82
93.49
100
92.57
0 Fixed Host
Hops
Ping
Parallel
Probabilistic
Refresh
Figure 4: Average HTTP request latencies for 5-server replication group (x-axis: algorithm names; y-axis: latencies. The results of the experiments for the 5-server replication group are depicted in Figure 4, while the results for 50-server replication group are given in Figure 5. In both cases, the results reported for the Fixed algorithm correspond to an average HTTP request latency calculated across all servers in the given replication group.
Figure 5: Average HTTP request latencies for 50-server replication group (x-axis: algorithm names; y-axis: latencies. Among the remaining algorithms, the Refresh algorithm consistently provides the best latency. The Probabilistic algorithm leads to a slightly higher latency, on the average 38% (at least 15%, at most 66%) higher than the Refresh algorithm, but does not generate any additional network load. Both algorithms also outperform the Hops and Ping algorithms on the average by 55% (the improvements range from a minimum of 29% to a maximum of 78%), confirming the results from Section 2. All server selection algorithms, with the exceptions of nighttime for Hops and Ping, outperform the Fixed algorithm. With a smart choice of server selection algorithm, i.e., using either the Probabilistic or Refresh algorithm,
server replication improves the latency of the HTTP service on the average by 69% (the minimum improvement is 35%, while the maximum is 84%). Finally, it is important to observe that the Probabilistic and Refresh algorithms are the only ones that can be used indiscriminately with respect to the time of the day, i.e., changing network load, without causing too much extra load on the network and the client machine. As it is shown in Figures 4 and 5, during nighttime the Fixed algorithm outperforms either Ping or Hops, depending on server replication factor.
4.
Related Work
The performance benefits of server replication have been recognized in [B95, GSe95]. Caching goes Replication (CgR) [BMS96] and Smart Clients [YCE97] are two mechanisms for replication of HTTP, telnet or ftp services on top of the existing Web infrastructure. Both CgR clients and Smart clients can utilize the server selection mechanisms described in our paper.
Similarly to our own work, the algorithms’ performance is compared using client proxy traces. The authors consider a replication group of 10 servers. Their finding that the Ping algorithm outperforms the Hops algorithm, which in turn outperforms the Fixed algorithm, is consistent with our own results. Web server replication is also closely related to Web proxy caching in that they both improve the response time perceived by the user. However, there are important differences: Replicated Web servers can provide dynamically generated documents, while proxy caches cannot. Proxy caches provide only a weak consistency of the cached documents dictated by the HTTP protocol, while replicated servers can enforce arbitrarily strong consistency guarantees (for example, one copy serializability). Finally, replicated server increase end-to-end reliability of the service, while proxy server introduce a single point of failure.
5. Several algorithms for selection of replicated servers on the Web have been designed [CC95,GS95,GSe95,F97,IWR]. The algorithms are based on the distance in number of hops [GS95,F97], geographic proximity [GSe95] or ping round trip time [IWR]. However, with the exception of [CC95], none of the previous work studies the performance of their algorithms nor compares them with other algorithms. Several HTTP server selection algorithms have been studied in [CC95]. The authors compare algorithms similar to the Fixed, Ping, Hops and Parallel algorithms described in our paper. In addition, the authors also study a random selection algorithm and an algorithm based on geographic proximity [GSe95].
Conclusions
We have studied several algorithms for selection of replicated HTTP servers. Based on a client trace that we have collected, we show that neither the number of hops nor the ping round trip time is a good predictor of the HTTP request response time. On the other hand, our results demonstrate that the HTTP request latency, which we measure as the response time for very small documents, is a good predictor of the HTTP request response time, mostly because the majority of Web documents tend to have a small size. We propose two new algorithms, Probabilistic and Refresh, which utilize the HTTP request latency and incur only minimal extra overhead. Using client traces, we compare the
performance of both algorithms against other existing replicated server selection algorithms. We show that the new algorithms consistently outperform the best of the existing algorithms, namely the Ping or Hops algorithm based on replication rate, by 55% on the average, and in many cases by a factor of two. We also show that both of the new algorithms improve the performance of the existing Web (i.e. the Fixed algorithm) in the range of a factor of two and four. The experiments reported here are part of a larger system design effort that is aimed at achieving a scaleable client/server architecture for the Web that allows for data migration and replication.
[G90]
J. Gray. “A Census of Tandem System Availability Between 1985 and 1990.” Technical Report 90.1, Tandem Computers, January 1990.
[GS95]
J.D. Guyton, M.F.Schwartz. “Locating Nearby Copies of Replicated Internet Services.” SIGCOMM’95, Cambridge, MA, USA., pp. 288-298, 1995.
References
[IWR]
[B95] A. Bestavros. "Demand-based resource allocation to reduce traffic and balance load in distributed information systems", Proceedings of the 7th IEEE Symposium on Parallel and Distributed Processing, 1995. [BMS96] M. Baentsch, G. Molter, P. Sturm. "Introducing application-level replication and naming into today’s Web", Computer Networks and ISDN Systems, vol. 28, 1996. [CC95] M.E. Crovella, R.L. Carter. “Dynamic Server Selection in the Internet.” Proceedings of the Third IEEE Workshop on the Architecture and Implementation of High Performance Communication Subsystems (HPCS’95), June 1995. [F97] P. Francis. "A Call for an Internet-wide Host Proximity Service(HOPS)", available at http://www.ingrid.org/hops/wp.html.
[GSe95] J. Gwertzman, M. Seltzer. "The Case for Geographical Push-Caching", Proceedings of the Fifth IEEE Workshop on Hot Topic in Operating Systems, 1995. "Internet Weather Report (IWR)", available at http://www.mids.org/.
[LMG95] D. Long, A. Muir, R. Golding. “A Longitudinal Survey of Internet Host Reliability.” Proceedings of the 14th Symposium on Reliable Distributed Systems, 1995. [P97] V. Paxon. "End-to-End Routing Behavior in the Internet", ACM/IEEE Transactions on Networking, vol. 5, no. 5, 1997. [S94] W.Stevents. “TCP/IP Illustrated”, Volume1, Addison-Wesley, 1994. [YCE97] C. Yoshikawa, B. Chun, P. Eastham, A. Vahdat, T. Anderson, D. Culler. "Using Smart Clients to Build Scaleable Services", Proceedings of USENIX’97, 1997.