Semi-Supervised object recognition using flickr images Elisavet Chatzilari1,2 , Spiros Nikolopoulos1,3, Symeon Papadopoulos1,4, Christos Zigkolis4, Yiannis Kompatsiaris1 1 Centre for Research & Technology Hellas - Informatics and Telematics Institute 2 Centre for Vision, Speech and Signal Processing University of Surrey Guildford, UK 3 School of Electronic Engineering and Computer Science, QueenMary University of London 4 Aristotle University, Department of Informatics 54124, Thessaloniki, Greece
[email protected],
[email protected],
[email protected],
[email protected],
[email protected]
Abstract In this work we present an algorithm for extracting region level annotations from flickr images using a small set of manually labelled regions to guide the selection process. More specifically, we construct a set of flickr images that focuses on a certain concept and apply a novel graph based clustering algorithm on their regions. Then, we select the cluster or clusters that correspond to the examined concept guided by the manually labelled data. Experimental results show that although the obtained regions are of lower quality compared to the manually labelled regions, the gain in effort compensates for the loss in performance.
1. Introduction Humans can classify visual objects through models that are built using examples for every single semantic concept. Based on this assumption, researchers have been trying to simulate the human visual system by using machine learning algorithms to classify visual content. A set of training samples plays the role of the examples in the case of object detection schemes. These schemes typically employ some form of supervision in the process of gathering the required training samples, as it is practically impossible to learn how to recognize an object without using any kind of semantic information during training. However, semantic labels may be provided at different levels of granularity (global or region level) and preciseness (one-to-one, one-to-many, or many-to-many relation between objects and labels), imposing different requirements on the effort needed to generate them. In this paper we will use the term weakly annotated images and weakly supervised learning when there is one-to-many or many-to-many relation between the image regions and the provided labels [18]. This is usually
the kind of annotation that we get from search engines or collaborative tagging environments. Equivalently, we will use the term strongly annotated images and strongly supervised learning when there is one-to-one relation between the image regions and the provided labels [17]. This is usually the kind of annotation resulting from dedicated, manual annotation efforts. The annotation cost is a critical factor when designing an object detection scheme with the intention of scaling to many different objects and domains. In the following we categorize the state-of-the-art object detection methods based on the characteristics of the training samples that they employ and the effort required for their annotation. Our goal is to highlight the tradeoff between the annotation cost for preparing the necessary training samples and the quality of the resulting models. The methods relying on strongly supervised learning are usually developed to recognize certain types of objects with very high accuracy. For instance, [22] uses manual annotations to train face detection classifiers, [10] proposes a method for the recognition of buildings, while [7] introduces an implicit shape model for the detection of cars. In [23] region level manual annotations are used to train a probabilistic model integrating both visual features and spatial context. Annotating images at region level is the task with the highest annotation cost. Manually generated global annotations are easier to obtain than region level ones, since no effort is required for establishing one-to-one relations between the regions and the labels. This fact has motivated many researchers in developing algorithms that are able to exploit global annotations for performing object detection. In this case, the basic idea is to introduce a set of latent variables that encode hidden states of the world, where each state induces a joint distribution on the space of semantic labels and image visual features. New images are annotated by maximizing the joint density of semantic labels, given the visual features of the new image [1]. The most indicative of such algo-
rithms are the ones that are based on aspect models such as probabilistic Latent Semantic Analysis (pLSA) [18] and Latent Dirichlet Allocation (LDA) [9]. Following this idea, in [21] the recognition of visual objects is considered to be part of the segmentation process, and in [4] the expectation maximization algrithm is used for mapping words to image regions. In order to ease the tedious effort of manual annotation, semi-supervised learning algorithms were proposed. In this case, the objective is to exploit unlabelled data, which are usually of low cost and can be obtained in high quantities, in conjunction with a small amount of labelled data. In this direction, the authors of [8] use an a-priori given classifier and improve it by training a second classifier on labelled and unlabelled samples. An algorithm for improving the performance of any given base classifier trained in a supervised manner by adding a set of unlabelled samples is presented in [12]. Lately the excessive use of Web 2.0 applications has made available large amounts of user tagged images. Given that, the most recent research efforts are focusing on the social content that is being massively contributed by the web users. In [15] object and event detection is performed by clustering images downloaded from flickr based on textual, visual and spatial information and verified through Wikipedia1 content. Similarly a framework that probabilistically models geographical information for event and activity detection using geo-tagged images from flickr is presented in [6]. As a general conclusion we can say that manual image annotation is a time consuming task and as such it is particularly difficult to be performed on the volumes of content that are needed for building robust and scalable classifiers. On the other hand, the Web provides cost free annotations that are very noisy to be used directly for extracting the necessary probabilistic relations between objects and labels. This fact motivated the development of techniques that are able to exploit the noise reduction properties that characterize massive user contributions and use the collective knowledge aggregated in collaborative tagging environments to remove the aforementioned obstacles [16]. In this direction, we propose a framework for correlating image regions with labels guided by a small set of manually labelled regions, the validation set. In order to do that, for every concept, we construct a set of flickr images that focus on the examined concept. Then, we segment the images, extract features from the extracted regions and cluster the feature vectors. It is evident, that if the aforementioned visual analysis algorithms performed ideally the most populated cluster would contain the regions depicting the examined concept. Based on this, in our previous work [2], [3] we proposed to achieve one-to-one region-to-label mapping by 1 www.wikipedia.com
Table 1. Legend of used notation Symbol S ck Iq q RI q = {riI , i = 1, . . . , m} q fd (riI ) = {fi , i = 1, . . . , z} R = {ri , i = 1, . . . , w}
Definition An image group focused on object ck An image from S ck Regions identified in image I q by an automatic segmentation algorithm Visual features extracted from a region q riI Set of clusters created by clustering the regions extracted from all images of S ck based on their visual similarity
correlating the most populated visual cluster with the concept that the constructed image set was selected to focus on. However, our experiments have shown that, for some object categories, either the regions depicting the object of interest were split in many of the formulated clusters or noisy regions populated an irrelevant cluster and as a consequence forcing our correlation mechanism to fail. For this reason, we utilize a novel graph based clustering algorithm that is not forced to assign the noisy regions into clusters [14]. Moreover, the contribution of this work is on proposing a semi-supervised strategy to associate the appropriate cluster or combination of clusters to the examined concept, alleviating the effect of splitting the relevant regions into multiple clusters. A validation set of strongly annotated samples guides the selection strategy to decide which of the generated clusters are most likely to contain regions depicting the object of interest. This is essentially a post-clustering process that iteratively merges the clusters exhibiting highest performance on the validation set and reevaluates the performance of the merged cluster. In the end, all regions included in the merged cluster with the highest performance among all iterations, are mapped in a oneto-one relation with the object of interest. The rest of the manuscript is organized as follows. In section 2 we formulate the problem. In Section 3 we describe the general architecture of the framework we propose and provide technical details for the analysis components that are employed by our framework. Our experimental study is presented in Section 4, while Section 5 discusses the results and provides some directions for future work.
2. Problem formulation Our goal is to use tagged images from flickr and transform the one-to-many or many-to-many relations that characterize their label-to-region annotations into one-to-one relationships. One way to achieve this is through the semantic clustering of image regions to objects (i.e., each cluster consists of regions that depict a specific object). Semantic clustering can only be made feasible in the ideal case where
the image analysis techniques work perfectly. However, as this is highly unlikely, instead of requiring that each cluster is mapped to a label in a one-to-one relationship, we select an image group S ck that focuses on ck and we only search for the cluster or clusters where the majority of regions contained in them depict the focused object ck (Fig. 1). Thus the problem can be viewed as follows. Given a group of imI ages Iq ∈ S ck with information of the type {(fd(r1q ),. . . , Iq fd (rm )), ck }, we search for the group of regions rk that can be mapped with object ck in a one-to-one relation.
identified image segments, rather than the whole image. Finally, a clustering algorithm (3.3) is applied on the feature vectors extracted from the full set of regions R in order to acquire visually coherent groups of regions ri . Working under the assumption that every object exhibits some invariant visual characteristics that can be partially captured by the employed feature space, the remaining step is the strategy by which we decide which cluster or clusters of regions should be correlated with the focused object ck , achieving the one-to-one object-to-region mapping.
3.2. Cluster selection strategy SKY SKY SKY
SKY
SKY SKY
SKY
Figure 1. Framework Objective.
3. Object to Region Annotation Mapping 3.1. Baseline configuration Since we aim at detecting and localizing the object focused by a set of images, we need to be able to construct a set of images emphasizing on object ck using the available textual information (i.e., annotations). For this purpose we have relied on flickr groups2 , a public service offered by flickr. Flickr groups are virtual places hosted in collaborative tagging environments that allow social users to share content on a certain topic, which can also be an object. Thus, using this service, S ck is created by taking an adequate number of images from the flickr group that is titled with ck . Subsequently, segmentation is applied on all images in S ck in order to extract spatial masks of visually meaningful regions. In our work we have used a K-means with connectivity constraint algorithm [13] and segmented all images of S ck into an extensive set of independent image regions. In order to visually describe the segmented regions we have employed a bag-of-words [19] based algorithm with SIFT descriptors [11]. The adopted approach is similar to the one described in [20] with the important difference that in our case descriptors are extracted to represent each of the 2 http://www.flickr.com/groups/
We can represent the cluster selection strategy as a function rpositive = SelectRegions(R) that takes as input the set of generated clusters and selects the ones that represent the object of interest. In our previous work [3] we have relied on the intuition of perfect clustering dictating that the distribution of clusters’ population based on their population rank, will coincide with the distribution of objects’ #appearances based on their frequency rank. Motivated by this, we have selected the most populated of the generated clusters to be correlated with the object of interest. Eq. 1 shows this functionality by considering P op(·) to be a function that calculates the population of a cluster. rpositive = argmaxi (P op(ri ))
(1)
However, the errors introduced by the visual analysis algorithms had a high impact on the success or failure of (1). For this reason, in this paper we propose an adapted version of the self-training technique that aims to boost the efficiency of the cluster selection strategy using a small set of strongly annotated regions (i.e. validation set). Let’s denote Fscore (ri ) to be the performance (measured by the F1 score that is achieved on the validation set) of an object detection model which was generated using the regions of ri as positive examples. Our approach starts by using the validation set to calculate the Fscore (ri ) of all models created using each time the regions of a different cluster as positive examples. Then, starting from the best performing cluster, an iterative merging process is performed. In each iteration the algorithm merges the cluster exhibiting the next highest value for Fscore to the existing set of selected clusters and re-evaluates the performance of the newly created cluster Fscore (rrank1 ∪ rrank2 ∪ ... ∪ rranki+1 ), where rrank1 is the cluster exhibiting the highest Fscore , rrank2 the cluster with the second highest Fscore and so on. The iterations stop when the Fscore of the next cluster to be merged is zero. Finally, the combination of clusters (i.e. merged cluster) with optimal performance is chosen to be the one correlated with the object of interest. In this case the functionality of the cluster selection strategy can be represented as follows:
rpositive =
x [
rranki
(2)
i=1
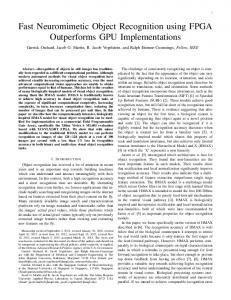
Sm where x = argmaxm (Fscore ( j=1 rrankj )) and Fscore (rrank1 ) > Fscore (rrank2 ) > ... > 0 Following the running example of Fig. 2, lets assume that R consists of four clusters so that F (Cluster1) > F (Cluster2) > F (Cluster3) > F (Cluster4) = 0. In the first iteration, the algorithm merges clusters 1 and 2 which yield the two highest values for Fscore . In the second iteration it adds cluster 3 which yields then next best performance. In iteration three, the next best Fscore is zero, so the algorithm stops the merging procedure. The decision is made to select the combination of clusters 1 and 2 which yields the highest performance of all examined combinations. Cluster 1+2 There are no more clusters with F>0
MAX
F score
Iteration 3 Clusters
Cluster 4
Cluster 1+2+3
Cluster 1+2
Cluster 1
Cluster 2
Cluster 3
Cluster 4
Cluster 3
Cluster 4
Iteration 2 Clusters
Iteration 1 Clusters
Clusters ranked by performance
Figure 2. Cluster selection algorithm diagram.
3.3. Clustering In order to compensate for the noise introduced by the visual analysis algorithms (i.e. segmentation and feature extraction) and boost the efficiency of the proposed cluster selection strategy, we have employed a noise resilient clustering algorithm that does not forcefully assign all regions into clusters but leaves the noisy regions out of the clusters’ distribution. Specifically, we have applied a novel graph based clustering algorithm [14] that takes as input a portion of the similarity measures between pairs of data points, constructs the network between the data points (regions in our case) and acquires a seed set of densely connected nodes. Then, starting from the community seed set the algorithm expands the communities by adding nodes to the communities which maximize the subgraph modularity function subject to the constraint that their degree does not
belong to the top 10 percentile of the node degree distribution (this implies that a single pass over the graph nodes is conducted in order to derive the node degree distribution) [14]. Employing the community detection with expansion algorithm, every data point can belong to zero, one or more clusters. Thus, we obtain an overlapping distribution of the region’s feature vectors over the communities.
4. Experimental Study The goal of our experimental study is twofold. First, we wanted to compare the quality of the training samples acquired by the proposed semi-supervised approach, with the population based selection strategy and the manually selected samples. In order to assess the quality of the different selection types, Support Vector Machines (SVMs) were chosen to train the models for object localization and recognition. The feature vectors of the regions associated with the object of interest were used as positive samples for training a binary classifier. Negative examples were chosen arbitrary from the remaining dataset. Second, we wanted to verify that the proposed cluster selection algorithm generalizes when moving from the validation to the test set. To carry out our experiments we have used a manually annotated and a social dataset. The first dataset is the publicly available SAIAPR TC-12 dataset [5] consisting of 20000 strongly annotated images. The dataset was split into 3 parts (70% train, 10% validation and 20% test). To acquire comparable measures over the experiments, the images of the manually annotated dataset were segmented by the segmentation algorithm described in Section 3.1 and the ground truth label of each segment was taken to be the label of the hand-labeled region that overlapped with the segment by more than the 2/3 of the segment’s area. In order to create the second dataset, we downloaded images from flickr groups for 15 of the concepts included in the SAIAPR TC12 dataset. For each object of interest, we have downloaded 500 member images from a flickr group that is titled with a name related to the name of the object, resulting in 15 groups of 500 images each (7500 in total).
4.1. Comparing object detection models Our goal is to compare the efficiency of the models trained using a set of regions selected according to: 1. the population-based method (eq. 1). Training set consists of flickr images only. 2. the proposed semi-supervised approach (eq. 2). Models were trained using only the flickr images and 2000 manually annotated images were used for selecting the appropriate cluster(10% of the SAIAPR TC-12 dataset).
3. the proposed approach adding to each model the images of the validation set. Models were trained using both the flickr images and 2000 manually annotated images(10% of the SAIAPR TC-12 dataset).
100 Weakly Supervised Semi−supervised Semi−supervised + Validation Strongly Supervised
90
80
70
4. the strongly supervised strategy. Training set consists 14000 manually annotated images(70% of the SAIAPR TC-12 dataset).
60
50
40
4.2. Generalizing from the validation to the test set The purpose of this experiment is to verify that the proposed selection algorithm can generalize from the validation to the test set. For this reason, we have calculated the performance (F score) of every model generated at each iteration of the algorithm on the validation and test set. Due to lack of space we chose to show only three of the concepts that were classified in the last case of section 4.1 (Fig. 4). Black and grey bars indicate the performance of every merged model generated at each iteration step of the selection algorithm on the validation and test set, respectively.
30
20
10
g
r
as s gr
bu ild in
e
ca
tre
sk y
n
at er w
ad
si g
ro
ir
er w
ch a
flo
t
n rs o pe
rd bi
bo a
e cy cl
rp l
bi
an
e
0
ai
In order to evaluate the performance of the models, we test them using the testing subset (i.e., 4000 images) of the strongly annotated dataset, not used during training or validation. Fig. 3 shows the F1 score of the generated models for each of the 15 concepts. By looking at the bar diagrams of Fig. 3 we can distinguish between three cases. In the first case we classify the objects airplane, bicycle, bird, boat, chair and flower that are too diversiform with respect to the employed visual feature space and as a consequence, none of the developed models (not even the one trained using the manual annotations) manage to achieve good recognition rates. In the second case we classify the objects building, car and sign that despite being adequately discriminated in the visual feature space (i.e., the model trained using the manually annotated samples performs relatively well), none of the other selection algorithms was able to select the regions depicting the examined concept. In the last case we classify the concepts water, road, person, sky, tree and grass where the proposed approach performs well. We can also notice that for the cases of water and road the population based selection algorithm fails to select the proper cluster but the semi-supervised selection algorithm manages to merge the appropriate clusters. Finally, in an effort to boost the performance of the generated detectors, we have trained the models using as training examples both the regions selected by our framework and the manually selected regions included in the validation set. We can see that the performance of the models generated by the combination of the datasets is greatly increased.
Figure 3. Comparative performance of the object detection models
By this figure, it is obvious that the models perform similarly both on validation and test set in all three cases. We chose these concepts because we are able to draw safer conclusions for the generalization ability of our framework, as it is impossible to generalize in cases where the visual diversity of the concepts did not allow the algorithm to produce a model that would perform well even in the validation set. For example, for the concepts building, car and sign the highest Fscore achieved on the validation set for all the combinations of the generated clusters was lower than 5%. Moreover, this allows us to assume that our approach fails on these cases because of the different nature of the training and testing set (e.g. flickr images might depict modern buildings and SAIAPR TC-12 monuments). We expect that increasing the size of the training set would allow visually diverse categories of the same concept to exist in the same training set.
5. Conclusion and future work In this work we have presented an algorithm for extracting semantically coherent groups of regions depicting a certain object. More specifically, starting from a set of flickr images that focus on the desired object, we propose an algorithm that is able to select the regions depicting this object using a validation set. The experimental results have demonstrated that although the quality of the selected regions selected by our approach is inferior to the optimal quality of the manually selected regions, there are cases where the gain in effort compensates for the loss in performance. Our future plans include the extensive evaluation of
22
15
20 18
70
Testing on Validation Set
Testing on Validation Set
Testing on Testing Set
Testing on Testing Set
Testing on Validation Set 60
16
Testing on Testing Set
50 10
12 10
F score
F score
F score
14 40
30
8 5 20
6 4
10 2 0
0
1
2
3
4
5
6
7
8
9 10 11 12 13 14 15 16 17 18 19 20 21 22 23 24 25 26 27
0
0 1 2 3 4 5 6 7 8 9 10 11 12 13 14 15 16 17 18 19 20 21 22 23 24 25 26 27 28 29 30 31 32 33 34 35 36
iteration #
(a) Grass
iteration #
(b) Road
0
0 1 2 3 4 5 6 7 8 9 10 11 12 13 14 15 16 17 18 19 20 21 22 23 24 25 26 27 28 29 30 31 32 33 34
iteration #
(c) Sky
Figure 4. Performance of every model generated in each iteration on the validation and test set for (a) Grass (b) Road and (c) Sky.
our approach in a large set of concepts and the use of larger sets of flickr images.
Acknowledgment This work was supported by the WeKnowIt and Glocal projects, partially funded by the EC, under contract numbers FP7-215453 and FP7-248984 respectively. Mr. Christos Zigkolis’ work was funded by the Irakleitos II national project.
References [1] G. Carneiro, A. B. Chan, P. J. Moreno, and N. Vasconcelos. Supervised learning of semantic classes for image annotation and retrieval. IEEE Trans. PAMI, 29(3):394–410, 2007. [2] E. Chatzilari, S. Nikolopoulos, I. Kompatsiaris, E. Giannakidou, and A. Vakali. Leveraging social media for training object detectors. In Digital Signal Processing, 2009. [3] E. Chatzilari, S. Nikolopoulos, I. Patras, and I. Kompatsiaris. Enhancing computer vision using the collective intelligence of social media. In A. Vakali and L. Jain, editors, New Directions in Web Data Management 1, volume 331 of Studies in Computational Intelligence, pages 235–271. Springer, 2011. [4] P. Duygulu, K. Barnard, J. F. G. de Freitas, and D. A. Forsyth. Object recognition as machine translation: Learning a lexicon for a fixed image vocabulary. In ECCV, 2002. [5] H. J. Escalante, C. A. Hernandez, J. A. Gonzalez, A. LspezLspez, M. Montes, E. F. Morales, L. E. Sucar, L. Villase?or, and M. Grubinger. The segmented and annotated iapr tc-12 benchmark. CVIU, 2010. [6] D. Joshi and J. Luo. Inferring generic activities and events from image content and bags of geo-tags. In CIVR, 2008. [7] B. Leibe, A. Leonardis, and B. Schiele. An implicit shape model for combined object categorization and segmentation. In Toward Category-Level Object Recognition, 2006. [8] C. Leistner, H. Grabner, and H. Bischof. Semi-supervised boosting using visual similarity learning. In CVPR, 2008.
[9] F.-F. Li, P. Perona, and C. I. of Technology. A bayesian hierarchical model for learning natural scene categories. In CVPR (2), pages 524–531, 2005. [10] Y. Li and L. G. Shapiro. Consistent line clusters for building recognition in cbir. In ICPR (3), pages 952–956, 2002. [11] D. G. Lowe. Distinctive image features from scale-invariant keypoints. Int. J. Comput. Vision, 60(2):91–110, 2004. [12] P. K. Mallapragada, R. Jin, A. K. Jain, and Y. Liu. Semiboost: Boosting for semi-supervised learning. IEEE Trans. PAMI, 31(11):2000–2014, September 2008. [13] V. Mezaris, I. Kompatsiaris, and M. G. Strintzis. Still image segmentation tools for object-based multimedia applications. IJPRAI, 18(4):701–725, 2004. [14] S. Papadopoulos, Y. Kompatsiaris, and A. Vakali. A graphbased clustering scheme for identifying related tags in folksonomies. In DaWaK ’10. [15] T. Quack, B. Leibe, and L. J. V. Gool. World-scale mining of objects and events from community photo collections. In CIVR, pages 47–56, 2008. [16] Y. Shen and J. Fan. Leveraging loosely-tagged images and inter-object correlations for tag recommendation. In ACM, MM ’10, 2010. [17] J. Shotton, J. M. Winn, C. Rother, and A. Criminisi. TextonBoost: Joint appearance, shape and context modeling for multi-class object recognition and segmentation. In ECCV (1), pages 1–15, 2006. [18] J. Sivic, B. C. Russell, A. A. Efros, A. Zisserman, and W. T. Freeman. Discovering objects and their localization in images. In ICCV, pages 370–377, 2005. [19] J. Sivic and A. Zisserman. Video google: A text retrieval approach to object matching in videos. In ICCV ’03. [20] K. van de Sande, T. Gevers, and C. Snoek. Evaluating color descriptors for object and scene recognition. IEEE Trans. PAMI, 99(1), 2008. [21] M. Vasconcelos, N. Vasconcelos, and G. Carneiro. Weakly supervised top-down image segmentation. In CVPR, 2006. [22] P. A. Viola and M. J. Jones. Rapid object detection using a boosted cascade of simple features. In CVPR, 2001. [23] Z. Wang, D. D. Feng, Z. Chi, and T. Xia. Annotating image regions using spatial context. ISM, 0:55–61, 2006.