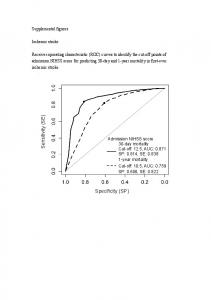
trial of radar-based microwave breast imaging for. Asian women: Phase I ... Engineering, no. 99, Feb. 2018. [8] D. O'Loughlin, M. Glavin, E. Jones, et al., âEvalua-.
1
Sensitivity and Specificity Estimation using Patient-Specific Microwave Imaging in Diverse Experimental Breast Phantoms Declan O’Loughlin, Bárbara L. Oliveira, Adam Santorelli, Emily Porter, Martin Glavin, Edward Jones, Milica Popović and Martin O’Halloran.
1) imaging living tissue with real blood flow and temperature changes [11]; 2) patient positioning and movement [4], [12]; 3) intrapatient variation due to the menstrual cycle, hormonal changes and or weight differences [4]; 4) interpatient variation in breast composition [13]. Challenges 1–3 have been previously analysed using results from patient imaging studies with a variety of systems: 1) fast acquisition times (under a minute), reducing the effect of variations [1], [12]; 2) automated verification of position [1], [14]; 3) signal and image variability using a wearable system with healthy control subjects over a period of up to eight months [4]. However, the importance of accounting for breast variability in the imaging algorithms (Challenge 4) remains unknown and how this challenge can impact the expected sensitivity and specificity of microwave radar-based imaging is examined in this paper. Fundamentally, microwave radar-based imaging algorithms (beamformers) require an estimate of the propagation speed within the breast to synthetically focus the signals to individual points [15]. The propagation speed can be determined from the dielectric properties of Index Terms— breast tissues, where, broadly speaking, the breast consists of adipose tissues with lower dielectric properties and I. Introduction In recent years, a number of clinical investigations of glandular tissues with higher dielectric properties. The microwave radar-based imaging have been published [1]–[4]. proportions of glandular and adipose tissues can vary Clinical evidence includes trials with over 200 patients using substantially between patients, between 0% and 50% by MARIA® [1] which is being commercialised by Micrima Ltd. volume [16]. Beamformers use an estimate of the dielectric properties (Bristol, the UK). A competing system is being developed to account for breast composition variatiance, and this commercially by Microwave Vision Group (Villebon-surestimate has been identified as a key parameter that can Yvette, France) with clinical trials commencing at the affect image quality [15], [17]–[23]. Most published patient National University of Ireland Galway Ireland [5]. The imaging studies do not adjust this parameter on a patientnext phase of clinical trials will draw on the experience of by-patient basis [1]–[4], known as a fixed-value estimation the earlier stage trials, and investigate the sensitivity and in this work. Patient imaging studies from the University of specificity of microwave breast imaging in detail [6], [7], Calgary identify the dielectric properties as an important including identifying the reconstruction algorithms which parameter [2], and methods have been developed which do achieve the highest sensitivity and specificity [8]. adjust this dielectric properties estimate on a patient-byAlthough many books, reviews and open-source implepatient basis [15], [21], [24]. mentations of microwave imaging algorithms have been The goals of this work are two-fold: published [7], [9], [10], many practical challenges exist in translating microwave imaging algorithms to the clinic, 1) to determine if fixed-value estimation is suitable for broadly categorised as follows: next phase clinical trials given the range of breast Abstract—Many new clinical investigations of microwave breast imaging have been published in recent years. Trials with over one hundred participants have indicated the potential of microwave imaging to detect breast cancer, with particularly encouraging sensitivity results reported from women with dense breasts. The next phase of clinical trials will involve larger and more diverse populations, including women with no breast abnormalities or benign breast diseases. These trials will need to address clinical efficacy in terms of sensitivity and specificity. A number of challenges exist when using microwave imaging with broad populations: 1) addressing the substantial variance in breast composition observed in the population; and 2) achieving high specificity given differences between individuals. This work analyses these challenges using a diverse phantom set which models the variance in breast composition and tumour shape and size seen in the population. The data show that the sensitivity of microwave breast imaging in breasts of differing density can suffer if patient-specific beamforming is not used. Moreover, the results suggest that achieving high specificity in dense breasts may be difficult, but that patient-specific beamforming does not adversely affect the expected specificity. In summary, this work finds that patientspecific beamforming has a tangible impact on expected sensitivity in experimental cases and that achieving high specificity in dense breasts may be challenging.
2
densities seen in the population; tissues vary more significantly than previously thought: 2) and to analyse the effect of patient-specific estimation the relative permittivity of healthy tissues varied from compared to fixed-value estimation on the sensitivity. between 4 ≤ εr ≤ 51 at 3 GHz and tumour tissues varied Firstly, factors influencing the potential specificity are from between 50 ≤ εr ≤ 58 at the same frequency. A study using a microwave tomography system developed analysed, including, the challenges of identifying features that can distinguish between true positives (tumours) at Dartmouth College, USA, also estimated the dielectic and false positives (unnecessary interventions). Next, ad- properties of healthy breast tissues in vivo [13]. The results vantages of patient-specific estimation are evaluated by showed that both the dielectric properties and the variance comparing the sensitivities achieved in a diverse set of of the dielectric properties within the breast increased with breast phantoms of different tissue composition. Both breast density classification. Further studies on patients the mean sensitivity (all tumour phantoms in all breast with breast abnormalities, including cancer, suggested that phantoms), and the sensitivity at a given breast phantom the dielectric properties of cancerous tissues may be higher density are considered. Finally, the effect of errors in the than healthy tissues by between 150% and 200% [31]. Although uncertainty exists as to the exact in vivo parameter estimation process is considered, highlighting dielectric properties and the expected contrast between difficulties encountered in designing methods for patientthe dielectric properties of healthy and malignant tissues, specific dielectric properties estimation. all studies agreed that the dielectric properties of healthy The rest of this paper is structured as follows: Sectissues can vary substantially [13], [28]. However, despite tion II describes the background to microwave imaging this variance in dielectric properties, most radar-based and adaptive beamforming methods; Section III presents beamforming algorithms do not account for the patientthe experimental system and breast phantoms used to specific breast when reconstructing an image. The theory of evaluate performance. Section IV analyses the potential radar-based imaging and the factors that influence dielecbenefits of adaptive beamforming and Section V concludes tric properties estimation are described in Section II-A, and the paper. the methods proposed for dielectric properties estimation are discussed in Section II-B. II. Background From a dielectric perspective, the female human breast A. Radar-based imaging interior is composed of three main tissue types [1]: A generic microwave radar-based imaging system can • adipose tissues with low dielectric properties; be thought of as transmitting locations, a, arranged on • glandular tissues with higher dielectric properties; the surface A, and receiving locations, a0 , arranged on • potentially tumours with the highest dielectric propthe surface A0 . For each point in the imaging domain, r, erties; 0 The breast interior is covered in a layer of skin which the response for a given channel, Sa,a , is synthetically focused to that point by delaying by the propagation is on average 2 mm thick and has dielectric properties 0 time, τ (r, ω). The synthetically focused signals are then a,a higher than adipose tissues [25], [26]. Adipose tissues are added and the energy of the combined signal is calculated. typically found directly beneath the skin, and the contrast For points where a large contrast in dielectric properties between higher dielectric properties of the skin and the exists, the synthethically focused signals will cohere and lower properties of adipose tissues causes a large reflection. the summation will have larger energy compared to the Uncertainty exists as to the exact in vivo dielectric energy at points with little or no contrast. This can be properties of the glandular and tumour tissues. Two types represented, for the frequency range Ω, as follows: of studies have investigated the dielectric properties: Z Z Z • open-ended coaxial probe studies with ex vivo tissue I(r) = Sa,a0 (ω) exp jωτa,a0 (r, ω) da da0 dω (1) samples [27]–[30]; Ω A A0 • and microwave patient imaging studies [13], [31]. The propagation delay for a given channel, τa,a0 (r, ω), Historically, ex vivo studies found a large contrast can be calculated from the dielectric properties of the between the dielectric properties of healthy and cancerous imaging domain as follows: breast tissues, up to 1:10 [27]. Addressing these variabilities, Z 1 the largest and most comprehensive study of the dielectric τa,a0 (r, ω) = dr0 (2) 0 properties of human breast tissues was conducted with C(ω) c(r , ω) 289 women in 2007 [28], [29]. These studies found that The propagation speed, c(r0 , ω) can be calculated from the the dielectric properties of healthy glandular tissues were relative permittivity, ε , relative permeability, µ , and the r r much higher than originally shown in historical studies: a speed of light in a vacuum, c , as follows: 0 contrast of 1:1.1 was observed, compared to a minimum c0 c(r0 , ω) = p (3) of 1:2.3 reported previously. The differences between [28], 0 εr (r , ω)µr (r0 , ω) [29] and the historical studies were attributed to the higher percentages of adipose tissues in tissue samples categorised where r0 ∈ C(ω) is the propagation path. as healthy in many historical studies. These studies, [28], Many challenges exist when estimating the propagation [29], also found that the properties of healthy breast delay using Equation (2):
3
1) the exact frequency-dependent dielectric properties of • and the location of the tumour could mean that the imaging domain are not known; different paths are dominant in the summation which 2) the exact propagation paths through the imaging could affect the reconstruction permittivity. domain are not known; A number of methods have been proposed to estimate the 3) the breast is heterogeneous and comprises many reconstruction permittivity, and the leading methods are different tissues; reviewed in the following section. 4) and the breast tissue composition varies from individual to individual. B. Patient-specific Reconstuction Permittivity Estimation A corresponding set of assumptions can be used to Several methods have been proposed to estimate the address these challenges and design a practial beamformer reconstruction permittivity [15], [17], [18], [24], [33], which from Equations (1) and (2) [15], [32]: can be broadly classified in three categories: 1) the dielectric properties are frequency-invariant within 1) time-of-flight methods [17], [24]; the frequency band of interest; 2) complementary microwave imaging techniques [18]; 2) the propagation path is a straight line between the 3) and parameter search algorithms [15], [19], [33]. antennas and the points of interest within the breast Fundamendally, time-of-flight methods assume the reand no multipath propagation occurs; construction permittivity can be estimated from a finite 3) the breast interior is a homogeneous layer with number of propagation paths through the imaging volume. spatially-invariant dielectric properties; Time-of-flight methods are subject to uncertainties in the 4) and that a population mean of the breast dielectric propagation path or by multipath propagation. However, properties exists which can be used when imaging all they can be used to estimate the spatial distribution of diindividuals regardless of breast composition. electric properties [24]. Time-of-flight methods, themselves, Together, these assumptions are known as fixed-value can be divided into two categories: estimation in this work and have been used in all patient 1) those using a common hardware system for properties imaging studies to date. estimation and imaging such as [17]; Using Assumptions 1 and 2, the imaging operator 2) or those that use additional hardware such as the described in Equation (1) can be discretised and simplified complementary system used in [24]. as follows, where the imaging operator is parameterised by the “reconstruction permittivity”, ε0r : Complementary hardware is particularly useful for monosXXX tatic systems such as [2] where multistatic channels would Iε0r (r) = Sa,a0 [ω] exp jωτa,a0 (r) (4) otherwise not be available. Ω A A0 Complementary imaging methods use additional miand the propagation delay from Equation (2) can be crowave imaging reconstruction techniques such as mievaluated using Assumption 2 as: crowave tomography for patient-specific dielectric propp h erties estimation [18]. Microwave tomography has been i 0 εr τa,a0 (r) = kr − ak + kr − a0 k (5) successfully used with up to 150 patients [13], [31], [34] c0 but can be computationally intensive, particularly in Suitable estimates of the reconstruction permittivity, ε0r , three-dimensions [35]. Assuming that the breast consists maximise energy at the tumour location while minimising of one homogeneous layer, as in [18], can reduce the computational complexity while estimating the frequencyenergy outside the tumour area. This work evaluates Assumption 4 in detail. The re- dependent dielectric properties of the breast interior. Thirdly, parameter search algorithms use characteristics construction permittivity, is primarily based on the mean dielectric properties of the imaging domain, in particular, a of the reconstructed images to optimise the reconstruction weighted mean of the dielectric properties of the dominant permittivity [15], [33]. Parameter search algorithms assume propagation paths in the imaging operator summation. that the characteristics of images reconstructed with incorNo methods exist to determine the optimal reconstruction rectly estimated reconstruction permittivity are different permittivity even given exact knowledge of the dielectric from those reconstructed with correctly estimated values. properties of the imaging domain, as many other factors These algorithms rely on a cost function that rewards images reconstructed with good estimates and penalises can also influence the reconstruction permittivity: • the layer of skin may lead to underestimating the prop- those reconstructed with poor estimates. This paper considers three idealised reconstruction agation path and overestimating the reconstruction permittivity estimation methods, listed here in order of permittivity; parameter flexibility, based on the existing methods: • artefact removal algorithms may change the phase of the tumour response compared to the idealised tumour 1) fixed-value estimation: where a single reconstruction response from that location; permittivity estimate is used for all test cases, repre• as reflections come from the margins of the tumour, senting the population mean; so the tumour size could affect the reconstruction 2) glandular-dependent estimation: where the reconstrucpermittivity; tion permittivity can vary based on the glandular
4
III. Methods In this section, the breast and tumour phantoms are described, including how they model the variation in breast composition and tumour shapes seen in clinical practice. Additionally, the experimental hardware is described. A. Test Platform
70 Head–Toe (mm)
Head–Toe (mm)
70 35 0 −35 −70 −70 −35
0
35
70
Left–Right (mm)
35 0 −35 −70 −70 −35
0
35
70
Left–Right (mm)
(a)
(b)
100 Head–Toe (mm)
content of the breast phantom, but not due to the tumour size or shape: one estimate is used to reconstruct images of all tumour phantoms in a given breast phantom; 3) and patient-specific estimation: where the reconstruction permittivity can vary based on both glandular content of the breast phantom and also for different tumour phantoms. Glandular-dependent estimation extends fixed-value estimation by allowing the reconstruction permittivity to vary due to the breast phantom density; and patient-specific estimation allows a unique reconstruction permittivity estimate for each breast and tumour phantom combination.
50
0
0
50
100
150
200
Left–Right (mm)
(c)
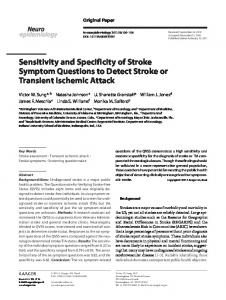
Recent advances in three-dimensional breast imaging Fig. 1. The skin and glandular structures of the breast phantoms with using x-ray tomosynthesis have allowed the breast tissue 10% and 30% glandular fraction are shown in (a) and (b) respectively. composition to be quantitatively assessed in terms of the All tumour phantoms used in this study are shown in (c), labelled proportions of glandular and adipose tissues by volume. P1 –P22 from left to right, top to bottom. A recent study analysing the breasts of 240 women aged between 35 and 82 [16] found the mean volume glandular and size can impact the optimal reconstruction permittivity fraction varied from around 7%–8% for non-dense breasts estimate used. Each tumour phantom, shown in Figure 1c up to between 15%–25% for dense breasts. In line with had permittivity of between 60 ≤ εr ≤ 74. Modelled this study, the breast phantoms in this study have volume tissue dielectric properties were chosen in accordance with glandular fractions of between 0% and 30% covering the [28], [29], with the target tumour dielectric properties majority of cases presented in [16]. representing the maximum values reported. The breast and tumour phantom test platform and Overall, 110 cases with tumour phantoms (22 tumour manufacturing process is described in detail in [36]. The phantoms in 5 breast phantoms) were used for sensitivity skin was modelled as a 2 mm hemispherical layer. The estimation. The 5 breast phantoms without tumour phanskin was filled with conical internal glandular structures, toms were used to analyse factors influencing the specificity. and two breast phantoms with different glandular fraction are shown in Figures 1a and 1b. The glandular structures ranged in relative permittivity between 40 ≤ εr ≤ 50 and B. System Design the 2 mm skin layer was modelled with relative permittivity Backscattered data were collected from 24 antennas of εr = 30, all at 3 GHz. Each phantom was filled with a equally spaced around a 70 mm radius hemisphere as used fat layer of relative permittivity εr = 6 and each phantom in [15]. The flexible microstrip antennas are designed to can be combined with all tumour models. The median contact skin directly and have been previously used in a 16conductivity of adipose, glandular and tumour tissues is element antenna array with patients [4]. Data for the 276 0.1 S m−1 , 1.7 S m−1 and 7.1 S m−1 respectively at 3 GHz. channels were acquired from 2 GHz to 4 GHz at 51 linearly As discussed in [36], the median tumour conductivity is spaced frequency points using a ZNB40 2-port VNA and higher than the 2.6 S m−1 and 3.3 S m−1 reported in [28]– ZN-Z84 24-port switching matrix (Rohde and Schwartz [30], but due to the size of the tumour phantoms, this is GmbH, Munich, Germany). not expected to impact the signals. Fused deposition modelling (FDM) was used to fabricate As shown in Figure 1c, tumours ranged in size from a hemispherical radome to house the antennas. The radome, spheres of approximately 5 mm in diameter to complex, printed using polylactic acid (PLA) with an Ultimater 2+ spiculated shapes about 20 mm in extent. The smooth, Extended (Ultimaker, Geldermasen, the Netherlands), was spherical tumours (P1 –P8 ; row one in Figure 1c) model designed with 24 holes to house the antennas. benign tumours and the spiculated and complex shapes Rotational subtraction was used for artefact removal [38] (P15 –P22 ; row three in Figure 1c) model malignant tumours, and the images were reconstructed using the beamformer according to the principles explained in [37]. The variety described in Equation (4). The antenna array is rotationally of tumour phantoms used helps determine if tumour shape symmetrical, meaning the rotated scan is collected without
5
any mechanical movement, reducing the overall patient scanning time to about 30 seconds [15]. All data acquisition, artefact removal and imaging were completed in the frequency domain [10].
the secondary response was within 5 mm of the boundary of the imaging domain (29% of cases): this can occur as a result of artefact removal algorithms [33]. These exceptions were developed empirically from qualitative analysis of the images, and are similar to observations from patient imaging studies. For example, it is noted IV. Results in [21] that artefacts often occur close to the boundaries In this section, factors influencing the sensitivity and of the imaging domain due to poor performance of the specificity are estimated. Firstly, the criteria for tumour artefact removal algorithms. detection are described in Section IV-A. These criteria are Of the negative images, 94% were deemed negative as used in Sections IV-B and IV-C to examine factors impact- the response was within 10 mm of the boundary of the ing the specificity and sensitivity respectively. Finally, the imaging domain or touching the boundary; the remaining potential challenges to achieving optimal sensitivity using 6% did not meet the signal-to-clutter ratio criterion nor the fixed-value estimation are considered in Section IV-D. exceptions listed above. Of the 70% annotated as positive, 92% were considered true positives as the responses were in the correct location. The remaining 8% were not within the A. Tumour Detection Criteria tumour area so were not marked as detected for sensitivity Microwave radar-based imaging is a qualitative approach, determination. Of this 8%, five cases (83%) were in the most meaning that the amplitude of the reconstructed images dense breasts and three of those cases, a tumour would have is not directly related to the dielectric properties of the been reported in the wrong breast quadrant. All images scatterers detected. The amplitude of the images will of all breast and tumour phantoms at all reconstruction be highest for areas of large contrast in regions of low permittivity values within the range were analysed similarly attenuation (less dense breasts) and lowest for areas of and used to generate the sensitivity estimations analysed minimal contrast in regions of high attenuation (more dense in the following sections (Sections IV-C and IV-D). breasts). Furthermore, size and shape of scatterers is not For all reconstruction permittivity estimation directly preserved in microwave radar-based images. In methods—fixed-value, glandular-dependent, and patientpatient imaging studies, images are often thresholded to specific—the detection annotations were used to determine 1.5 dB of the maximum image amplitude and the maximum the optimal reconstruction permittivity estimates. image amplitude is not used in the clinical decision [1], [3]. Although unavailable in practice, these idealised methods In other studies, the image is not thresholded and the allow the potential advantages and disadvantages of image amplitude was considered, although the study notes the various types of approaches to be determined. For that reconciling the image to the clinical history of the example, glandular-dependent estimation is similar to patient is difficult [2]. time-of-flight methods and patient-specific estimation In this work, detection was carried out in two stages: is similar to parameter search methods, and comparing 1) an image was annotated as a positive if a response these two idealised methods helps determine if the with signal-to-clutter ratio of greater than 1.5 dB was increased flexibility of patient-specific estimation impairs the expected specificity when compared to glandularobserved in the breast; 2) images annotated as positive were considered true dependent estimation. For fixed-value estimation, the reconstruction permittivpositives if the response was within the physical extent of the actual tumour: i.e. the localisation error was ity estimate is chosen to maximise the overall sensitivity. For glandular-dependent estimation, reconstruction perless than the tumour radius. mittivities are chosen for each of the five breast phantoms The maximum amplitude and signal-to-clutter ratio for to maximise the sensitivity for all tumour phantoms in positive and negative cases in breast phantoms of varying combination with that breast phantom. Patient-specific density are shown in Figure 2. The signal-to-clutter ratio estimation considers if any reconstruction permittivity bewas calculated as the ratio between the maximum image tween the lowest and highest glandular-dependent estimates amplitude divided by the maximum amplitude outside the would have detected the tumour. tumour area. The tumour area is defined as the ellipsoid centered at the maximum amplitude with radii equal to the full-width half-maximum (FWHM) of the tumour response. B. Effect on specificity 70% of images were annotated as containing a tumour Images reconstructed of the five breast phantoms without response, and 30% were annotated as negatives. In some any tumour phantoms are analysed in detail below. Alimages marked as positive, exceptions to the detection though the sample size is small (five breast phantoms), this criteria above were made, if: novel analysis helps identify if reconstruction permittivity •
the secondary response was within 10 mm of the main response (12% of cases): this can occur with large and spiculated tumours in particular. Visually, this appears similar to a single response;
•
methods would impair the specificity in realistic scenarios. For the least dense phantom (0%), no image was annotated as a tumour. There is little internal variation in dielectric properties in this breast phantom and hence
6
−20
6 3 0 −3 −6
1
2
3
−6−3 0 3 6 L–R
Signal-to-Clutter Ratio (dB)
(b)
15% at ε0r = 8.50
15% at ε0r = 10.25 6 3 0 −3 −6
H–T
6 3 0 −3 −6
F–B
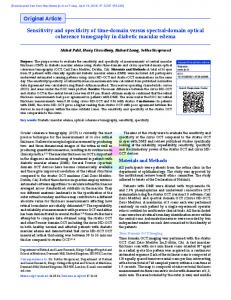
Fig. 2. The difficulty in discriminating between true positive and false positive cases is shown, potentially negatively impacting the expected specificity. It is more difficult to separate true positives and true negatives based on signal-to-clutter ratio or image amplitude as the breast phantom density increases. Images of 22 tumor phantoms in four breast phantoms of increasing density are shown: true positives in green, false negatives in red and images without tumours are shown in black.
−6−3 0 3 6 L–R
(a)
4
0 3 6 B–F
0 3 6
H–T
Found: 0% 10% 20% 30% Not Found: 0% 10% 20% 30% No Tumour: 0% 10% 20% 30%
−60
0 3 6 B–F
0 3 6
0 3 6 B–F
0 3 6 −6−3 0 3 6
F–B
−50
F–B
H–T
−40
10% at ε0r = 10.25 H–T
6 3 0 −3 −6
−30
F–B
Maximum Amplitude (dB)
10% at ε0r = 8.50
0 3 6 B–F
0 3 6 −6−3 0 3 6
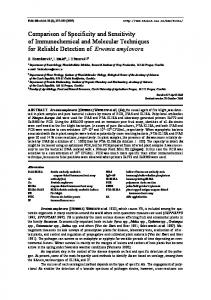
few reflections from the breast phantom interior. Also, the L–R L–R signal attenuation within the breast phantom is much lower (c) (d) (due to the lower dielectric properties): so discriminating Fig. 3. The potential impact of reconstruction permittivity estimation between tumour and no tumour images based on image on specificity is shown in these images without tumour phantoms. amplitude or signal-to-clutter ratio is possible as shown in Images (b)–(d) are annotated as tumours whereas (a) is not as Figure 2. the response is too close to the skin. Comparing (a) to (b)—breast phantom (10%) reconstructed using glandular-dependent and fixedThe next most dense breast phantom (10%) includes value estimation respectively— shows that reconstruction permittivity a case where glandular-dependent estimation may have a estimation can sometimes positively impact the specificity. Images (d)—breast phantom (15%) reconstructed using ε0r = 8.5 positive impact on the specificity. The two images of this (c) and and ε0r = 10.25— shows that as the breast density increases, the phantom are shown in Figures 3a and 3b, reconstructed at acceptable range of reconstruction permittivity estimates can include the glandular-dependent estimate (ε0r = 8.5) and the fixed- multiple images annotated as tumours. It is important that patientvalue estimate (ε0r = 10.25) respectively. The glandular- specific estimation methods learn to distinguish these types of images. Dimensions are in centimetres for the head–toe (H–T), front–back dependent estimate in Figure 3a is used to reconstuct an (F–B), left–right (L–R) axes. image that is not annotated as a tumour (a true negative), whereas the fixed-value estimate in Figure 3b results in a false positive. phantoms (15%) reconstructed at ε0r = 8.5 is shown in Examining images from the more dense breast phan- Figure 3c which is a false positive, however the tumour toms (> 15%) highlights the challenges in achieving high would have been detected in a central position in the specificity from radar-based images. Using fixed-value breast, different to the image of the same breast phantom estimation, all three of the most dense phantoms are reconstructed at the fixed-value estimate in Figure 3d. It is annotated as containing tumours (false positives). An image important that patient-specific beamformers can identify of the least dense of the three (15%) is shown in Figure 3d situations where two images identify potential scatterers. In the more dense breast phantoms, signal attenuation is at the fixed-value estimate (ε0r = 10.25), and demonstrates higher due to the higher conductivity of glandular tissues how images of dense breast phantoms can contain responses compared to adipose tissues. Comparing the maximum which can be annotated as tumours. Although the sample image amplitudes of images from dense phantoms to images size is too small to allow for statistical analysis, only two of less dense phantoms in Figure 2, two trends can be seen: of the five images using fixed-value estimation without 1) the maximum amplitude of the images decreases with tumours are correctly detected as true negatives. density; In the three most dense breast phantoms (> 15%), 2) and where it is possible to separate tumour and no glandular-dependent and patient-specific estimation neither tumour images based on amplitude in less dense breast impair nor improve the specificity compared to fixed-value phantoms, this is not possible in more dense breast estimation. In all three cases, glandular-dependent and phantoms. patient-specific estimation would result in false positives. For example, an image of the least dense of the three In some cases in the most dense breast phantom (30%), the
7
FV
GD
PS
0% 10% 15% 20% 30%
91% 59% 86% 68% 18%
95% 73% 86% 77% 27%
95% 86% 91% 82% 45%
10¼ 10¼ 10¼ 10¼ 10¼
8¾ 8½ 10¼ 11¾ 12½
8¾ 8¼–11 10¼–11¼ 11¾–13 8–12½
All
65%
72%
80%
10¼
8½–12½
8–13
SCR is higher for the image of the dense breast phantom without a tumour phantom present. In summary, these results indicate that achieving high specificity using microwave radar-based imaging may be challenging particularly in very dense breasts. A preliminary patient imaging study similarly found that images of a patient with metaplastic carcinoma and images of a patient with no known breast disease shown responses with a similar SCR [39]. However, in these five cases, reconstruction permittivity estimation does not significantly impact the expected specificity, positively or negatively, when compared to fixed-value estimation. In one breast phantom, reconstruction permittivity may improve the expected specificity as is shown in Figure 3, and the maximum image amplitude is also useful to discriminate between true and false positives in less dense breast phantoms. C. Optimal Sensitivity The sensitivities using the three estimation methods is shown in Table I, along with the reconstruction permittivity estimates for each. A number of trends are visible, which are detailed in detail in this section. Firstly, the sensitivity decreases as the density increases for all three estimation methods, and is particularly poor in the most dense phantom (30%). This is consistent with previous work from other experimental systems such as [38]; however, conversely, patient imaging studies using the same system showed sensitivities of 54% in less dense breasts and 86% in dense breasts. Advances in threedimensional breast imaging have shown that even for dense breasts categorised according the BI-RADS, the mean volume glandular fraction for 47 women was below 30%; suggesting that this worst-case for microwave imaging is more rare than might be expected from the BI-RADS classification [16]. Secondly, the overall sensitivity using both glandulardependent and patient-specific estimation is higher than the the overall sensitivity of the current standard, fixedvalue estimation. Glandular-dependent and patient-specific estimation outperform fixed-value estimation in all five breast phantoms, and the sensitivity in the most dense breast phantom is as low as 18% using fixed-value estimation. Even in a less challenging imaging scenario
H–T
H–T
0 3 6 B–F
0 3 6
F–B
PS
6 3 0 −3 −6 0 3 6 B–F
0 3 6
−6−3 0 3 6 L–R
−6−3 0 3 6 L–R
(a)
(b)
P11 at ε0r = 12.25 6 3 0 −3 −6
P17 at ε0r = 12.25 6 3 0 −3 −6
H–T
GD
P17 at ε0r = 10.25
0 3 6 B–F
0 3 6 −6−3 0 3 6 L–R (c)
F–B
FV
F–B
ε0r
6 3 0 −3 −6
H–T
Sensitivity
P11 at ε0r = 10.25
F–B
TABLE I Sensitivities using fixed-value (FV), glandular-dependent (GD) and patient-specific (PS) reconstruction permittivity estimation. Both the over sensitivity and the sensitivities for each breast phantom are shown. Also shown is the reconstruction permittivity values for each method.
0 3 6 B–F
0 3 6 −6−3 0 3 6 L–R (d)
Fig. 4. These images demonstrate the potential advantages of patientspecific estimation in dense breast phantoms (30%); although images of two tumour phantoms can be reconstructed in the range εr ∈ {10.25, 12.25}, no one reconstruction permittivity estimate can be used to reconstruct images of both tumour phantoms. The images of P11 and P17 are shown in the left and right columns respectively, reconstructed at εr ∈ {10.25, 12.25} in rows one and two.
(10%) fixed-value estimation detects just 59% of tumour phantoms compared to 86% detected using patient-specific estimation. Thirdly, the glandular-dependent reconstruction permittivity estimates increase with breast phantom density. Additionally, the range of acceptable estimates narrows with increasing density, meaning that an accurate estimate is more important for denser breast1 . For example, the tumour phantom P11 is detected in the range 8 < ε0r < 10.25 for a less dense phantom (10%); whereas the same tumour phantom is only detected in the correct location at ε0r = 10.25 for the most dense phantom (30%). Finally, the benefits of patient-specific estimation can be seen in Figure 4 which shows images of tumour phantoms P11 and P17 in a dense breast phantom (30%) reconstructed at ε0r = 10.25 and ε0r = 12.25. Using one permittivity estimate, it is not possible in this case to reconstruct images where both tumour phantoms are detected, although, P11 is visible at the lower estimate and P17 is visible at the higher estimate. Underestimating the reconstruction permittivity means that reflections appear to come from further away 1 Further details of the suitable reconstruction permittivity ranges for each breast and tumour phantom combination are available in the supplementary material.
8
80
4 40
20
14
6 9 10 10 12 13
16 17 17 17 17 19 19 19
14
ε0r = 9.50
15 15 16 16 16 17 17 16 17 17
15 14
15 14 16 16 14 14 13 12 13 11 12 13 10 15 10
15
14
11
14
14
13
14
9 7
7 19 21 21 19 20 19 20 20 19 19 18 19 17 15 18 13 12 12 10 0
8
ε0% r
9.5
ε15% r
11
6 3 0 −3 −6
ε20% r
12.5
Reconstruction Permittivity (ε0r )
Fig. 5. These data help show that no one reconstruction permittivity can achieve optimal sensitivity in these breast phantoms. As the reconstruction permittivity increases, the number of tumours detected in the less dense breast phantoms decreases but the number of tumours detected in the more dense breast phantoms increases. The glandulardependent estimate for each breast phantom is shown: from ε0% for r the least dense phantoms, up to ε20% for the most dense phantom r (20%).
ε0r = 11.75 6 3 0 −3 −6
H–T
6
20% GF
0 3 6 B–F
0 3 6 −6−3 0 3 6 L–R (a)
F–B
5
15
15% GF
H–T
60
10% GF
F–B
Tumours found (88 total)
0% GF
0 3 6 B–F
0 3 6 −6−3 0 3 6 L–R (b)
Fig. 6. These images demonstrate a key challenge experienced when designing a patient-specific estimation method. The correct image is shown in (b) with the tumour phantom detected in the correct location, but it is important to be able to distinguish this image from the spurious response in (a). Images of P13 at ε0r = 9.5 and ε0r = 11.75 in a breast phantom with 20% glandular fraction.
but 59% when using ε0r = 11.25. Conversely, in the two more dense breast phantoms, the sensitivity increases from 65% to 75% across the same range. As the reconstruction permittivity estimate increases, improving sensitivity in than they actually originate, which may be compensating more dense breast phantoms offsets decreasing sensitivity in less dense breast phantoms and the subset of breast and for the larger tumour size of P11 compared to P17 . tumour phantom combinations detected changes. As expected, the optimal fixed-value reconstruction D. Practical implementations permittivity estimate is ε15% , which lies between the lowest r In this section, the sensitivity with respect to errors in and highest glandular-dependent estimates. Using this the reconstruction permittivity estimates is analysed. In estimate maximises the sensitivity in the breast phantom particular, the disadvantages of using fixed-value estimation with 15% glandular fraction, and the sensitivities in the in breast phantoms of varying density is evaluated. other breast phantoms is only 10% below the maximum. The sensitivity for 22 tumour phantoms in four different These results indicate that the optimal fixed-value estimate breast phantoms is shown in Figure 5 as the fixed-value would depend on the particular patient population and 0 reconstruction permittivity estimate varies between εr = that one ideal estimate does not exist. Furthermore, 0 8 and εr = 12.5. Even within this range of fixed-value reconstruction permittivity estimates, the sensitivity suffers using glandular-dependent estimation instead of fixed-value by assuming a fixed-value for all breast phantoms regardless estimation in these 88 cases could increase the true positive rate from 76% to 82%. of breast phantom density. Finally, a challenging case for patient-specific estimation For example, where 36 out of 44 tumour phantoms (82%) is shown in Figure 6, showing images of a tumour phantom can be detected in the least dense phantoms (0% and 10%) 0% (P ) in a dense breast phantom (20%) reconstructed at 13 using glandular-dependent estimation (εr ), only 33 out 0 ε ∈ {9.5, 11.75}. In Figure 6b, the tumour response is r of 44 (75%) can be detected using fixed-value estimation 15% clearly visible in the correct location, however, when the (εr ). Overestimating further and reconstructing images 20% estimate is underestimated as in Figure 6a, a spurious reat εr , only 24 out of 44 (55%) tumour phantoms can be sponse in the incorrect location is visible with SCR of 1.1 dB detected in these less dense breast phantoms, 30% less and similar amplitude to Figure 6b. Although patientthan the optimal sensitivity. Conversely, for the more specific estimation can increase sensitivity, particularly in dense phantoms (20%), only 6 out of 22 (27%) tumour dense breasts, it is important to ensure a patient-specific phantoms are detected when reconstructing images using ε0% compared to 17 out of 22 (77%) using the optimal estimation algorithm can distinguish between multiple r responses in different images. estimate, ε20% . r
The overall sensitivity varies from 69% to 76% as the reconstruction permittivity estimate increases from ε0r = 9 to ε0r = 11.25. However, the sensitivities in breast phantoms of a given density vary more as the reconstruction permittivity estimate increases. For example, when reconstructing using a fixed-value of ε0r = 9, the sensitivity in the two less dense breast phantoms is 80%,
V. Conclusions In light of the increasing amount of clinical evidence for microwave breast imaging available, future trials will include large populations including participants with varied breast abnormalities and breast tissue compositions. This affects the dielectric properties of the breast interior, and a
9
good estimate of the dielectric properties has been shown to be a key parameter of a microwave radar-based imaging algorithm. Most patient imaging studies to date have not adjusted the dielectric properties estimate for a given patient, and this work categorises and reviews the leading methods of dielectric properties estimation for radar-based imaging, including the strengths and weaknesses of each approach. For the first time, this paper considers the potential advantages of patient-specific dielectric properties estimation on the expected sensitivity of experimental microwave radar-based imaging. By comparing sensitivites using breast phantoms of varying density, the results suggest it is difficult to find one fixed-value estimate that is suitable for all breast phantoms. Although a range of fixed-value estimates results in estimated sensitivities above 70%, lower fixed-value estimates improve performance in less dense breasts phantoms at the expense of denser breasts phantoms and vice versa. Unexpectedly, trials with the MARIA® system found that the sensitivity in dense breasts was 86% compared to 54% in less dense breasts, although the overall number of patients was too small to permit extensive statistical analysis [1]. Finally, these data indicate that achieving high specificity using radar-based imaging may be challenging. Although the image amplitude can reliably separate true positive and true negative cases in less dense breast phantoms, images of dense phantoms without tumour phantoms can have similar magnitude and appearance to images of the same breast phantoms with tumour phantoms present. However, the number of cases is small, and future work is needed with large populations and patient images to investigate image features that may improve the specificity in dense breasts.
[4] E. Porter, M. Coates, and M. Popović, “An Early Clinical Study of Time-Domain Microwave Radar for Breast Health Monitoring,” IEEE Transactions on Biomedical Engineering, vol. 63, no. 3, pp. 530–539, Mar. 2016. [5] A. Fasoula, S. Anwar, Y. Toutain, et al., “Microwave vision: From RF safety to medical imaging,” in Proceedings of the 11th European Conference on Antennas and Propagation (EuCAP), Paris, France: IEEE, Mar. 19–24, 2017, pp. 2746–2750. [6] A. Modiri, S. Goudreau, A. Rahimi, et al., “Review of Breast Screening: Towards Clinical Realization of Microwave Imaging,” Medical Physics, vol. 44, no. 12, e446–e458, Nov. 2017. [7] D. O’Loughlin, M. O’Halloran, B. M. Moloney, et al., “Microwave Breast Imaging: Clinical Advances and Remaining Challenges,” Transactions on Biomedical Engineering, no. 99, Feb. 2018. [8] D. O’Loughlin, M. Glavin, E. Jones, et al., “Evaluation of Experimental Microwave Radar-Based Images: Evaluation Criteria,” in Proceedings of the Antennas and Propagation Society International Symposium (APSURSI), Boston, MA, USA: IEEE, Jul. 8–13, 2018. [9] N. K. Nikolova, Introduction to Microwave Imaging, ser. EuMA High Frequency Technologies Series. Cambridge, UK: Cambridge University Press, Jul. 2017. [10] D. O’Loughlin, M. A. Elahi, E. Porter, et al., “Opensource software for microwave radar-based image reconstruction,” in Proceedings of the 12th European Conference on Antennas and Propagation (EuCAP), London, the UK: IEEE, Apr. 9–13, 2018. [11] P. M. Meaney, “Microwave imaging: Perception and reality,” Expert Review of Medical Devices, vol. 10, Acknowledgement no. 5, pp. 581–583, Sep. 2013. This work was supported by the Irish Research [12] M. Klemm, I. J. Craddock, J. A. Leendertz, et Council (GOIPG/2014/987), Science Foundation Ireland al., “Clinical trials of a UWB imaging radar for (12/IP/1523) and the European Research Council (grant breast cancer,” in Proceedings of the 4th European agreement number 637780). Conference on Antennas and Propagation (EuCAP), Barcelona, Spain: IEEE, Apr. 12–16, 2010, pp. 1–4. References [13] P. M. Meaney, M. W. Fanning, T. Raynolds, et al., [1] A. W. Preece, I. J. Craddock, M. Shere, et al., “Initial Clinical Experience with Microwave Breast “MARIA M4: Clinical evaluation of a prototype ultraImaging in Women with Normal Mammography,” wideband radar scanner for breast cancer detection,” Academic Radiology, vol. 14, no. 2, pp. 207–218, Feb. Journal of Medical Imaging, vol. 3, no. 3, p. 033 502, 2007. pmid: 17236994. Jul. 2016. [14] T. Henriksson, M. Klemm, D. Gibbins, et al., “Clin[2] E. C. Fear, J. Bourqui, C. F. Curtis, et al., “Miical trials of a multistatic UWB radar for breast crowave Breast Imaging With a Monostatic Radarimaging,” in Proceedings of the Loughborough AntenBased System: A Study of Application to Patients,” nas and Propagation Conference, Loughborough, UK: IEEE Transactions on Microwave Theory and TechIEEE, Nov. 2011, pp. 1–4. niques, vol. 61, no. 5, pp. 2119–2128, May 2013. [15] D. O’Loughlin, B. L. Oliveira, M. A. Elahi, et al., [3] F. Yang, L. Sun, Z. Hu, et al., “A large-scale clinical “Parameter Search Algorithms for Microwave Radartrial of radar-based microwave breast imaging for Based Breast Imaging: Focal Quality Metrics as Asian women: Phase I,” in Proceedings of the InterFitness Functions,” Sensors, vol. 17, no. 12, Dec. national Symposium on Antennas and Propagation 2017, Art. 2823. (APSURSI), San Diego, CA, USA: IEEE, Jul. 9–14, [16] S.-Y. Huang, J. M. Boone, K. Yang, et al., “The 2017, pp. 781–783. characterization of breast anatomical metrics using
10
[17]
[18]
[19]
[20]
[21]
[22]
[23]
[24]
[25] [26]
[27]
[28]
dedicated breast CT,” Medical Physics, vol. 38, no. 4, pp. 2180–2191, Apr. 1, 2011. M. Sarafianou, I. J. Craddock, T. Henriksson, et al., “MUSIC processing for permittivity estimation in a Delay-and-Sum imaging system,” in Proceedings of the 7th European Conference on Antennas and Propagation (EuCAP), Gothenburg, Sweden: IEEE, Apr. 8–12, 2013, pp. 839–842. D. W. Winters, E. J. Bond, B. D. Van Veen, et al., “Estimation of the Frequency-Dependent Average Dielectric Properties of Breast Tissue Using a Time-Domain Inverse Scattering Technique,” IEEE Transactions on Antennas and Propagation, vol. 54, no. 11, pp. 3517–3528, Nov. 2006. D. O’Loughlin, F. Krewer, M. Glavin, et al., “Focal quality metrics for the objective evaluation of confocal microwave images,” International Journal of Microwave and Wireless Technologies, vol. 9, no. 07, pp. 1365–1372, Sep. 2017. ——, “Estimating average dielectric properties for microwave breast imaging using focal quality metrics,” in Proceedings of the 10th European Conference on Antennas and Propagation (EuCAP), Davos, Switzerland: IEEE, Apr. 10–15, 2016, pp. 1–5. B. R. Lavoie, M. Okoniewski, and E. C. Fear, “Estimating the Effective Permittivity for Reconstructing Accurate Microwave-Radar Images,” PloS one, vol. 11, no. 9, e0160849, Sep. 2016. D. O’Loughlin, M. Glavin, E. Jones, et al., “Optimisation of Confocal Microwave Breast Images using Image Focal Metrics,” in Proceedings of the 22nd Bioengineering in Ireland (BINI), Galway, Ireland: Royal Academy of Medicine in Ireland, Jan. 22–23, 2016, pp. 39–39. D. O’Loughlin, B. L. Oliveira, M. Glavin, et al., “Effects of Interpatient Variance on Microwave Breast Images: Experimental Evaluation,” in Proceedings of the 40th Annual International Conference of the 40th IEEE Engineering in Medicine and Biology Society (EMBC), Honolulu, HI, USA: IEEE, Jul. 17–21, 2018. J. Bourqui and E. C. Fear, “System for Bulk Dielectric Permittivity Estimation of Breast Tissues at Microwave Frequencies,” IEEE Transactions on Microwave Theory and Techniques, vol. 64, no. 9, pp. 3001–3009, Sep. 2016. S. Willson, E. Adam, and A. Tucker, “Patterns of breast skin thickness in normal mammograms,” Clinical Radiology, vol. 33, no. 6, pp. 691–693, 1982. H. Ulger, N. Erdogan, S. Kumanlioglu, et al., “Effect of age, breast size, menopausal and hormonal status on mammographic skin thickness,” Skin Research and Technology, vol. 9, no. 3, pp. 284–289, 2003. W. D. Hurt, J. M. Ziriax, and P. A. Mason, “Variability in EMF permittivity values: Implications for SAR calculations,” IEEE Transactions on Biomedical Engineering, vol. 47, no. 3, pp. 396–401, Mar. 2000. M. Lazebnik, L. McCartney, D. Popović, et al., “A large-scale study of the ultrawideband microwave
[29]
[30]
[31]
[32]
[33]
[34]
[35]
[36]
[37]
[38]
[39]
dielectric properties of normal breast tissue obtained from reduction surgeries,” Physics in Medicine and Biology, vol. 52, no. 10, pp. 2637–2656, May 2007. M. Lazebnik, D. Popović, L. McCartney, et al., “A large-scale study of the ultrawideband microwave dielectric properties of normal, benign and malignant breast tissues obtained from cancer surgeries,” Physics in Medicine and Biology, vol. 52, no. 20, pp. 6093–6115, Oct. 2007. T. Sugitani, S.-i. Kubota, S.-i. Kuroki, et al., “Complex permittivities of breast tumor tissues obtained from cancer surgeries,” Applied Physics Letters, vol. 104, no. 25, p. 253 702, Jun. 2014. S. P. Poplack, T. D. Tosteson, W. A. Wells, et al., “Electromagnetic Breast Imaging: Results of a Pilot Study in Women with Abnormal Mammograms,” Radiology, vol. 243, no. 2, pp. 350–359, May 2007. C. F. Curtis, B. R. Lavoie, and E. C. Fear, “An Analysis of the Assumptions Inherent to Near-Field Beamforming for Biomedical Applications,” IEEE Transactions on Computational Imaging, vol. 3, no. 4, pp. 953–965, Dec. 2017. B. R. Lavoie, M. Okoniewski, and E. C. Fear, “Optimizing Microwave-Radar Imaging Parameters,” in Proceedings of the 17th International Symposium on Antenna Technology and Applied Electromagnetics (ANTEM), Montreal, Canada: IEEE, Jul. 2016. P. M. Meaney, P. A. Kaufman, L. S. Muffly, et al., “Microwave imaging for neoadjuvant chemotherapy monitoring: Initial clinical experience,” Breast Cancer Research, vol. 15, no. 2, pp. 1–16, May 2013. A. Shahzad, M. O’Halloran, M. Glavin, et al., “A novel optimized parallelization strategy to accelerate microwave tomography for breast cancer screening,” in Proceedings of the 36th Annual International Conference of the IEEE Engineering in Medicine and Biology Society (EMBC), Chicago, IL, USA: IEEE, Aug. 26–30, 2014, pp. 2456–2459. B. L. Oliveira, D. O’Loughlin, M. O’Halloran, et al., “Microwave Breast Imaging: Experimental tumour phantoms for the evaluation of new breast cancer diagnosis systems,” Biomedical Physics & Engineering Express, vol. 4, no. 2, Feb. 2018, 025036. B. L. Oliveira, M. O’Halloran, R. C. Conceição, et al., “Development of Clinically-Informed 3D Tumor Models for Microwave Imaging Applications,” IEEE Antennas and Wireless Propagation Letters, vol. 15, pp. 1–1, 2015. M. Klemm, I. J. Craddock, A. W. Preece, et al., “Evaluation of a hemi-spherical wideband antenna array for breast cancer imaging,” Radio Science, vol. 43, no. 6, pp. 1–15, Dec. 2008. M. A. Elahi, D. O’Loughlin, B. R. Lavoie, et al., “Evaluation of Image reconstruction algorithms for confocal microwave imaging: Application to patient data,” Sensors, vol. 18, no. 6, May 2018, Art. ID. 1678.