Aug 8, 2006 - arXiv:cond-mat/0608193v1 [cond-mat.mes-hall] 8 Aug 2006. Sequential and ..... Ritchie, and G.A.C. Jones, Phys. Rev. B 55, R10197 (1997).
Sequential and co-tunneling behavior in the
arXiv:cond-mat/0608193v1 [cond-mat.mes-hall] 8 Aug 2006
temperature-dependent thermopower of few-electron quantum dots R. Scheibner, E.G. Novik, T. Borzenko, M. K¨onig, D. Reuter∗ , A.D. Wieck∗ , H. Buhmann, and L.W. Molenkamp Physikalisches Institut (EP3), Universit¨at W¨ urzburg, Am Hubland, 97074 W¨ urzburg, Germany and ∗
Lehrstuhl f¨ ur Angewandte Festk¨orperphysik, Ruhr-Universit¨at Bochum, Universit¨atsstraße 150, 44780 Bochum, Germany (Dated: February 6, 2008)
Abstract We have studied the temperature dependent thermopower of gate-defined, lateral quantum dots in the Coulomb blockade regime using an electron heating technique. The line shape of the thermopower oscillations depends strongly on the contributing tunneling processes. Between 1.5 K and 40 mK a crossover from a pure sawtooth- to an intermitted sawtooth-like line shape is observed. The latter is attributed to the increasing dominance of cotunneling processes in the Coulomb blockade regime at low temperatures.
Keywords: Thermoelectric and thermomagnetic effects, Coulomb blockade, single electron tunneling PACS Numbers: 73.50.Lw, 73.23.Hk, 73.63.Kv
1
The perspective of scalable semiconductor quantum processing devices feeds an intense interest in quantum dot (QD) structures that contain only a few electrons.1 For the development of these devices, a detailed knowledge of the underlying electron transport processes is of crucial importance. So far, most of the transport experiments have focused on the electrical conductance.2 Although thermoelectrical transport measurements are known to be more sensitive to the details of the electronic structure than conventional transport measurements,3 little experimental attention has been paid to this kind of measurements on QDs. Within the scope of the Onsager relations, the thermopower S, which is given by VT hEi S ≡ − lim , =− ∆T →0 ∆T I=0 eT
(1)
relates the average energy hEi transfer at a temperature T to the thermovoltage VT for a given temperature difference ∆T across the device at zero net current. This additional information about the carrier kinetics is not provided by conventional transport measurements and helps to distinguish between different possible transport regimes.4 In the past, thermopower measurements on QDs in the Coulomb blockade (CB) regime have yielded qualitatively different results: either a sawtooth-like line shape, or a line shape similar to the derivative of a Coulomb Blockade (CB) conductance peak is observed when the electrochemical potential is varied in order to change the number of electrons occupying the QD. So far, a sawtooth-like behavior has been observed mainly for many-electron QDs, while derivative-like line shapes are predominantly reported for smaller QDs at low (mK) temperatures.5,6,7 Here, we present thermovoltage measurements on gate defined, lateral QDs, containing a few tens of electrons, which allow us to analyze the low temperature line shape profile in detail. For a series of CB conductance resonances, the transition is observed from a full sawtooth line shape to a sawtooth that is periodically intermitted by a zero thermovoltage signal while the temperature is lowered from T = 1.5 K to T < 100 mK. This behavior is in qualitative agreement with recent theoretical considerations of Turek and Matveev8 for many-electron QDs. The transition is associated with an increasing dominance of cotunneling processes for decreasing temperatures. In our measurements we find that the regime of sequential tunneling, which dominates the transport in the vicinity of the CB resonances, extends much further than anticipated for many-electron dots. This leads to an enhanced
2
V2
B
C
I1
I2
A
2µm
D V1
F E
FIG. 1: Scanning electron microscope image of the sample structure. Schottky-gates are labeled A, B, ... F. Sample areas which serve as current and voltage contacts are labeled I1 , I2 and V1 , V2 , respectively.
absolute thermopower for few-electron devices. The measurements are carried out in a top-loading dilution refrigerator at lattice temperatures between 40 mK and 1.5 K. The GaAs/(Al,Ga)As QDs are fabricated by split-gate technology using optical and electron-beam lithography. The two dimensional electron gas (2DEG) is located 70 nm below the surface, has a carrier density ne = 2.3 × 10¹⁵ m−2 , and a mobility µ = 100 m2 /(Vs). The gate structure of the samples is shown in Fig. 1.9 Gates A, D, E and F form the QD with a nominal diameter of approximately 250 nm. The voltage applied to the plunger gate E, VE , is used to control the number of electrons on the QD. Lowfrequency lock-in techniques are used for the transport experiments. The effective charging energy EC∗ is determined From finite bias conductance measurements. In the regime where CB oscillations are observable, EC∗ decreases from 3.0 meV to 0.8 meV when the coupling to the reservoirs is increased. Gates B and C define, together with gates A and D, the electron heating channel, and, at the same time, the reference quantum point contact (QPCref ) in the thermopower experiments.10,11 By adjusting the conductance of QPCref to the center of a quantized plateau, its thermopower is approximately zero, SQPCref ≈ 0.
The transverse voltage
VT ≡ V1 − V2 (c.f. Fig. 1) is then directly proportional to the thermopower of the QD. A constant temperature difference across the dot is maintained by passing an ac current of ν = 13 Hz through the heating channel. VT is detected at twice the excitation frequency (26 Hz). Here, we discuss two QD samples (QD1 and QD2) that have the same gate structure design but adjusted to have a different number of electrons; QD1 (QD2) contains between 15 (30) and 20 (40) electrons. A current of IH = 9.7 nA (4.2 nA) increases the electron temperature in the heating channel by ∆T = 9 mK (3 mK) for QD1 (QD2).
3
0.10
T T
(a)
L
2
(e /h)
0.15
L
= 40 mK
G
0.05
= 1.32 K
0.00 x 3
0.0
V
T
(µV)
5.0
-5.0
-0.8
-0.7
-0.6
V
(V)
V
(V)
E
-0.5
(b)
(µV)
5.0
V
T
0.0
-5.0
-0.8
-0.7
E
-0.6
-0.5
FIG. 2: (color online) (a) Conductance G (upper panel) and the corresponding thermovoltage VT (lower panel) of QD1 as a function of the plunger-gate voltage VE . (b) Thermovoltage at seven different temperatures: TL = 40 mK (black), 66 mK (brown), 158 mK (cyan), 257 mK (blue), 425 mK (orange), 1.04 K (pink) and 1.5 K (purple).
Figure 2 (a) shows the conductance G and the corresponding thermovoltage VT of QD1 for an electrostatic charging energy EC = 1.43 meV at lattice temperatures TL = 40 mK (black lines) and 1.32 K (grey lines). At 1.32 K, thermal broadening determines the shape of the CB resonances. The corresponding thermovoltage signal shows a sawtooth-like line shape with a maximum in the vicinity of the center of the CB. Additional fine structure on the sawtooth line shape and is due to elevated temperatures and finite level spacings in the QD. At TL = 40 mK the conduction resonance peaks have an increased height, a reduced width, and are well separated by regimes of (approximately) zero conductance. The line shape of the corresponding thermovoltage now resembles more the negative derivative of the conductance G. The values of the thermovoltage extrema increase by a factor of three and 4
their positions are shifted towards the CB resonances. A small asymmetry between the thermovoltage values of positive and negative amplitude is observed for all measurements. Lower tunnel probabilities, for strongly negative plunger gate voltages VE , reduce this asymmetry (c.f. Fig. 2 and Fig. 4). The asymmetry is intrinsic and has been ascribed to multi channel tunneling processes12 and the energy dependent transmission probability of the tunnel barriers. Figure 2(b) shows VT for seven different temperatures in the range from TL = 1.32 K down to 40 mK. It is evident that the change in line shape occurs continuously. In the vicinity of the CB resonance the thermovoltage varies linearly with VE , its slope increases with decreasing T while in-between the CB resonances, a region where VT ≃ 0 develops. The observation of two different line shapes indicates that at different temperatures different transport mechanisms dominate the electronic transport properties. Near the CB resonances, the charge transport is dominated by sequential tunneling (ST) processes and is explained within the so-called orthodox model13 , where only first order tunneling processes are considered. In-between the resonances, the transport can also be due to ST processes, but only at relatively high temperatures (∼ 1 K). In ST transport, the average electron energy is proportional to an effective energy gap Eg which is defined as the difference between the Fermi energy of the leads and the energy of the closest QD state. Eg varies linearly between −EC∗ /2 and +EC∗ /2 with increasing electrochemical potential of the QD, ΦQD , and subsequently jumps back to −EC∗ /2 at the center of the CB. According to Eq. (1), the thermovoltage follows this sawtooth-like behavior. Thermal smearing at higher temperatures leads to a more sinusoidal variation of Eg and thus the maxima of the thermovoltage oscillations are located slightly away from the center of the CB. The ST mechanism thus explains the line shape at temperatures around 1 K. We attribute the low (mK) temperature line shape to the occurrence of (inelastic) cotunneling (CT) transport in between the CB resonances.8 At low temperatures, these higher order processes dominate the transport away from the CB resonance, because the ST processes are thermally activated and thus exponentially suppressed on lowering the temperature, while CT processes scale only according to a power law.14 Due to energy conservation, the average energy transferred by cotunneling processes is proportional to the temperature (hEco i ∝ T ). Therefore, the expected thermoelectric signal of CT processes is vanishingly small.8 Decreasing the sample temperature implies a transition from ST- to CT-dominated 5
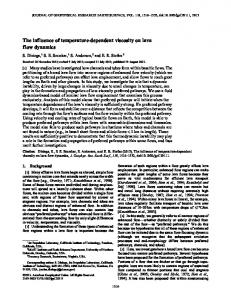
8.0 20.0
0.0
V
T
(µV)
6.0 4.0
-20.0
0.0
V
T
(µV)
2.0
-2.0 -4.0 -6.0
-0.80
TL
-0.75
V
E
-0.70 (V)
Te (mK)
0.039
0.183
0.066
0.243
0.158
0.350
0.257
0.600
0.425
0.912
1.040
1.096
1.319
1.659
-8.0 -0.80
-0.75
V
E
-0.70
-0.65
(V)
FIG. 3: (color online) Calculated thermovoltage for the orthodox (dotted lines) and CT-included model (full lines) as a function of VE . The dots indicate the maxima of the measured thermovoltage signal. The inset show the orthodox model at full scale.
transport in the CB regime away from the conductance resonances and thus a suppression of the thermovoltage signal in the corresponding gate voltage ranges. The sawtooth line shape becomes intermitted by regions of (nearly) zero signal amplitude, as observed in Fig. 2. In order to discuss this transition more quantitatively we compare the thermovoltage resonance at VE = −0.73 V with the behavior of the orthodox (pure ST)13 model, and a model that also includes CT effects8 . At TL = 1.32 K both models exhibit nearly the same thermovoltage amplitude and approximately the same line shape [c.f. Fig. 3]. For this temperature, our QD fulfills the condition h ¯ Γ